Most Requested Symbols


For the fifth consecutive week, there has been a change in the State Street Sector Model SSTREET. This week, the SPDR S&P Oil & Gas Equipment & Services ETF XES has been added to the Model. Recall that in order for an ETF to earn a spot within the State Street Sector Model SSTREET, it must be in a column of X's versus the S&P 500 Index SPX on a 6.5% relative strength chart. Over the past week of trading, the RS chart of XES vs SPX reversed up into X’s, warranting its addition to the SSTREET holdings. This Model remains fully-invested through sector-based ETFs within the broader State Street family of ETFs and is evaluated on a weekly basis. The number of holdings can vary based on sector leadership within changing markets. The Model draws from an inventory of 31 US sector products which range from cap-weighted broad sector exposure to equal-weighted sub-sector alternatives. With the addition of XES, the model is equally weighted across 21 positions, signaling toward the widespread strength in the market.
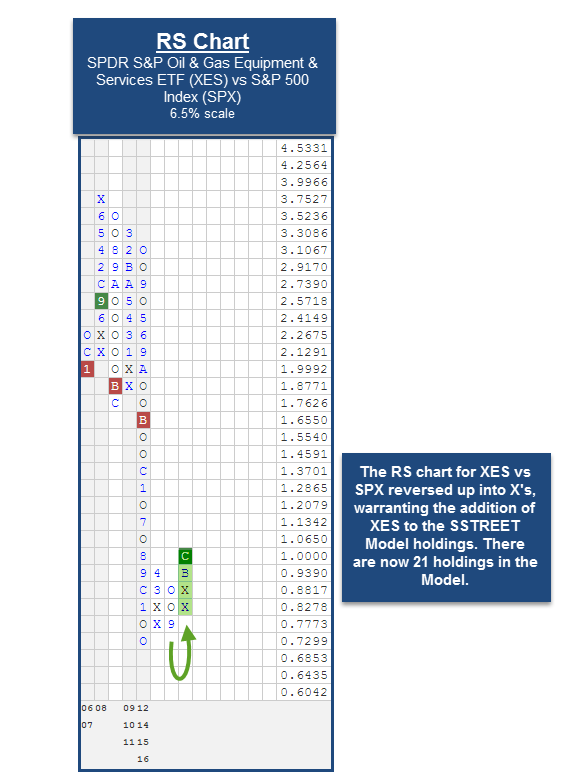
XES is an equal-weight Oil & Gas Equipment & Services fund with exposure to all S&P 500 components within that sector of the market. When looking at the default trend chart of XES, this fund has given two consecutive buy signals since September and currently has a fund score of 5.66, speaking to its strong relative strength and trending characteristics. Okay to buy here or on a pullback. Within the SSTREET model, XES will represent 4.76% moving forward and will bring the broad Energy exposure up to about 10% of the total portfolio.


Like a radar screen, the Weekly Activity Summary gives you a snap shot view of any technical changes to the State Street universe of ETFs. Included in the summary below are both long term technical changes and intermediate term technical changes.
| Symbol | Name | Price | Score | 30 Day Rtn | 90 Day Rtn | YTD Rtn |
|---|---|---|---|---|---|---|
| BNDS | SPDR Bloomberg Barclays Aggregate Bond ETF | 56.990 | 1.2588 | -2.797 | -4.053 | -0.105 |
| Symbol | Name | Price | Score | 30 Day Rtn | 90 Day Rtn | YTD Rtn |
|---|---|---|---|---|---|---|
| XLB | Materials Select Sector SPDR Fund | 50.430 | 4.2212 | 8.685 | 2.772 | 16.145 |
| SMEZ | SPDR EURO STOXX Small Cap ETF | 45.340 | 0.3635 | -0.242 | -5.206 | -6.284 |
| Symbol | Name | Price | Score | 30 Day Rtn | 90 Day Rtn | YTD Rtn |
|---|---|---|---|---|---|---|
| GII | The SPDR FTSE/Macquarie Global Infrastructure 100 | 44.750 | 2.3260 | -0.952 | -7.884 | 7.727 |
| GML | SPDR S&P Emerging Latin America ETF | 44.370 | 3.8773 | -6.910 | -6.078 | 26.195 |
| GMM | SPDR S&P Emerging Markets ETF | 58.220 | 2.9278 | -0.733 | -5.564 | 11.790 |
| GAF | SPDR S&P Emerging Middle East & Africa ETF | 55.240 | 2.3436 | -3.088 | -8.407 | 10.946 |
| GWX | SPDR S&P International Small Cap ETF | 30.077 | 2.2323 | 0.123 | -4.366 | 6.542 |
| BIL | SPDR Bloomberg Barclays 1-3 Month T-Bill ETF | 45.720 | 1.5597 | -0.044 | 0.000 | 0.088 |
| EWX | SPDR S&P Emerging SmallCap | 41.020 | 2.6875 | -1.299 | -5.852 | 8.778 |
| BABS | SPDR Nuveen Barclays Capital Build America Bond ETF | 66.930 | 4.9245 | 0.000 | 0.000 | 12.261 |
| EBND | SPDR Bloomberg Barclays Emerging Markets Local Bond ETF | 26.350 | 1.2218 | -5.216 | -7.511 | 7.201 |
| EDIV | SPDR S&P Emerging Markets Dividend ETF | 26.160 | 0.8706 | -2.642 | -10.072 | 10.287 |
| CBND | SPDR Bloomberg Barclays Issuer Scored Corporate Bond ETF | 31.495 | 2.7516 | -3.104 | -4.820 | 1.616 |
| GAL | SPDR SSgA Global Allocation ETF | 33.156 | 0.3599 | 1.178 | -3.363 | 0.870 |
| JSC | SPDR Russell/Nomura Small Cap Japan ETF | 56.870 | 3.2326 | 0.000 | 0.000 | 4.781 |
| IPK | SPDR S&P International Technology Sector | 33.020 | 3.3733 | -0.754 | -6.121 | 5.833 |
| ITR | SPDR Bloomberg Barclays Intermediate Term Credit Bond ETF | 33.880 | 2.0157 | -2.250 | -3.006 | 1.346 |
| LWC | SPDR Bloomberg Barclays Long Term Corporate Bond ETF | 39.230 | 2.7480 | -4.967 | -9.316 | 4.390 |
| MDYG | SPDR S&P 400 Mid Cap Growth ETF | 132.200 | 4.3939 | 9.546 | 0.941 | 12.243 |
| INKM | SPDR SSgA Income Allocation ETF (INKM) | 30.610 | 1.4738 | 0.262 | -4.709 | 3.482 |
| SPY | SPDR S&P 500 ETF Trust | 221.700 | 3.2312 | 6.305 | 1.228 | 8.746 |
| XLK | Technology Select Sector SPDR Fund | 47.280 | 4.0557 | 2.382 | -0.901 | 10.390 |
| XLY | Consumer Discretionary Select Sector SPDR Fund | 82.520 | 4.0174 | 7.546 | 1.789 | 5.577 |
| XPH | SPDR S&P Pharmaceuticals ETF | 39.330 | 1.1050 | 5.048 | -12.464 | -23.184 |
| WIP | SPDR Citi International Government Inflation-Protected Bond ETF | 52.710 | 0.7013 | -5.113 | -8.155 | 4.666 |
| SCPB | SPDR Bloomberg Barclays Short Term Corporate Bond ETF | 30.500 | 2.1340 | -0.587 | -0.910 | 0.329 |
| SPYG | SPDR S&P 500 Growth ETF | 104.235 | 3.6172 | 3.510 | -1.813 | 4.058 |
| XHE | SPDR S&P Health Care Equipment ETF | 49.490 | 3.8988 | 5.119 | -5.895 | 11.039 |
| RLY | SPDR SSgA Multi-Asset Real Return ETF (RLY) | 24.550 | 2.4845 | 3.043 | -1.366 | 10.337 |
| CJNK | Spdr Bofa Merrill Lynch Crossover | 25.650 | 3.0179 | -1.875 | -3.317 | 6.520 |
| WDIV | The SPDR S&P Global Dividend ETF | 61.480 | 2.0255 | 2.194 | -5.010 | 7.935 |
| IJNK | SPDR International High Yield Bond ETF | 23.533 | 3.7829 | 0.000 | 0.000 | 8.779 |
| QEMM | SPDR MSCI Emerging Markets StrategicFactors ETF | 51.350 | 2.9741 | -2.209 | -6.296 | 8.265 |
| QAUS | SPDR MSCI Australia StrategicFactors ETF | 48.174 | 3.2002 | 1.719 | -2.953 | 6.970 |
| QDEU | SPDR MSCI Germany StrategicFactors ETF | 49.849 | 0.9454 | -0.248 | -5.945 | -3.438 |
| QJPN | SPDR MSCI Japan StrategicFactors ETF | 65.739 | 3.7323 | -3.254 | -1.574 | 1.952 |
| SYG | SPDR MFS Systematic Growth Equity ETF | 62.650 | 4.7400 | 4.864 | 0.041 | 3.823 |
| ULST | SPDR SSgA Ultra Short Term Bond ETF | 40.195 | 1.4574 | -0.038 | 0.106 | 0.739 |
| TOTL | SPDR Doubleline Total Return Tactical ETF | 48.750 | 2.4952 | -2.108 | -2.869 | 0.309 |
| Symbol | Name | Price | Score | 30 Day Rtn | 90 Day Rtn | YTD Rtn |
|---|---|---|---|---|---|---|
| HYMB | SPDR Nuveen S&P High Yield Municipal Bond ETF | 55.200 | 2.1951 | -5.512 | -7.118 | -3.243 |
| BNDS | SPDR Bloomberg Barclays Aggregate Bond ETF | 56.990 | 1.2588 | -2.797 | -4.053 | -0.105 |
| TFI | SPDR Nuveen Bloomberg Barclays Municipal Bond ETF | 47.180 | 1.4047 | -4.706 | -6.277 | -3.240 |
| Symbol | Name | Price | Score | 30 Day Rtn | 90 Day Rtn | YTD Rtn |
|---|---|---|---|---|---|---|
| FEU | SPDR STOXX Europe 50 ETF | 29.250 | 0.2032 | 2.237 | -5.858 | -8.077 |
| FEZ | SPDR EURO STOXX 50 ETF | 32.520 | 0.5775 | 2.329 | -3.759 | -5.547 |
| CWI | SPDR MSCI ACWIsm ex-US ETF | 31.650 | 2.2814 | 1.410 | -4.062 | 2.760 |
| GII | The SPDR FTSE/Macquarie Global Infrastructure 100 | 44.750 | 2.3260 | -0.952 | -7.884 | 7.727 |
| GUR | SPDR S&P Emerging Europe ETF | 26.860 | 2.6961 | 6.672 | -0.112 | 19.484 |
| GXC | SPDR S&P China ETF | 75.850 | 2.6601 | 0.637 | -5.448 | 3.211 |
| GWX | SPDR S&P International Small Cap ETF | 30.077 | 2.2323 | 0.123 | -4.366 | 6.542 |
| GWL | SPDR S&P World (ex-US) ETF | 25.950 | 1.5095 | 2.260 | -3.135 | 0.777 |
| DWX | SPDR S&P International Dividend | 36.560 | 2.6974 | 3.131 | -2.766 | 9.592 |
| CWB | SPDR Bloomberg Barclays Convertible Bond ETF | 45.490 | 2.3891 | 2.663 | -1.473 | 5.106 |
| FLRN | SPDR Bloomberg Barclays Investment Grade Floating Rate ETF | 30.630 | 2.6923 | 0.098 | 0.262 | 0.680 |
| MTK | SPDR Morgan Stanley Technology ETF | 59.840 | 4.4026 | 2.186 | 0.605 | 10.651 |
| JNK | SPDR Bloomberg Barclays High Yield Bond ETF | 36.260 | 2.6235 | 1.228 | -0.956 | 6.930 |
| IPD | SPDR S&P International Consumer Discretionary Sector | 35.666 | 2.7796 | 0.855 | -4.077 | -3.084 |
| IRY | SPDR S&P International Health Care Sector | 42.140 | 1.0954 | -2.612 | -12.790 | -16.336 |
| IPN | SPDR S&P International Industrials Sector | 29.800 | 2.5244 | 2.055 | -3.308 | 7.387 |
| IRV | SPDR S&P International Materials Sector | 20.252 | 4.4456 | 1.927 | 0.358 | 19.623 |
| INKM | SPDR SSgA Income Allocation ETF (INKM) | 30.610 | 1.4738 | 0.262 | -4.709 | 3.482 |
| XLK | Technology Select Sector SPDR Fund | 47.280 | 4.0557 | 2.382 | -0.901 | 10.390 |
| SJNK | SPDR Bloomberg Barclays Capital Short Term High Yield Bond ETF | 27.540 | 1.9374 | 1.250 | 0.073 | 7.201 |
| SRLN | SPDR Blackstone / GSO Senior Loan ETF | 47.330 | 1.8761 | 0.574 | 0.446 | 2.601 |
| QEFA | SPDR MSCI EAFE StrategicFactors ETF | 53.130 | 1.8692 | -0.691 | -5.395 | -3.330 |
The distribution curve places each ETF on a bell curve according to their respective degrees of overbought or oversold status using a 10-week distribution. ETFs that are statistically oversold will appear on the left-hand side of the bell curve, while those that have become statistically overbought will appear on the right-hand side of the bell curve. Perhaps the most useful attribute of this feature is that it displays the entire universe on the curve at one time with an "average level" to give us a general picture of whether the State Street ETF universe is generally overbought on a near-term basis, or generally oversold. Our best opportunities are to buy strong market ETFs that have regressed back toward mean conditions based on market weakness, or have become oversold based upon extreme market weakness.
Weekly Distribution is a short-term gauge that is most helpful in timing entry and exit points, while the longer-term information of trend and relative strength is a more controlling factor in the decision of whether to buy or sell. The Distribution Curve below displays those ETFs with positive RS in uppercase letters and those ETFs with poor RS versus the market in lowercase letters. As well, those ETFs that are on a Point & Figure Buy signal appear in Green letters, while those on Sell signals can appear in Red letters.
The average Bullish Percent reading this week is 57.49% up 0.77% from the previous week
| -100--80 | -80--60 | -60--40 | -40--20 | -20-0 | 0-20 | 20-40 | 40-60 | 60-80 | 80-100 | 100-> | ||||
 | ||||||||||||||

The DWA Matrix uses a Point & Figure relative strength comparison of each index to one another to identify the strongest and the weakest among the universe used. The ETFs with the most relative strength buy signals (suggesting outperformance) versus the others in the group are listed at the top. These ETFs should be overweighted in the portfolio. Those ETFs with the least amount of relative strength buy signals versus the others in the group are listed at the bottom. These ETFs should be underweighted in the portfolio.
| Ticker | Name | Buys | Xs | Tech Attribute/ Score |
|---|---|---|---|---|
| MDYG | SPDR S&P 400 Mid Cap Growth ETF | 14 | 8 | 4.39 |
| MDY | SPDR S&P MIDCAP 400 ETF Trust | 13 | 15 | 5.64 |
| SPYG | SPDR S&P 500 Growth ETF | 13 | 9 | 3.62 |
| SLYG | SPDR Dow Jones Small Cap Growth ETF | 11 | 13 | 4.61 |
| MDYV | SPDR S&P Mid Cap Value ETF | 10 | 14 | 5.77 |
| SLY | SPDR S&P 600 Small Cap ETF | 10 | 12 | 4.60 |
| ONEK | SPDR Russell 1000 ETF | 8 | 9 | 3.60 |
| SPY | SPDR S&P 500 ETF Trust | 8 | 7 | 3.23 |
| THRK | SPDR Russell 3000 ETF | 8 | 7 | 3.65 |
| DIA | SPDR Dow Jones Industrial Average ETF Trust | 8 | 4 | 3.79 |
| SDY | SPDR S&P Dividend ETF | 7 | 8 | 3.51 |
| SLYV | SPDR Dow Jones Small Cap Value ETF | 6 | 12 | 4.66 |
| SMD | SPDR S&P 1000 ETF | 5 | 9 | 3.38 |
| SPYV | SPDR S&P 500 Value ETF | 4 | 7 | 3.80 |
| CWI | SPDR MSCI ACWIsm ex-US ETF | 2 | 1 | 2.28 |
| DGT | SPDR DJ Global Titans ETF | 1 | 2 | 3.39 |
| GLD | SPDR Gold Trust | 0 | 0 | 1.77 |
Ticker
Name
Buys
Xs
Tech
Attribute/
Score
RBL
SPDR S&P Russia ETF
22
22
5.92
DIA
SPDR Dow Jones Industrial Average ETF Trust
21
20
3.79
SPY
SPDR S&P 500 ETF Trust
20
16
3.23
JSC
SPDR Russell/Nomura Small Cap Japan ETF
19
10
3.23
DGT
SPDR DJ Global Titans ETF
15
11
3.39
JPP
SPDR Russell/Nomura PRIME Japan ETF
15
5
3.11
RWO
SPDR DJ Wilshire Global Real Estate
15
5
1.74
GMF
SPDR S&P Emerging Asia Pacific ETF
12
20
3.24
GXC
SPDR S&P China ETF
12
18
2.66
GML
SPDR S&P Emerging Latin America ETF
12
9
3.88
GWX
SPDR S&P International Small Cap ETF
11
15
2.23
GII
The SPDR FTSE/Macquarie Global Infrastructure 100
11
11
2.33
RWX
SPDR DJ Wilshire International Real Estate ETF
11
3
0.13
GUR
SPDR S&P Emerging Europe ETF
10
12
2.70
GWL
SPDR S&P World (ex-US) ETF
10
8
1.51
CWI
SPDR MSCI ACWIsm ex-US ETF
9
8
2.28
MDD
SPDR S&P International Mid Cap
9
8
2.98
GAF
SPDR S&P Emerging Middle East & Africa ETF
9
6
2.34
GMM
SPDR S&P Emerging Markets ETF
8
18
2.93
EWX
SPDR S&P Emerging SmallCap
8
17
2.69
FEZ
SPDR EURO STOXX 50 ETF
5
6
0.58
BIK
SPDR S&P BRIC 40
4
16
4.27
DWX
SPDR S&P International Dividend
2
8
2.70
FEU
SPDR STOXX Europe 50 ETF
2
4
0.20
| Ticker | Name | Buys | Xs | Tech Attribute/ Score |
|---|---|---|---|---|
| XME | SPDR S&P Metals & Mining ETF | 40 | 36 | 5.98 |
| KRE | SPDR S&P Regional Banking ETF | 37 | 39 | 5.80 |
| XSD | SPDR S&P Semiconductor ETF | 36 | 31 | 5.85 |
| XOP | SPDR S&P Oil & Gas Exploration & Production ETF | 34 | 38 | 5.84 |
| XES | SPDR S&P Oil & Gas Equipment & Services ETF | 33 | 40 | 5.66 |
| XAR | SPDR S&P Aerospace & Defense ETF | 33 | 33 | 5.85 |
| XTN | SPDR S&P Transportation ETF | 32 | 35 | 5.88 |
| MTK | SPDR Morgan Stanley Technology ETF | 32 | 24 | 4.40 |
| KBE | SPDR S&P Bank ETF | 31 | 39 | 5.68 |
| KIE | SPDR S&P Insurance ETF | 30 | 32 | 4.52 |
| XSW | SPDR S&P Software & Services ETF | 29 | 24 | 4.99 |
| XLF | Financial Select Sector SPDR Fund | 28 | 33 | 5.78 |
| XLY | Consumer Discretionary Select Sector SPDR Fund | 28 | 17 | 4.02 |
| XTL | SPDR S&P Telecom ETF | 27 | 31 | 4.81 |
| XLI | Industrial Select Sector SPDR Fund | 27 | 25 | 3.85 |
| XLK | Technology Select Sector SPDR Fund | 26 | 21 | 4.06 |
| XBI | SPDR S&P Biotech ETF | 26 | 20 | 3.70 |
| XHE | SPDR S&P Health Care Equipment ETF | 26 | 14 | 3.90 |
| XLE | Energy Select Sector SPDR Fund | 24 | 27 | 4.67 |
| 23 | 17 | N/A | ||
| IPK | SPDR S&P International Technology Sector | 20 | 18 | 3.37 |
| XLB | Materials Select Sector SPDR Fund | 19 | 21 | 4.22 |
| IPW | SPDR S&P International Energy Sector | 18 | 20 | 3.37 |
| KCE | SPDR S&P Capital Markets ETF | 16 | 31 | 3.96 |
| XRT | SPDR S&P Retail ETF | 16 | 21 | 2.91 |
| XLV | Health Care Select Sector SPDR Fund | 16 | 12 | 2.51 |
| IRV | SPDR S&P International Materials Sector | 15 | 21 | 4.45 |
| XHB | SPDR S&P Homebuilders ETF | 14 | 21 | 2.75 |
| IPN | SPDR S&P International Industrials Sector | 13 | 14 | 2.52 |
| XLU | Utilities Select Sector SPDR Fund | 13 | 10 | 2.13 |
| XLP | Consumer Staples Select Sector SPDR Fund | 12 | 9 | 1.91 |
| IPD | SPDR S&P International Consumer Discretionary Sector | 11 | 15 | 2.78 |
| RWO | SPDR DJ Wilshire Global Real Estate | 11 | 8 | 1.74 |
| RWR | SPDR Dow Jones REIT ETF | 11 | 7 | 1.51 |
| GLD | SPDR Gold Trust | 11 | 2 | 1.77 |
| IPF | SPDR S&P International Financial Sector | 9 | 26 | 3.69 |
| XPH | SPDR S&P Pharmaceuticals ETF | 7 | 14 | 1.11 |
| XHS | SPDR S&P Health Care Services ETF | 7 | 9 | 2.47 |
| IPS | SPDR S&P International Consumer Staples Sector | 7 | 5 | 0.37 |
| IRY | SPDR S&P International Health Care Sector | 5 | 1 | 1.10 |
| IST | SPDR S&P International Telecommunications Sector | 4 | 3 | 0.04 |
| IPU | SPDR S&P International Utilities Sector | 0 | 2 | 0.05 |
| Ticker | Name | Buys | Xs | Tech Attribute/ Score |
|---|---|---|---|---|
| CWB | SPDR Bloomberg Barclays Convertible Bond ETF | 20 | 22 | 2.39 |
| BABS | SPDR Nuveen Barclays Capital Build America Bond ETF | 20 | 13 | 4.92 |
| BWX | SPDR Bloomberg Barclays International Treasury Bond ETF | 16 | 4 | 0.61 |
| JNK | SPDR Bloomberg Barclays High Yield Bond ETF | 15 | 18 | 2.62 |
| INY | SPDR Barclays Capital New York Municipal Bond | 15 | 7 | 4.67 |
| TFI | SPDR Nuveen Bloomberg Barclays Municipal Bond ETF | 15 | 4 | 1.40 |
| ITR | SPDR Bloomberg Barclays Intermediate Term Credit Bond ETF | 14 | 14 | 2.02 |
| IPE | SPDR Bloomberg Barclays TIPS ETF | 13 | 16 | 1.82 |
| EBND | SPDR Bloomberg Barclays Emerging Markets Local Bond ETF | 11 | 9 | 1.22 |
| LWC | SPDR Bloomberg Barclays Long Term Corporate Bond ETF | 11 | 3 | 2.75 |
| SRLN | SPDR Blackstone / GSO Senior Loan ETF | 10 | 19 | 1.88 |
| SCPB | SPDR Bloomberg Barclays Short Term Corporate Bond ETF | 10 | 15 | 2.13 |
| BIL | SPDR Bloomberg Barclays 1-3 Month T-Bill ETF | 10 | 14 | 1.56 |
| ITE | SPDR Bloomberg Barclays Intermediate Term Treasury ETF | 10 | 11 | 0.35 |
| SHM | SPDR Nuveen Bloomberg Barclays Short Term Municipal Bond ETF | 10 | 10 | 2.00 |
| WIP | SPDR Citi International Government Inflation-Protected Bond ETF | 10 | 8 | 0.70 |
| FLRN | SPDR Bloomberg Barclays Investment Grade Floating Rate ETF | 9 | 16 | 2.69 |
| BNDS | SPDR Bloomberg Barclays Aggregate Bond ETF | 9 | 12 | 1.26 |
| MBG | SPDR Bloomberg Barclays Mortgage Backed Bond ETF | 7 | 8 | 1.20 |
| PSK | SPDR Wells Fargo Preferred Stock ETF | 6 | 10 | 1.52 |
| IBND | SPDR Bloomberg Barclays International Corporate Bond ETF | 4 | 9 | 1.34 |
| BWZ | SPDR Bloomberg Barclays Short Term International Treasury Bond ETF | 3 | 8 | 0.44 |
| TLO | SPDR Bloomberg Barclays Long Term Treasury ETF | 2 | 2 | 0.23 |
The State Street ETF Model Portfolios are designed to identify major leadership themes within a market, doing so through the use of Point and Figure relative strength tools. Each of the State Street Models are evaluated weekly and guided by a rules-based investment methodology. The construction of the State Street Sector ETF Portfolio is done through an analysis of the each State Street Sector ETF relative strength chart versus the S&P 500, while the Global Sector Rotation model employs a relative strength matrix ranking of the model's inventory. In either case, those with strong relative strength make the cut and are eligible to be included in the portfolio, while those that aren't, will sit upon the sideline. For more information on the portfolio construction and back testing please see the information files on the Models Page. To enter a portfolio amount and see shares to be purchased as well as modify the portfolio to your specifications, click here. (Note: All State Street ETF Models are updated Wednesday mornings by 9:30 am EST)
| ETF Name | Symbol | DWA Suggested Weighting | Date Added |
|---|---|---|---|
| SPDR Morgan Stanley Technology ETF | MTK | 4.762% | 03/11/2009 |
| SPDR S&P Bank ETF | KBE | 4.762% | 11/15/2016 |
| SPDR S&P Insurance ETF | KIE | 4.762% | 03/19/2013 |
| SPDR S&P Regional Banking ETF | KRE | 4.762% | 11/15/2016 |
| SPDR Dow Jones REIT ETF | RWR | 4.762% | 01/20/2015 |
| Financial Select Sector SPDR Fund | XLF | 4.762% | 11/15/2016 |
| Industrial Select Sector SPDR Fund | XLI | 4.762% | 05/04/2010 |
| Technology Select Sector SPDR Fund | XLK | 4.762% | 02/25/2009 |
| Utilities Select Sector SPDR Fund | XLU | 4.762% | 02/09/2016 |
| Health Care Select Sector SPDR Fund | XLV | 4.762% | 01/28/2014 |
| Consumer Discretionary Select Sector SPDR Fund | XLY | 4.762% | 02/24/2010 |
| SPDR S&P Semiconductor ETF | XSD | 4.762% | 02/25/2014 |
| SPDR S&P Biotech ETF | XBI | 4.762% | 11/15/2016 |
| SPDR S&P Metals & Mining ETF | XME | 4.762% | 02/09/2016 |
| SPDR S&P Oil & Gas Equipment & Services ETF | XES | 4.762% | 12/06/2016 |
| SPDR S&P Oil & Gas Exploration & Production ETF | XOP | 4.762% | 04/19/2016 |
| SPDR S&P Transportation ETF | XTN | 4.762% | 11/15/2016 |
| SPDR S&P Telecom ETF | XTL | 4.762% | 11/22/2016 |
| SPDR S&P Health Care Equipment ETF | XHE | 4.762% | 09/20/2016 |
| SPDR S&P Aerospace & Defense ETF | XAR | 4.762% | 10/25/2011 |
| SPDR S&P Software & Services ETF | XSW | 4.762% | 10/25/2011 |
* - Model Inception:1/17/2007
* - Model Inception:10/15/2008
* - Model Inception:10/28/2008
| ETF Name | Symbol | DWA Suggested Weighting | Date Added |
|---|---|---|---|
| SPDR Morgan Stanley Technology ETF | MTK | 20.000% | 10/25/2016 |
| SPDR S&P Semiconductor ETF | XSD | 20.000% | 11/10/2015 |
| SPDR S&P Metals & Mining ETF | XME | 20.000% | 08/09/2016 |
| SPDR S&P Oil & Gas Exploration & Production ETF | XOP | 20.000% | 08/30/2016 |
| SPDR S&P Aerospace & Defense ETF | XAR | 20.000% | 07/15/2014 |
* - Model Inception: 07/28/2010
| ETF Name | Symbol | DWA Suggested Weighting | Date Added |
|---|---|---|---|
| SPDR Bloomberg Barclays Convertible Bond ETF | CWB | 25.000% | 08/23/2016 |
| SPDR Bloomberg Barclays High Yield Bond ETF | JNK | 25.000% | 11/01/2016 |
| SPDR Bloomberg Barclays Intermediate Term Credit Bond ETF | ITR | 25.000% | 11/15/2016 |
| SPDR Wells Fargo Preferred Stock ETF | PSK | 25.000% | 01/19/2016 |
* - Model Inception: 04/27/2011
State Street (Wed.)
Loading, Please Wait...
