Most Requested Symbols

Small caps remain actionable... but have lost some relative strength with recent market action. We discuss this and how it helps you build out the full picture when considering an investment framework
Inflation is the consumer’s biggest enemy, and anyone buying gas or groceries over the last several years can attest to that. Unfortunately, the impact of inflation often goes beyond our budgets, with portfolios taking a hit while strength shifts underneath the surface.
Introducing the new Option Ideas page, which consolidates recommended option strategies based on user-defined criteria.
Weekly Rundown Video – May 13, 2026
Weekly rundown with NDW analyst team covering all major asset classes.
Weekly rundown with NDW analyst team covering all major asset classes.
At the cornerstone of NDW analysis lies relative strength. Relative strength is pivotal in understanding which asset(s) are fit for investment over others, rather than focusing on which direction a security is heading. In simple terms, your clients might be happy if you tell them their portfolio was up 10% in any given year…. but only if you omitted the fact that the broader market was up 20%. Said otherwise, relative strength is a key player in understanding who is leading that pack, and is a fundamental building block of NDW strategies and analysis.
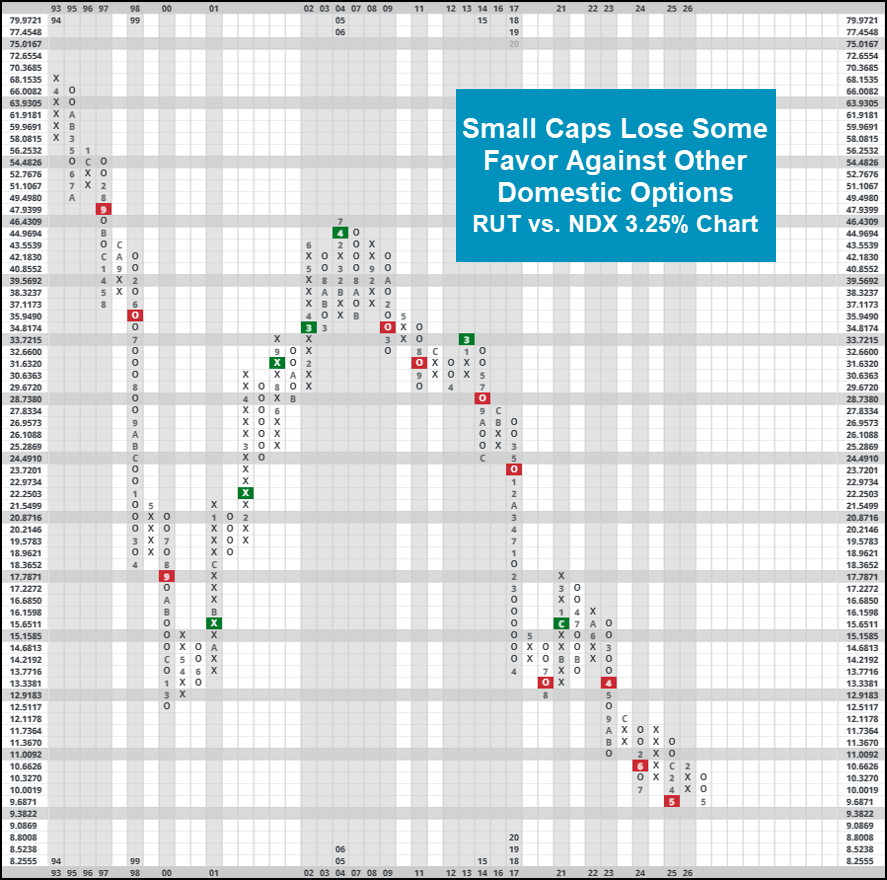
Given the understanding that relative strength is important, it goes without saying that many members of the NDW analyst team utilize different relative strength tests to help identify the everchanging leadership landscape. For many of us, these tracked RS charts will utilize some combination of broad domestic equity indices vs. cash, other major benchmarks, sectors, or some combination of the group. Over the last week, one major shift between major domestic representatives came on a 3.25% chart between the Russell 2000 (RUT) and the Nasdaq-100 (NDX). With action on 5/13, this chart reversed back down into O’s favoring NDX, matching its lowest point of “relative price” dating back to May of 2025. This marks the first constructive move on this chart in favor of NDX of 2026. However, perhaps the most important point of nuance here builds on a often discussed topic within NDW research: Consistency. While February’s reversal towards RUT was certainly interesting, it by no means would have convinced the astute trend follower that small caps had taken over their large cap tech counterparts for the long-term. Those following an RS Switching (owns whichever asset is on a buy signal) between [RUT & NDX would have been rewarded with a portfolio value that surpasses a buy and hold value of holding either asset on its own.
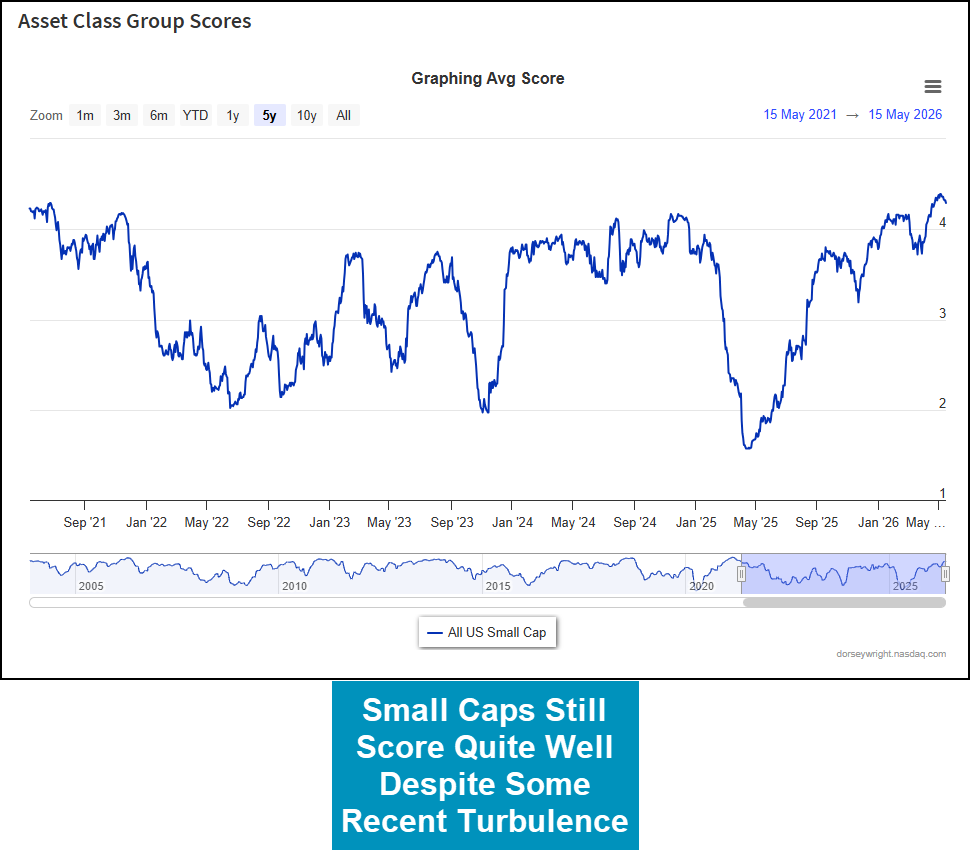
As discussed previously, relative strength can help identify which assets between a group are relatively strong, it is an important point to note that in depth analysis of a group’s absolute performance can also qualify specific assets fit for investment, particularly when considering typical portfolio constraints. Said more plainly, in a world where deploying all of a client’s portfolio to NDX would violate several compliance requirements, knowing that there are other “strong” asset groups allows you to properly diversify into different asset classes. While still relative by nature, utilizing NDW’s broad ranking tools like the DALI rankings or Asset Class Group Scores Page can help support a groups overall strength (or perhaps, lack thereof.) For instance, even though small caps have weakened against other areas, the All Small Caps group on the ACGS page scores quite strongly with an average score of 4.29. This outpaces several other areas, but does notably lag behind the S&P 500/core group- arguably the most important benchmark when deciding your broader small cap exposure. When you are looking for which names to pick, NDW offers our small cap buy list, which offers lists of technically strong small cap options across various sectors. As always, keep an eye on the charts to be notified of any important changes as they occur.

Inflation is the consumer’s biggest enemy, and anyone buying gas or groceries over the last several years can attest to that. Unfortunately, the impact of inflation often goes beyond our budgets, with portfolios taking a hit while strength shifts underneath the surface. Higher inflation is combated with higher interest rates from the Fed, lowering fixed income prices while slowing down the economy, often shrinking equity valuations as well. This past Friday, the S&P 500 fell 1.2% as the 10‑year Treasury yield pushed well above 4.5%—a level that has recently worried Wall Street and is often associated with pressure on equity valuations as discount rates reset higher. However, not all areas face headwinds from higher inflation. With the prices of goods and resources rising, commodities are a natural beneficiary, and the group has been one of the best performing areas of the market this year as inflation worries grow.
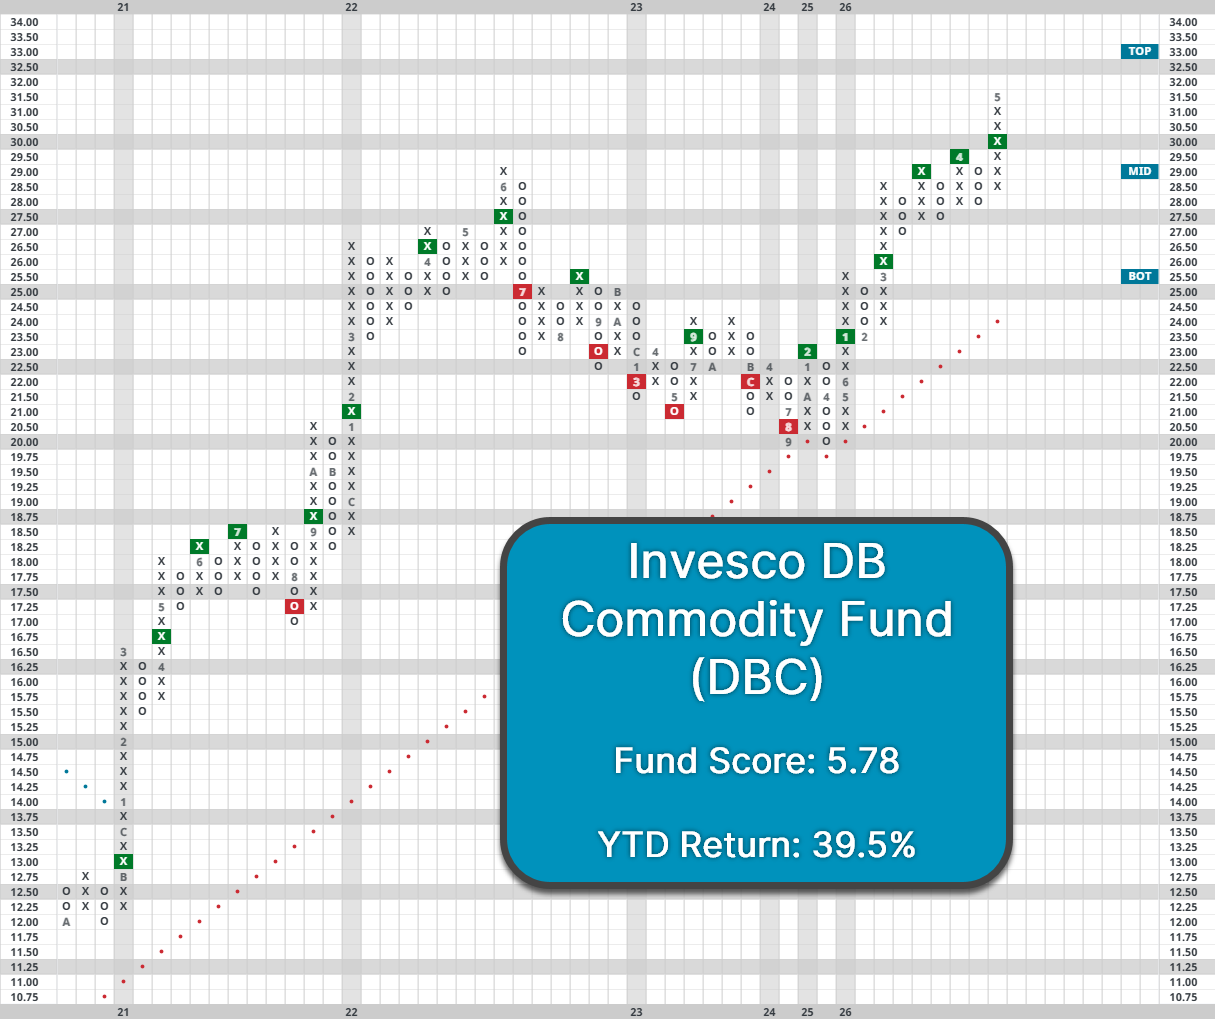
The Invesco DB Commodity Index Tracking Fund (DBC) is up nearly 40% YTD and has consistently pushed higher over that span. The fund is on a streak of five consecutive buy signals—its longest since the asset class rallied from its COVID lows. DBC’s improvement over that span has pushed its fund score up to a near-perfect 5.79, in addition to a sharply positive score direction of 3.59. Despite its rapid gains, the fund trades in relatively actionable territory with an OBOS reading around 50%. Initial support for the fund lies between $27 and $28, with the bullish support line at $24. While commodities could be hurt by a resolution of the Iran conflict if oil prices fall back down to Earth, the group’s long-term relative strength remains attractive for now.
In addition to hurting some of the most common parts of portfolios, inflation can also disrupt established norms. Fixed income is seen as the biggest staple of diversification from equities, but when rates are increasing or at higher levels, those diversification benefits can fall apart. Over the past year, AGG has a positive correlation of 0.27 with the S&P 500. Additionally, environments where 2yr rates (light gray) are high or rising are more likely to see higher sustained correlations, as was the case for much of the 90s. Meanwhile, commodities have served as a better portfolio diversifier over the past year, with DBC displaying a correlation of negative 0.22 with SPX. While there’s no guarantee it will stay around there, periods like the 90s or 2022 to 2024 show that it’s possible for commodities to serve as a better diversifier than bonds for a sustained time.

Ultimately, the outlook of the two asset classes is largely a function of where monetary policy needs to adjust. The two-year Treasury yield is often the best indication of near-term policy expectations for where the Federal Reserve will move interest rates. When the US2YR rate increases, usually in response to elevated inflation, commodities have performed much better while bonds have struggled. Specifically, if US2YR rose in a calendar year, DBC gained 14.2% while AGG rose 0.9%. Conversely, if the two-year rate fell on the year, DBC gained 1.2% while AGG gained 9.1%. If policy is expected to lean more hawkish over the next year, then it would make sense to prefer commodities over bonds. Unfortunately, there’s no magic crystal ball we can use to predict exactly what rates will do over the next year, even if there might be solid guesses.
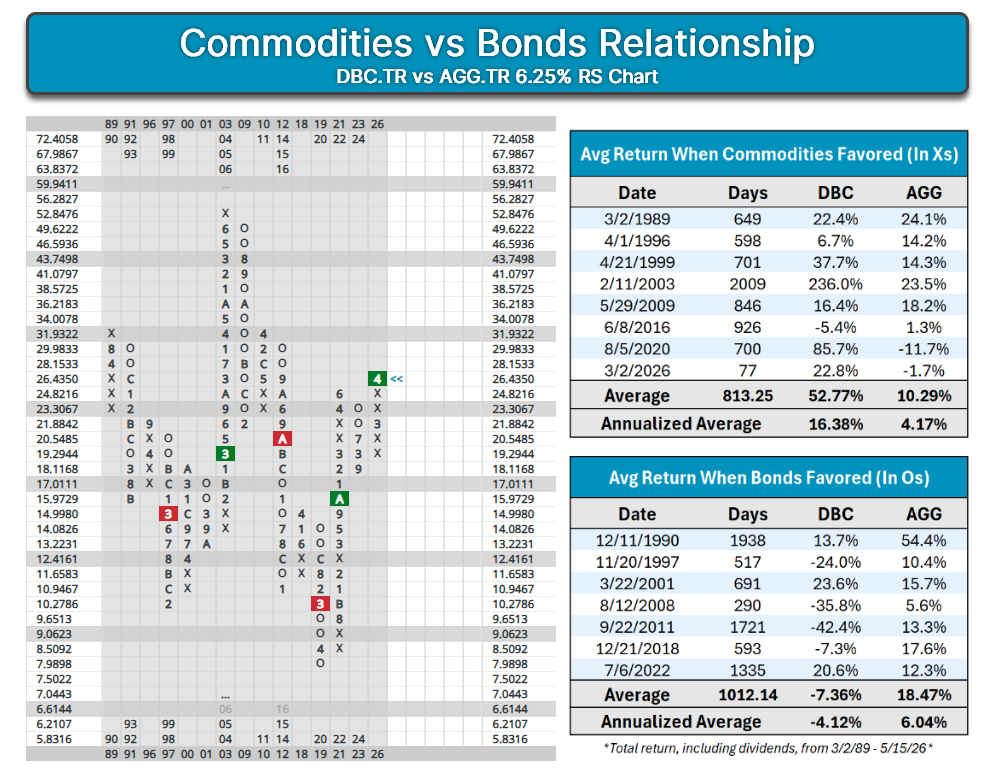
Rather than making portfolio decisions off predictions, relative strength has been just as good as an indication of whether an environment will favor commodities or bonds. Looking relative strength chart between DBC and AGG on a 6.5% scale (including their dividends), following column changes have been extremely profitable. When commodities are favored and the chart is in Xs, DBC averaged an annualized return of 16.5% compared to 4.2% for AGG. When bonds are favored and the chart is in Os, then DBC averages an annual decline of 4.1% compared to a 6% gain for AGG. In essence, following the RS chart has been just as effective as if you were able to predict what rates would be a year in the future, underscoring the relationship’s consistency. Granted, it's unrealistic to assume that investors can come entirely out of fixed income, but the relationship is still serves as a solid indicator.
With DBC remaining in Xs while the broader asset class sits well ahead of fixed income in DALI, the weight of the technical evidence suggests that our current environment is more conducive to higher rates and inflation. Additionally, inflation has remained stubbornly elevated recently, mentioned in last week’s fixed income update, supporting the need for a potential rise in interest rates over the next couple of years. If that scenario does play out, overweighting commodities could help defend against those moves from both a return and diversification perspective.
Join us for a webinar on the new tool Wednesday, May 27, 2026, at 2pm EST!
Option Ideas Purpose
The new experience allows you to identify the highest-ranking option strategies across bullish and bearish objectives. You can customize the report by objective, strategy type, timeframe, and risk profile, then review ranked options strategies based on key metrics such as probability of profit, risk/reward, breakeven, return potential, liquidity, implied volatility.
This tool is powered by OptionsPlay and uses their proprietary OptionsPlay score to easily compare strategies against each other. The result is a structured workflow for identifying which securities may offer the most attractive options strategy candidates within a Dorsey Wright-aligned universe. Options Ideas helps you move from technical research to options strategy evaluation more efficiently. The experience aligns each options strategy with the appropriate Dorsey Wright technical view.
Report Filters
Options Ideas is designed to help users find options strategies that align with Dorsey Wright’s directional view, split into bullish and bearish tabs. Bullish strategies are surfaced on securities identified through Dorsey Wright’s relative strength and point-and-figure process as stronger or more favorable. Specifically, these include securities with Technical Attribute ratings/Fund Scores of 3 or higher. Bearish strategies are aligned with securities that meet Dorsey Wright’s bearish or weaker directional criteria. These include securities with Technical Attribute ratings/Fund Scores below 3.

Customize the Experience to Match Personal Preferences
Every options user has different preferences. Some prioritize income. Others prefer defined-risk directional exposure. Some want shorter-dated strategies, while others prefer longer timeframes. Some may favor more conservative risk profiles, while others may look for higher-return opportunities.
Options Ideas allows users to customize the report based on their preferences, including:
The report then ranks the strategy candidates based on those selected preferences.

Rank Option Strategies from Most Attractive to Least Attractive
Options Ideas does more than list potential options trades. It ranks options strategy candidates so users can quickly identify which symbols may offer the most attractive options opportunities within a selected universe.
The ranking process incorporates key options metrics such as risk/reward, probability of profit, breakeven, return potential, liquidity, implied volatility, and OptionsPlay Score.
This helps users focus their attention on the strongest options strategy candidates first.
Options Strategy Details
To view the details of the suggested option contract for a given ticker, click anywhere in that ticker's row to expand the detail view. This will show information such as the strike price, expiration date, and other relevant data related to the option contract. This section also includes a plain English description of the suggested strategy.

If the suggested strategy involves more than one leg, the details section will show information for both contracts required to properly employ the strategy.

More information, including a glossary of terms used, can be found by accessing the "Help" button in the upper right hand side of the page. Note that users must have access to the OptionsPlay add-on in order to view this page. Click here for more information on signing up for the tool.

Average Level
20.31
| < - -100 | -100 - -80 | -80 - -60 | -60 - -40 | -40 - -20 | -20 - 0 | 0 - 20 | 20 - 40 | 40 - 60 | 60 - 80 | 80 - 100 | 100 - > |
|---|---|---|---|---|---|---|---|---|---|---|---|
|
Buy signalrsp
|
|||||||||||
|
Buy signalIJH
|
|||||||||||
|
Buy signalijr
|
Buy signalSPY
|
||||||||||
|
Buy signalhyg
|
Sell signaldx/y
|
Buy signalGSG
|
Buy signaliwm
|
Buy signalVOOG
|
|||||||
|
Sell signaltlt
|
Sell signalagg
|
Sell signallqd
|
Buy signaldvy
|
Buy signalefa
|
Sell signalUSO
|
Buy signalEEM
|
Buy signalXLG
|
||||
|
Sell signalief
|
Buy signalshy
|
Sell signalgld
|
Buy signalfxe
|
Buy signalicf
|
Sell signaldia
|
Buy signalVOOV
|
Buy signalGCC
|
Buy signalONEQ
|
Buy signalQQQ
|
||
| < - -100 | -100 - -80 | -80 - -60 | -60 - -40 | -40 - -20 | -20 - 0 | 0 - 20 | 20 - 40 | 40 - 60 | 60 - 80 | 80 - 100 | 100 - > |
| AGG | iShares US Core Bond ETF |
| USO | United States Oil Fund |
| DIA | SPDR Dow Jones Industrial Average ETF |
| DVY | iShares Dow Jones Select Dividend Index ETF |
| DX/Y | NYCE U.S.Dollar Index Spot |
| EFA | iShares MSCI EAFE ETF |
| FXE | Invesco CurrencyShares Euro Trust |
| GLD | SPDR Gold Trust |
| GSG | iShares S&P GSCI Commodity-Indexed Trust |
| HYG | iShares iBoxx $ High Yield Corporate Bond ETF |
| ICF | iShares Cohen & Steers Realty ETF |
| IEF | iShares Barclays 7-10 Yr. Tres. Bond ETF |
| LQD | iShares iBoxx $ Investment Grade Corp. Bond ETF |
| IJH | iShares S&P 400 MidCap Index Fund |
| ONEQ | Fidelity Nasdaq Composite Index Track |
| QQQ | Invesco QQQ Trust |
| RSP | Invesco S&P 500 Equal Weight ETF |
| IWM | iShares Russell 2000 Index ETF |
| SHY | iShares Barclays 1-3 Year Tres. Bond ETF |
| IJR | iShares S&P 600 SmallCap Index Fund |
| SPY | SPDR S&P 500 Index ETF Trust |
| TLT | iShares Barclays 20+ Year Treasury Bond ETF |
| GCC | WisdomTree Continuous Commodity Index Fund |
| VOOG | Vanguard S&P 500 Growth ETF |
| VOOV | Vanguard S&P 500 Value ETF |
| EEM | iShares MSCI Emerging Markets ETF |
| XLG | Invesco S&P 500 Top 50 ETF |
| Symbol | Company | Sector | Current Price | Action Price | Target | Stop | Notes |
|---|---|---|---|---|---|---|---|
| BPOP | Popular, Inc. | Banks | $144.07 | hi 130s - low 150s | 200 | 120 | 5 for 5'er, 18 of 174 in favored BANK sector matrix, LT pos peer & mkt RS, triple top, good R-R, 2% yield |
| HAS | Hasbro, Inc. | Leisure | $95.25 | lo-hi 90s | 122 | 79 | 5 TA rating, top 33% of LEIS sector matrix, LT pos trend, pos wkly mom, Earn. 5/20 |
| GRMN | Garmin Ltd. | Leisure | $225.75 | mid 230s - mid 260s | 364 | 196 | 5 TA rating, LT pos trend and mkt RS buy, top 33% of LEIS sector matrix, buy-on-pullback |
| SBUX | Starbucks Corporation | Restaurants | $106.81 | hi 90s - mid 100s | 1296 | 85 | 4 for 5'er, top 20% of REST sector matrix, mkt RS reversal to Xs, triple top, 2.35% yield |
| OSW | OneSpaWorld Holdings Ltd. | Leisure | $23.53 | 22 - 24 | 30.50 | 19 | 5 for 5'er, top half of LEIS sector matrix, LT pos peer & mkt RS, spread quintuple top |
| IMO | Imperial Oil Limited | Oil | $134.73 | mid 120s to mid 130s | 164 | 112 | 5 for 5'er; top quartile of Oil matrix; long term mkt and peer RS; Pos. Trend since May '25. |
| SKT | Tanger Inc. | Real Estate | $35.27 | mid-to-hi 30s | 48 | 31 | 5 for 5'er, top 25% of REAL sector matrix, LT pos peer & mkt RS, R-R~2.0, 3.2% yield |
| IBOC | International Bancshares Corporation | Banks | $70.83 | low-to-mid 70s | 93 | 63 | 4 for 5'er, favored BANK sector, LT pos peer & mkt RS, bearish signal reversal, R-R~2.0, 1.95% yield |
| MSGE | Madison Square Garden Entertainment Corp. | Leisure | $68.33 | 63 to 69 | 98 | 53 | 5 for 5'er since Nov. 2025; Top Decile of Leisure Matrix; Pos. Trend since May 2025; ATH 5/7. |
| TDS | Telephone & Data Systems Inc | Telephone | $40.50 | low 40s | 70 | 35 | 4 for 5'er, favored TELE sector, LT pos peer & mkt RS, buy on pullback, R-R~4.0 |
| LYV | Live Nation Entertainment Inc. | Leisure | $168.87 | low 160s to mid 170s | 202 | 142 | 4 for 5'er; Pos. Trend; Top Half of Leisure Matrix; Within one box of ATH. |
| MO | Altria Group Inc. | Food Beverages/Soap | $73.09 | low-to-mid 70s | 91 | 62 | 4 for 5'er, top quartile of FOOD sector matrix, one box from RS buy, bullish triangle, 5.9% yield |
| CVSA | Covista Inc. | Business Products | $122.93 | 110s - mid 120s | 186 | 104 | 4 for 5'er, top 25% of BUSI sector matrix, shakeout to triple top, buy on pullback, R-R>3.0 |
| Symbol | Company | Sector | Current Price | Action Price | Target | Stop | Notes |
|---|---|---|---|---|---|---|---|
| ADBE | Adobe Systems Incorporated | Software | $247.60 | 240s - 250s | 168 | 288 | 0 for 5'er, bottom third of SOFT sector, LT neg mkt & peer RS, sell on rally, R-R>2.0, Earn. 6/11 |
| Comment | |||||||
|---|---|---|---|---|---|---|---|
|
|
|||||||
CVSA Covista Inc. R ($127.65) - Business Products - CVSA is a 4 for 5'er that ranks in the top quartile of the business products sector matrix. On its default chart, the stock completed a shakeout pattern earlier this month when it broke a triple top at $120. CVSA reached $132, but has subsequently pulled back to previous resistance, offering an entry point for long exposure. Positions may be added in the $110s to mid $120s and we will set our initial stop at $104. We will use the bullish price objective, $186, as our target price, giving us a reward-to-risk ratio north of 3.0.
| 26 | |||||||||||||||||||||||||||||
| 156.00 | X | • | 156.00 | ||||||||||||||||||||||||||
| 154.00 | X | X | O | • | 154.00 | ||||||||||||||||||||||||
| 152.00 | X | O | X | X | O | • | 152.00 | ||||||||||||||||||||||
| 150.00 | X | O | X | O | X | O | • | 150.00 | |||||||||||||||||||||
| 148.00 | X | A | X | O | X | O | • | 148.00 | |||||||||||||||||||||
| 146.00 | X | O | X | O | O | • | 146.00 | ||||||||||||||||||||||
| 144.00 | X | O | X | O | • | 144.00 | |||||||||||||||||||||||
| 142.00 | X | O | O | • | 142.00 | ||||||||||||||||||||||||
| 140.00 | X | O | • | Top | 140.00 | ||||||||||||||||||||||||
| 138.00 | X | O | • | 138.00 | |||||||||||||||||||||||||
| 136.00 | X | O | • | 136.00 | |||||||||||||||||||||||||
| 134.00 | X | O | • | 134.00 | |||||||||||||||||||||||||
| 132.00 | O | • | X | 132.00 | |||||||||||||||||||||||||
| 130.00 | • | O | • | X | O | 130.00 | |||||||||||||||||||||||
| 128.00 | • | O | • | X | O | 128.00 | |||||||||||||||||||||||
| 126.00 | • | O | • | X | O | 126.00 | |||||||||||||||||||||||
| 124.00 | • | O | X | • | X | O | 124.00 | ||||||||||||||||||||||
| 122.00 | • | O | X | O | • | X | 122.00 | ||||||||||||||||||||||
| 120.00 | O | X | O | • | X | 120.00 | |||||||||||||||||||||||
| 118.00 | O | X | O | 4 | X | 5 | 118.00 | ||||||||||||||||||||||
| 116.00 | O | X | O | X | O | X | O | X | 116.00 | ||||||||||||||||||||
| 114.00 | O | X | O | X | O | X | O | X | Mid | 114.00 | |||||||||||||||||||
| 112.00 | O | X | O | X | O | X | O | X | 112.00 | ||||||||||||||||||||
| 110.00 | O | X | O | X | O | O | X | 110.00 | |||||||||||||||||||||
| 108.00 | O | X | O | X | O | X | 108.00 | ||||||||||||||||||||||
| 106.00 | O | 1 | O | X | O | 106.00 | |||||||||||||||||||||||
| 104.00 | O | X | O | X | X | 104.00 | |||||||||||||||||||||||
| 102.00 | O | X | 2 | X | O | X | 102.00 | ||||||||||||||||||||||
| 100.00 | O | X | X | O | X | O | X | 3 | • | 100.00 | |||||||||||||||||||
| 99.00 | O | X | O | X | O | X | O | X | X | O | X | • | 99.00 | ||||||||||||||||
| 98.00 | O | X | O | X | X | O | O | X | O | X | O | X | • | 98.00 | |||||||||||||||
| 97.00 | O | X | O | X | O | X | O | X | O | X | O | • | 97.00 | ||||||||||||||||
| 96.00 | O | X | O | X | O | X | X | O | X | O | X | • | 96.00 | ||||||||||||||||
| 95.00 | O | X | O | X | O | X | O | X | O | X | O | • | 95.00 | ||||||||||||||||
| 94.00 | B | X | O | O | C | O | X | O | X | • | 94.00 | ||||||||||||||||||
| 93.00 | O | X | O | X | O | O | X | • | 93.00 | ||||||||||||||||||||
| 92.00 | O | O | X | O | X | • | 92.00 | ||||||||||||||||||||||
| 91.00 | O | X | O | • | 91.00 | ||||||||||||||||||||||||
| 90.00 | O | X | • | 90.00 | |||||||||||||||||||||||||
| 89.00 | O | X | Bot | 89.00 | |||||||||||||||||||||||||
| 88.00 | O | X | 88.00 | ||||||||||||||||||||||||||
| 87.00 | O | 87.00 | |||||||||||||||||||||||||||
| 26 |

| CVX Chevron Corporation ($196.13) - Oil - CVX returned to a buy signal Monday when it broke a double top at $196, where it now sits against resistance. Monday's break adds to a modestly positive technical picture as CVX Is a 3 for 5'er. From here, the first level of support on CVX's chart sits at $180. |
| GOOGL Alphabet Inc. Class A ($396.94) - Internet - GOOGL remains a strong option for focused exposure... but we are still a bit overbought. Pullbacks to support at $384 wouldn't be out of the question in the short-term. The long-term picture is still quite bullish. |
The option suggestions featured here are pulled from the NDW Options Ideas tool. These are just a sample of the ideas that can be found there. The Options Idea tool contains numerous additional income and speculative plays. It also offers relative strength-based screens targeting the highest (and lowest) relative strength stocks and ETFs that have recently moved counter to their longer-term trend. To access or subscribe to the Options Ideas tool click here.
Call
Altria Group Inc July 17 $72.50 Call

Additional Data:
| Bid/Ask Spread | 92.86% |
| Delta | 44.84 |
| Gamma | 2.7 |
| Implied Volatility | 22.31% |
| Expiry Days | 60 |
| Earnings Date | 7/30/2026 |
Put
Roblox Corp (RBLX) July 17 $50 Put

Additional Data:
| Bid/Ask Spread | 3.91% |
| Delta | -53.32 |
| Gamma | 3.22 |
| Implied Volatility | 65.38% |
| Expiry Days | 60 |
| Earnings Date | 7/30/2026 |
Income (Covered Call)
Exxon Mobil (XOM) July 17 $175 Call

Additional Data:
| Ann. Static Return | 13.28% |
| Bid/Ask Spread | 9.68% |
| Delta | 72.24 |
| Gamma | -1.66 |
| Implied Volatility | 31.26% |
| Expiry Days | 60 |
| Earnings Date | 7/31/2026 |
Daily Equity & Market Analysis
Loading, Please Wait...
