Most Requested Symbols

Fixed income sits at a crossroads, facing duel technical and fundamental forces that could push it higher or lower. Which outcome appears most likely, and how should investors navigate the group?
We take a look at some common behavioral biases, how they can affect the advisor-client relationship, and some strategies for overcoming them.
Weekly Rundown Video – May 13, 2026
Weekly rundown with NDW analyst team covering all major asset classes.
Weekly rundown with NDW analyst team covering all major asset classes.
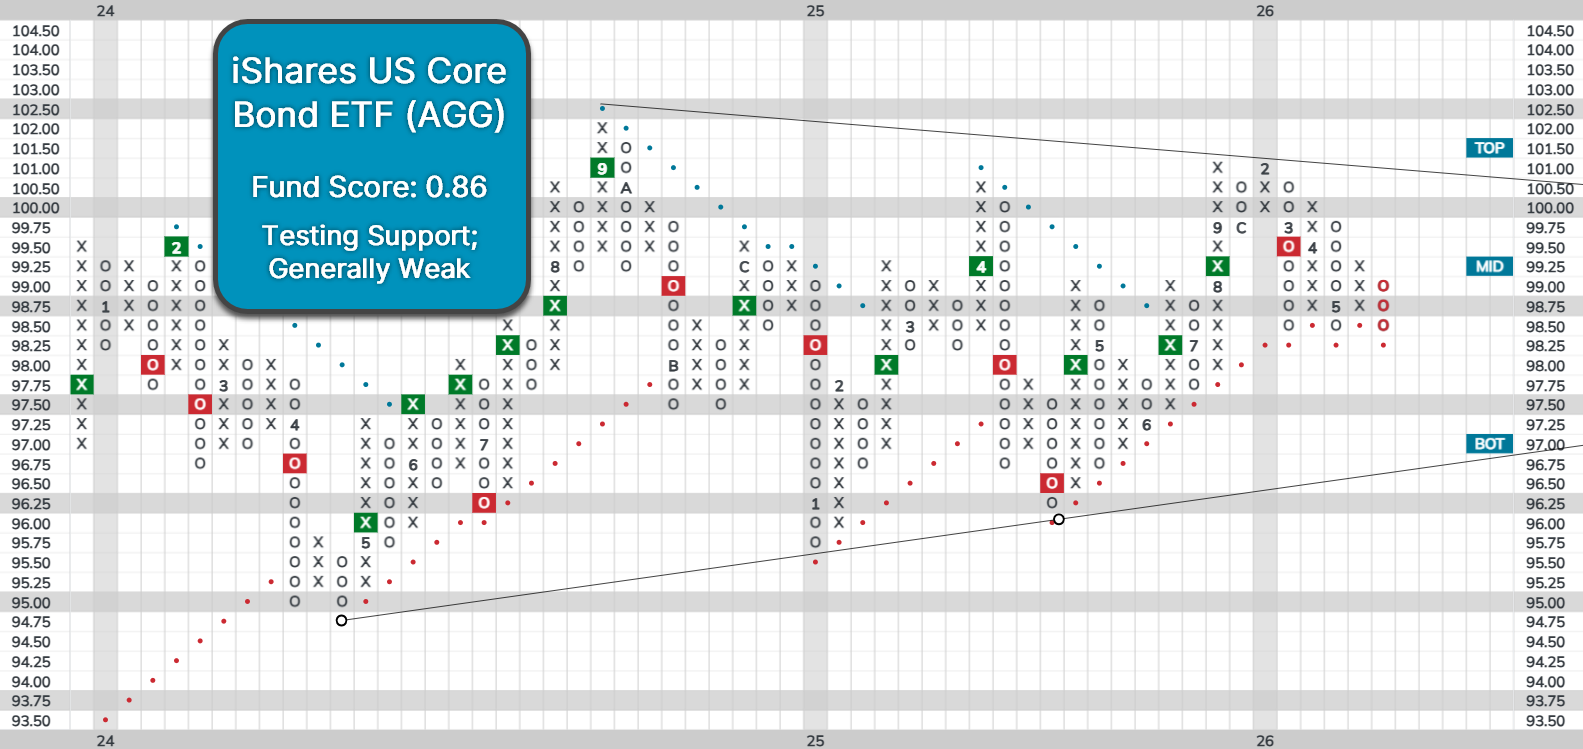
Fixed income sits at a crossroads. The asset class has gone virtually nowhere over the past five years, with the iShares US Core Bond ETF (AGG) up a mere 70 basis points, even when including its yield. The past two years have been even more uneventful, as AGG has traded within a narrow range of $95 to $102, with that range gradually tightening. Regardless of which way bonds end up moving, AGG reversing to new heights or breaking through support would be a significant development, with it likely to continue trending in that direction. Given this uncertainty and its importance, which outcome appears most likely, and how should investors navigate the group?
The Bull Case
On one hand, interest rates could fall over the next year if Fed Chairman Warsh pushes the organization towards a less restrictive policy or advocates for further rate cuts. Meanwhile, AGG sits right above significant support at $98.50, so it’s possible bonds reverse higher from current levels and finally break out to the upside. Given the significance of overhead resistance, any movement above $ $102.50 would be a notably bullish development for the asset class. Even on a total return basis, AGG has yet to recover from its 2020 peak, but a move back to those highs could mark the start of a new era for bonds.
The Bear Case
On the other hand, inflation remains persistent, with recent readings adding to pessimism. CPI rose 3.8% from April 2025, marking its highest reading in nearly three years. Even excluding food and energy, PCE inflation—the Fed’s preferred measure—sat well above the 2% target at 3.2% in March, underscoring that inflationary pressures extend beyond energy prices. The expected Fed Funds rate for the end 2026 has shifted higher by the equivalent of three full cuts, rising from 2.94% in November 2025 to 3.73% today.
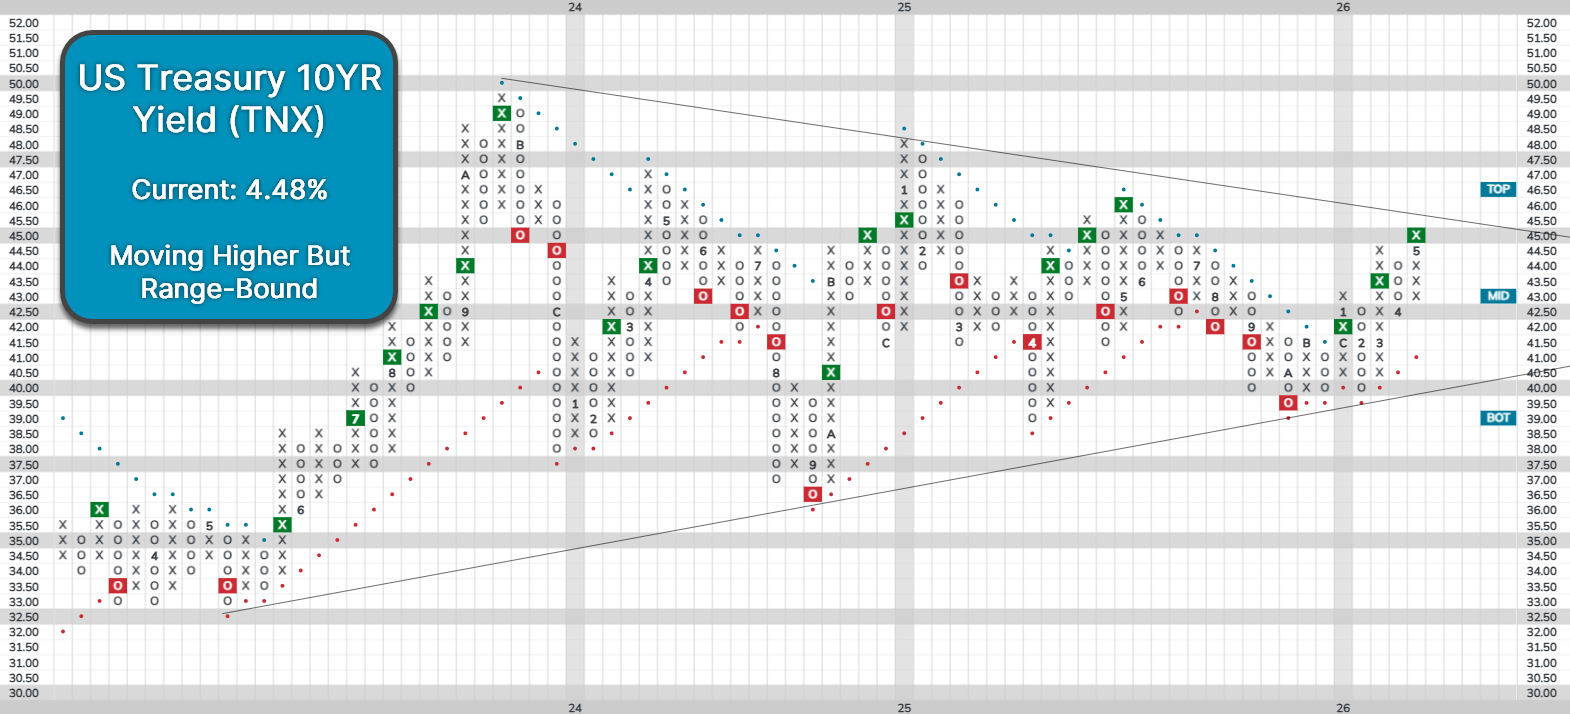
These factors have also led to notable technical changes. AGG moved back to a sell signal in March, and any further downside would return it to a negative trend for the first time in a year. Additionally, the 10-year Treasury yield (TNX) is back near 4.5% after registering its third consecutive buy signal, with “run-it-hot” policies from the administration contributing to upward pressure on long-term rates. For now, rates are likely to continue moving within their current range in the near term. However, rates will eventually break out of this range, and when they do, both technical and fundamental evidence suggest it is more likely to be a reflection of a higher-for-longer environment than declining rates.
Given the overall weakness in fixed income, with it ranking last in DALI, it makes sense to target select areas within the asset class, if investors choose to own it at all. Looking at the Asset Class Group Scores page, investors can see which subgroups remain attractive. Investors seeking more risk-on exposure could target convertibles or international bonds, as these are the only fixed income segments with average scores near or above 3. While high-yield bonds also rank well, credit spreads are near historic lows, suggesting limited upside remains. More risk-averse investors could consider inflation-protected or floating-rate securities, as they rank ahead of the broader fixed income space. Lastly, long-duration bonds may warrant an underweight given their lack of relative strength and greater downside risk if rates rise further.


At Nasdaq Dorsey Wright we are big proponents of rules-based investing and every strategy and model on the platform is underpinned by a quantitative rules-based system. Matrix models buy a stock when its rank is above X and sell it if drops below Y. Relative strength (RS) switching models buy stocks or funds that are in a column of Xs against the benchmark and sell them if they reverse into Os. The model doesn’t question the merits of a position that’s being added or sold, it simply follows the rules and makes the prescribed trade. While every trade a model makes won’t be winner, we’ve found that, over time, if we take a hands-off approach and let the process work, the magnitude of the gains from winning trades far exceed the losses.
Most people consider themselves to be rational but there is a lot of evidence to suggest that we routinely make irrational decisions. Our inclination towards systematic investing isn’t born out of a general love for rules. It stems from the fact that in investing, emotions can be a major hindrance even to seasoned professionals.
As Richard Thaler, one of the founding fathers of behavioral finance and 2017 winner of the Nobel Prize for Economics put it:
“Conventional economics assumes that people are highly rational – super-rational – and unemotional. They can calculate like a computer and have no self-control problems.”

But, because of cognitive and emotional biases, people behave irrationally quite often. At a macro level, this irrationality can impact things like global inflation. On a micro level, it affects our individual investment decisions.
One of the most important facets of the advisor’s role is to help clients maintain perspective and stick to the plan you both have developed together. As a result, the effects cognitive and emotional biases have on individual investor behavior have important implications for the advisor-client relationship. Understanding these pitfalls and their effects can help you understand your clients’ impulses and help you keep them on course, ultimately making you a more effective advisor.
Even if you didn’t realize it at the time, you’ve almost certainly encountered clients exhibiting cognitive or emotional biases. Perhaps you’ve had a client who refuses to believe that the Ford (F) stock they purchased 20 years ago is no longer a good investment because they love their Mustang. Or maybe it’s a client who refuses to sell any of their employer’s stock because they believe they have some control over the stock’s performance. A few of the emotional and cognitive biases you may encounter (or may have already encountered) are outlined below.
Emotional Biases:
Loss-aversion bias – put simply, loss-aversion bias is a preference for avoiding losses over making gains. Loss-aversion can cause clients to hold on to losers for too long and to sell winners too quickly.
Regret-aversion bias – clients exhibiting regret-aversion bias are apt to avoid making decisions out of fear that their decisions will turn out badly. Regret-aversion can lead to herding behavior – clients may gravitate to investments that are popular because they feel safer among the crowd. If everyone is wrong about a stock, they will feel less personally responsible for making a bad decision.
Endowment bias – a phenomenon Richard Thaler has studied extensively; endowment bias occurs when a client places a higher value on assets they own (i.e. the price they require to sell a stock they own is higher than the price they would be willing to pay for the same stock). Endowment bias may make clients reluctant to sell certain assets and also result in suboptimal asset allocation.

Cognitive Biases:
Mental accounting bias – another bias studied by Thaler. A client exhibits mental accounting bias by mentally assigning money to different categories or “buckets” and treating it differently based upon that assignment. Mental accounting bias can also result in a suboptimal asset allocation.
Confirmation bias – this bias occurs when clients seek out and give credence to information that confirms their existing beliefs. Confirmation bias may cause clients to consider only the positive information about an investment and ignore new information that would contradict their investment thesis. Confirmation bias can result in clients not considering all available, relevant information about their investments.
Hindsight bias – a client showing hindsight bias will often see past events as having been predictable. Hindsight bias may lead clients to overestimate the extent to which they predicted investment results causing them to become overconfident.
Educating your clients is an important aspect of overcoming their biases. For example, you might overcome a client’s mental accounting bias by discussing the fungibility of money and showing them how mentally dividing their assets into separate accounts or “buckets” is preventing them from achieving an optimal asset allocation. Education is typically more successful in overcoming cognitive biases than emotional biases.

Removing emotion from the equation is one of the major strengths of rules-based investment strategies and is another tool that you may find effective in keeping your clients on the right path. DWA offers many such strategies that you can tailor to meet the individual needs of your clients.
Think about an investor who suffers from loss-aversion bias – always holding on to their losers for too long and selling their winners too soon. They could benefit from a matrix model that holds onto any position that is maintaining strength and quickly and systematically culls positions exhibiting weakness. A relative strength/rules-based approach could also benefit an investor with regret-aversion and who only wants to own “popular” stocks. In fact, there are few emotional or cognitive biases that couldn’t be mitigated or remedied by adopting (and adhering to) a rules-based system.
Average Level
35.22
| < - -100 | -100 - -80 | -80 - -60 | -60 - -40 | -40 - -20 | -20 - 0 | 0 - 20 | 20 - 40 | 40 - 60 | 60 - 80 | 80 - 100 | 100 - > |
|---|---|---|---|---|---|---|---|---|---|---|---|
|
Buy signalIJH
|
Buy signalXLG
|
||||||||||
|
Sell signalUSO
|
Sell signaldia
|
Buy signalVOOG
|
|||||||||
|
Sell signaltlt
|
Sell signallqd
|
Buy signaldvy
|
Buy signalrsp
|
Buy signalicf
|
Buy signalONEQ
|
||||||
|
Sell signalief
|
Sell signaldx/y
|
Buy signalhyg
|
Buy signalefa
|
Buy signalijr
|
Buy signaliwm
|
Buy signalGCC
|
|||||
|
Buy signalshy
|
Sell signalagg
|
Sell signalgld
|
Buy signalfxe
|
Buy signalGSG
|
Buy signalVOOV
|
Buy signalEEM
|
Buy signalSPY
|
Buy signalQQQ
|
|||
| < - -100 | -100 - -80 | -80 - -60 | -60 - -40 | -40 - -20 | -20 - 0 | 0 - 20 | 20 - 40 | 40 - 60 | 60 - 80 | 80 - 100 | 100 - > |
| AGG | iShares US Core Bond ETF |
| USO | United States Oil Fund |
| DIA | SPDR Dow Jones Industrial Average ETF |
| DVY | iShares Dow Jones Select Dividend Index ETF |
| DX/Y | NYCE U.S.Dollar Index Spot |
| EFA | iShares MSCI EAFE ETF |
| FXE | Invesco CurrencyShares Euro Trust |
| GLD | SPDR Gold Trust |
| GSG | iShares S&P GSCI Commodity-Indexed Trust |
| HYG | iShares iBoxx $ High Yield Corporate Bond ETF |
| ICF | iShares Cohen & Steers Realty ETF |
| IEF | iShares Barclays 7-10 Yr. Tres. Bond ETF |
| LQD | iShares iBoxx $ Investment Grade Corp. Bond ETF |
| IJH | iShares S&P 400 MidCap Index Fund |
| ONEQ | Fidelity Nasdaq Composite Index Track |
| QQQ | Invesco QQQ Trust |
| RSP | Invesco S&P 500 Equal Weight ETF |
| IWM | iShares Russell 2000 Index ETF |
| SHY | iShares Barclays 1-3 Year Tres. Bond ETF |
| IJR | iShares S&P 600 SmallCap Index Fund |
| SPY | SPDR S&P 500 Index ETF Trust |
| TLT | iShares Barclays 20+ Year Treasury Bond ETF |
| GCC | WisdomTree Continuous Commodity Index Fund |
| VOOG | Vanguard S&P 500 Growth ETF |
| VOOV | Vanguard S&P 500 Value ETF |
| EEM | iShares MSCI Emerging Markets ETF |
| XLG | Invesco S&P 500 Top 50 ETF |

| Symbol | Company | Sector | Current Price | Action Price | Target | Stop | Notes |
|---|---|---|---|---|---|---|---|
| COST | Costco Wholesale Corporation | Retailing | $1033.08 | 944-1050s | 1296 | 832 | 4 TA rating, top 33% of retail sector matrix, LT mkt RS buy, LT pos trend, consec buy signals, Earn. 5/28 |
| BPOP | Popular, Inc. | Banks | $143.05 | hi 130s - low 150s | 200 | 120 | 5 for 5'er, 18 of 174 in favored BANK sector matrix, LT pos peer & mkt RS, triple top, good R-R, 2% yield |
| HAS | Hasbro, Inc. | Leisure | $94.01 | lo-hi 90s | 122 | 79 | 5 TA rating, top 33% of LEIS sector matrix, LT pos trend, pos wkly mom, Earn. 5/20 |
| GRMN | Garmin Ltd. | Leisure | $232.02 | mid 230s - mid 260s | 364 | 196 | 5 TA rating, LT pos trend and mkt RS buy, top 33% of LEIS sector matrix, buy-on-pullback |
| SBUX | Starbucks Corporation | Restaurants | $105.95 | hi 90s - mid 100s | 1296 | 85 | 4 for 5'er, top 20% of REST sector matrix, mkt RS reversal to Xs, triple top, 2.35% yield |
| OSW | OneSpaWorld Holdings Ltd. | Leisure | $23.29 | 22 - 24 | 30.50 | 19 | 5 for 5'er, top half of LEIS sector matrix, LT pos peer & mkt RS, spread quintuple top |
| IMO | Imperial Oil Limited | Oil | $131.67 | mid 120s to mid 130s | 164 | 112 | 5 for 5'er; top quartile of Oil matrix; long term mkt and peer RS; Pos. Trend since May '25. |
| SKT | Tanger Inc. | Real Estate | $35.41 | mid-to-hi 30s | 48 | 31 | 5 for 5'er, top 25% of REAL sector matrix, LT pos peer & mkt RS, R-R~2.0, 3.2% yield |
| IBOC | International Bancshares Corporation | Banks | $71.27 | low-to-mid 70s | 93 | 63 | 4 for 5'er, favored BANK sector, LT pos peer & mkt RS, bearish signal reversal, R-R~2.0, 1.95% yield |
| MSGE | Madison Square Garden Entertainment Corp. | Leisure | $66.22 | 63 to 69 | 98 | 53 | 5 for 5'er since Nov. 2025; Top Decile of Leisure Matrix; Pos. Trend since May 2025; ATH 5/7. |
| TDS | Telephone & Data Systems Inc | Telephone | $42.23 | low 40s | 70 | 35 | 4 for 5'er, favored TELE sector, LT pos peer & mkt RS, buy on pullback, R-R~4.0 |
| LYV | Live Nation Entertainment Inc. | Leisure | $168.46 | low 160s to mid 170s | 202 | 142 | 4 for 5'er; Pos. Trend; Top Half of Leisure Matrix; Within one box of ATH. |
| Symbol | Company | Sector | Current Price | Action Price | Target | Stop | Notes |
|---|---|---|---|---|---|---|---|
| ADBE | Adobe Systems Incorporated | Software | $236.07 | 240s - 250s | 168 | 288 | 0 for 5'er, bottom third of SOFT sector, LT neg mkt & peer RS, sell on rally, R-R>2.0, Earn. 6/11 |
| Comment | |||||||
|---|---|---|---|---|---|---|---|
|
|
|||||||
LYV Live Nation Entertainment Inc. R ($171.35) - Leisure - LYV has been a 4 for 5’er since seeing its trend shift back to positive in early April 2026. LYV has shown superior near- and long-term RS versus its peer group since March and ranks within the top half of the Leisure sector matrix. The stock has maintained positive long-term RS versus the market since August 2025, and recent action has brought the market RS chart near to a reversal back into Xs. On the trend chart, LYV returned to a buy signal to kick off May’s trading, while this week’s action led to a second buy signal and a clearing of notable resistance in the upper $160s that dates back to September 2025. Intraday action Thursday (5/14) brought LYV above $172 and within one box of its all-time chart high at $174. Okay to consider LYV here on the breakout or on a pullback to the lower $160s. We will utilize the bullish price objective of $202 as our price target and set the initial stop for $142.
| 26 | |||||||||||||||||||||||||||||
| 170.00 | X | 170.00 | |||||||||||||||||||||||||||
| 168.00 | X | • | X | X | X | 168.00 | |||||||||||||||||||||||
| 166.00 | X | O | X | • | X | O | X | O | X | 166.00 | |||||||||||||||||||
| 164.00 | X | O | X | X | O | • | X | O | X | O | X | 164.00 | |||||||||||||||||
| 162.00 | X | O | X | O | X | X | O | • | X | O | X | O | X | 162.00 | |||||||||||||||
| 160.00 | X | O | X | O | X | O | X | O | X | • | X | O | X | 5 | O | 160.00 | |||||||||||||
| 158.00 | • | X | O | X | 3 | X | O | X | O | X | O | • | X | O | X | O | X | X | 158.00 | ||||||||||
| 156.00 | • | X | O | O | O | O | X | O | X | 4 | O | X | O | X | O | X | • | Mid | 156.00 | ||||||||||
| 154.00 | • | X | O | • | O | X | O | X | O | O | X | O | X | • | 154.00 | ||||||||||||||
| 152.00 | • | X | • | O | X | O | X | O | • | O | • | 152.00 | |||||||||||||||||
| 150.00 | • | X | • | O | O | X | • | • | 150.00 | ||||||||||||||||||||
| 148.00 | 1 | X | X | • | O | X | • | 148.00 | |||||||||||||||||||||
| 146.00 | X | O | X | O | X | • | O | X | • | 146.00 | |||||||||||||||||||
| 144.00 | X | O | X | O | X | • | O | • | 144.00 | ||||||||||||||||||||
| 142.00 | O | X | O | X | 2 | X | • | • | 142.00 | ||||||||||||||||||||
| 140.00 | O | X | O | X | O | X | • | 140.00 | |||||||||||||||||||||
| 138.00 | O | X | O | O | • | 138.00 | |||||||||||||||||||||||
| 136.00 | O | • | 136.00 | ||||||||||||||||||||||||||
| 26 |
| HWKN Hawkins Chemical Inc ($156.57) - Chemicals - HWKN fell to a sell signal Thursday when it broke a quadruple bottom at $160 and continued lower to $152, where it now sits against its bullish support line. The outlook for the stock remains positive, however, as HWKN is a 5 for 5'er that ranks in the top half of the chemicals sector matrix. Beyond the bullish support line, additional support can be found at $146. Meanwhile, overhead resistance sits at $172. |
| MS Morgan Stanley ($195.46) - Wall Street - MS shares moved higher today to break a triple top at $196 to mark their third consecutive buy signal and reach a new all-time high. This 5 for 5'er has been in a positive trend since March and on an RS buy signal versus the market since June 2013. MS shares are trading near heavily overbought territory with a weekly overbought/oversold reading of 68%. From here, support is offered at $188 and $186. |
| PFGC Performance Food Group Co Formerly ($98.05) - Food Beverages/Soap - PFGC completed a double top break at $97, marking its second consecutive buy signal. The 3 for 5'er moved up from a 2 last month after reversing back into positive trend. Additionally, the stock sits in the top half of the food beverages/soap sector matrix. PFGC is still rated a hold, so continue waiting for further technical improvement before considering. Initial support is at $91, with additional strong support at $87. |

| Name | Option Symbol | Action | Stop Loss |
|---|---|---|---|
| Kinross Gold Corporation - $31.06 | KGC2621H32 | Buy the August 32.00 calls at 2.98 | 26.00 |
| Name | Option | Action |
|---|---|---|
| Fortinet Inc. ( FTNT) | Jul. 85.00 Calls | Raise the option stop loss to 32.00 (CP: 34.95) |
| Name | Option Symbol | Action | Stop Loss |
|---|---|---|---|
| Cleveland-Cliffs Inc. - $10.96 | CLF2621T11 | Buy the August 11.00 puts at 1.56 | 11.00 |
| Name | Option | Action |
|---|---|---|
|
|
||
| Name | Option Sym. | Call to Sell | Call Price | Investment for 500 Shares | Annual Called Rtn. | Annual Static Rtn. | Downside Protection |
|---|---|---|---|---|---|---|---|
| Oracle Corporation $ 189.76 | ORCL2621H200 | Aug. 200.00 | 23.70 | $ 87,773.70 | 47.22% | 45.14% | 10.91% |
| Name | Action |
|---|---|
| Delta Air Lines Inc. ( DAL) - 71.05 | Sell the July 72.50 Calls. |
| Starbucks Corporation ( SBUX) - 105.95 | Sell the September 110.00 Calls. |
| Amkor Technology, Inc. ( AMKR) - 74.61 | Sell the July 80.00 Calls. |
| On Semiconductor Corp. ( ON) - 115.71 | Sell the July 105.00 Calls. |
| Block Inc ( XYZ) - 69.78 | Sell the July 75.00 Calls. |
| ATI Inc. ( ATI) - 164.83 | Sell the July 165.00 Calls. |
| Name | Covered Write |
|---|---|
| eBay Inc. ( EBAY - 113.01 ) | July 110.00 covered write. |
Daily Equity & Market Analysis
Loading, Please Wait...
