Most Requested Symbols

Individual stock volatility reaches historic highs relative to index volatility.
Today we continue our three part series breaking down three common arguments against trend following. Today's topic- the idea that momentum frequent trading creates material tax inefficiencies within your account.
NDW Morning Update Video – May 14, 2026
NDW Morning Update Video – May 14, 2026
Back in mid-February, we wrote about the concept of a “Rip Tide Market” to describe the high level of single stock implied volatility relative to that of the CBOE SPX Volatility Index (VIX) (read more here). We eventually saw SPX implied volatility catch up to what was going on at an individual stock level. The spread between individual stock implied volatility and index implied volatility eventually fell to washed out levels a few days before the bottom was established on the last trading day of the quarter. The recent rally in SPX has sent the VIX back to normalized levels below 20, however, single stock implied volatility is still very high on a relative basis. The current setup has led to the most intense Rip Tide Market in our data set with the spread between average SPX constituent implied volatility and VIX reaching the highest levels over the last two weeks. This doesn’t mean that the market must fall or experience a spike in volatility, but the conditions are ripe for a spike in index volatility.

Outside of raising cash, trimming heavily overbought or outsized positions, or moving away from high RS names to more defensive positions, there are ways to play a Rip Tide Market with options. Since SPX implied volatility is “cheap” relative to single stock implied volatility, buying index ETF puts would be one way to add portfolio protection. For the exact details on how to do that, you can read the article linked here. The second path that’s available to many advisors would be to sell calls on existing stock positions, especially those that are extended to the upside, since single stock implied volatility is quite high. Many stocks within the Mag Seven and semiconductor names like Micron (MU) that have had a large rally, lack nearby support, and high implied volatility would be ideal candidates if they are already within client portfolios. One could also combine these strategies into one trade by using the calls sold on individual stock positions to fund portfolio insurance via index ETF puts. This would also be a more fine-tuned trade on the spread between index and stock implied volatility contracting. Overall, investors should be at least a little concerned about the hefty level of individual stock volatility following such a strong move in the market.


Note- this is the third edition of a larger study detailing how you can answer several frequently asked questions your clients might have when considering the broader momentum factor. Click here to read part 1 and Here to read part 2, addressing the ideas that momentum investing is “streaky” in comparison to other factors or momentum incorrectly chases winners. We have also included, linked here, a PDF of all three reports together to make it easy to reference going forwards. With any questions/concerns, email miles.clark@nasdaq.com
Like any investment process, trend following is not without its share of ups and downs. Over time, buying winners and cutting losers can foster a strong point‑to‑point return stream, but the inter‑period experience of momentum investing can be difficult to stomach as natural rotation occurs and trends change. Time and time again, shifts in leadership create uncomfortable situations that often run counter to our natural “gut” instincts, causing even the most loyal trend follower to consider deviating from the rules. These untimely breakdowns in systematic rule‑following allow emotion to creep in at precisely the wrong moment, potentially erasing years’ worth of discipline- either psychologically, monetarily, or quite often, both.
With that in mind, we have taken the opportunity to break down several of the major roadblocks and common arguments that inevitably arise for trend followers. Our hope is that by better understanding the typical pitfalls of momentum investing, we can more appropriately contextualize returns over time.
Major arguments commonly raised against the momentum factor typically include:
Turnover and its Effect on Tax Efficiency
While the previous two sections highlight why it is so important for momentum strategies to rotate to new strength, the discussion thus far has omitted one major player: Uncle Sam. In the real world, trading out of one security and into another generally creates a taxable event depending on the performance of the security. As momentum‑focused strategies tend to trade more frequently than many other factors, it is easy to assume that any excess returns generated through favorable asset rotation may quickly be offset by a higher tax bill, particularly when compared to other factors which see less overall rotation. We do know, however, that not all taxes are treated the same- investors generally prefer the lower rates associated with long-term gains (LTG), which occur when an asset has been held for over a year. Meanwhile, investors want to avoid the higher tax rate associated with short-term gains (STG), which occur when we hold profitable positions for under one year. Given the universal preference for minimizing tax liability, this raises an important question: do tactical strategies inherently lead to unfavorable tax outcomes?
To test this theory, we can take a look back at our Large Cap Core model discussed in the previous sections. This time, because holding period directly influences the favorability of tax treatment, we include holding period as an observable data point, pictured below. If momentum strategies generally lead to unfavorable tax outcomes, we would expect to see a clear pattern emerge: a larger share of total gains coming from short‑term gains rather than long‑term gains.Note that you can see trade efficiency scores for any of your models, including custom ones by clicking on the "trade efficiency" tab on the models page.

Observing all 1,455 trades in aggregate via the “cumulative trade efficiency” section of the graph above, some interesting trade tendencies emerge. First, and most importantly, long-term gain generating trades actually occur more frequently than short-term gain trades (28.7% vs. 22.7%, respectively), running counter to what many would typically assume for a tactical strategy. Secondly, short-term losses represent the most common trade outcome, accounting for roughly 44% of total trades in the dataset. At first glance this seems less than ideal- a potential “death by 1,000 cuts” scenario. However, at its core, this is the systematic nature of trend following at work. By consistently cutting small losers short, the magnitude of downside left‑tail events is reduced (a result that aligns with the trade distribution discussed in the "chasing winners" section). In doing so, momentum can unemotionally move on from a losing position in an effort to find a new possible right-tail winner.
While trade frequency provides useful context, the more relevant consideration for long‑run tax efficiency is the magnitude of gains realized within each tax classification. It is for this reason that NDW developed a “tax efficiency score” which calculates the percentage of total gains generated over a given timeframe that would have been tagged at the more favorable LTG tax rate. The score is calculated as the proportion of gains realized at long‑term rates relative to total realized gains (both short‑ and long‑term). To put it simply, a more tax efficient model has a score closer to 100, meaning that most (or all) of captured gains would have been taxed at a lower rate. In this case, our model earns a score of nearly 77%, suggesting that just over three-quarters of realized gains were taxed favorably- a result far more efficient than many might expect from a strategy that continuously rotates into new market leadership.

There is no question that momentum comes with its fair share of roadblocks a prospective investor would need to be cautious of before considering including the factor within their portfolio. That said, many of the risks commonly associated with momentum appear to be overstated, most notably those centered on trading frequency and its perceived impacts on apparent “streakiness” of yearly returns or overall tax efficiency. While it is true that the frequency of security rotation is steeper than other factors, momentum’s systematic approach to security selection sidesteps several other issues present in other factors, particularly those based around human emotions. Overall, the ability for trend followers to largely remove human biases creates a factor-unique return distribution focused on right tail events, while still largely protecting the integrity of the yearly return profile and tax efficiency over time. Taken together, these characteristics suggest that many of momentum’s perceived drawbacks are better understood as features of a disciplined, rules‑based process rather than inherent flaws in the strategy itself.
Each week the analysts at NDW review and comment on all major asset classes in the global markets. Shown below is the summary or snapshot of the primary technical indicators we follow for multiple areas. Should there be changes mid-week we will certainly bring these to your attention via the report.
| Universe | BP Col & Level (actual) | BP Rev Level | PT Col & Level (actual) | PT Rev Level | HiLo Col & Level (actual) | HiLo Rev Level | 10 Week Col & Level (actual) | 10 Week Rev Level | 30 Week Col & Level (actual) | 30 Week Rev Level |
|---|---|---|---|---|---|---|---|---|---|---|
| ALL |
|
40% |
|
42% |
|
76% |
|
50% |
|
44% |
| NYSE |
|
58% |
|
48% |
|
80% |
|
62% |
|
60% |
| OTC |
|
36% |
|
38% |
|
76% |
|
56% |
|
40% |
| World |
|
40% |
|
40% |
|
|
|
50% |
|
42% |

Remember, these are technical comments only. Just as you must be aware of fundamental data for the stocks we recommend based on technical criteria in the report, so too must you be aware of important data regarding delivery, market moving government releases, and other factors that may influence commodity pricing. We try to limit our technical comments to the most actively traded contracts in advance of delivery, but some contracts trade actively right up to delivery while others taper off well in advance. Be sure you check your dates before trading these contracts. For questions regarding this section or additional coverage of commodities email james.west@nasdaq.com.
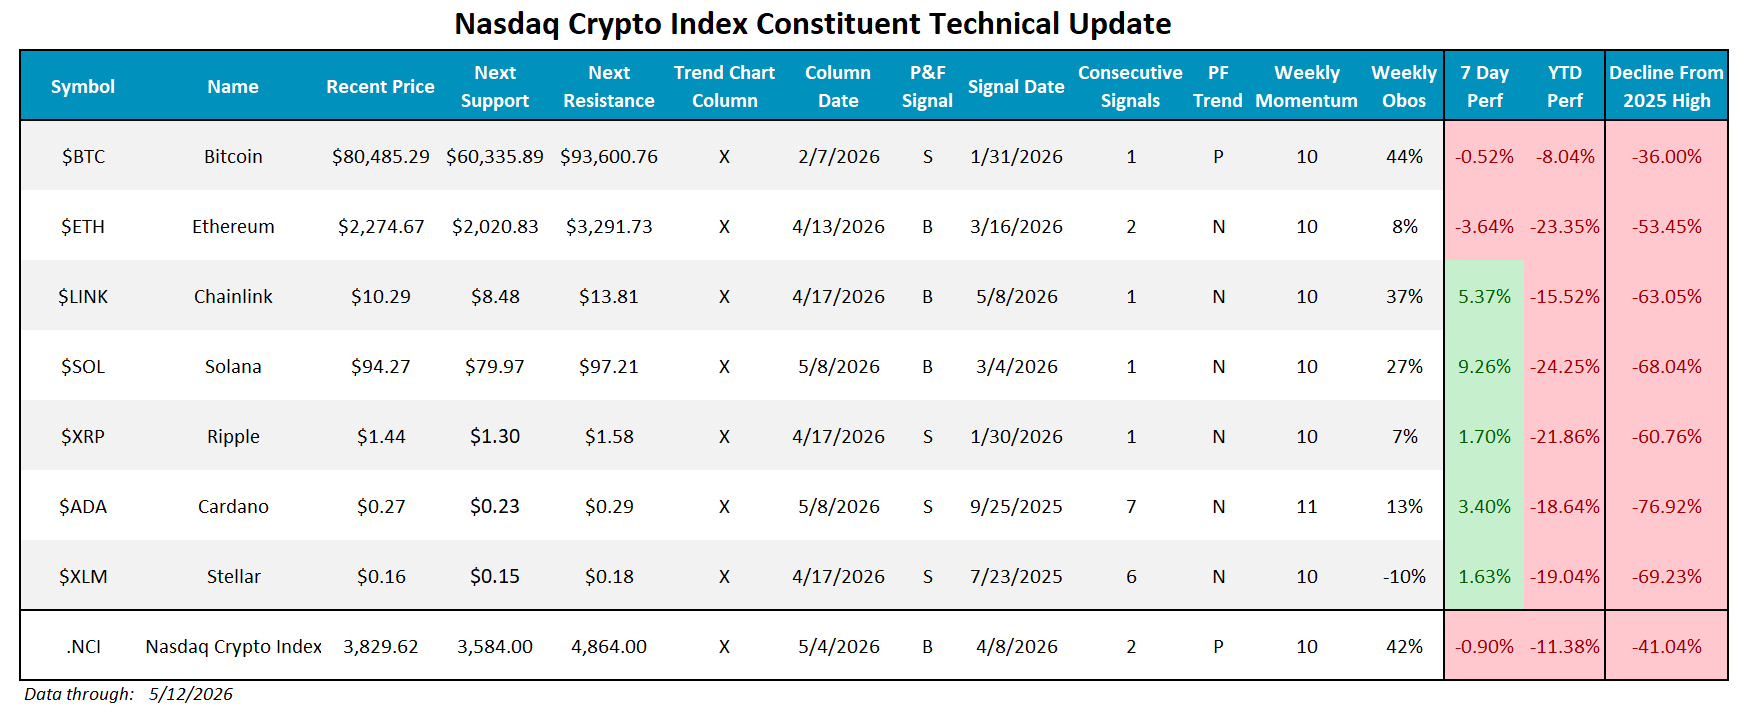
Data represented in the table below is through 5/12/2026:
| Symbol | Name | Price | PnF Trend | RS Signal | RS Col. | 200 Day MA | Weekly Mom |
|---|---|---|---|---|---|---|---|
| CL/ | Crude Oil Continuous | 102.18 | Positive | Sell | X | 70.05 | - 6W |
| DBLCIX | Deutsche Bank Liquid Commodities Index | 468.52 | Positive | Sell | O | 460.74 | - 44W |
| DWACOMMOD | NDW Continuous Commodity Index | 1251.53 | Positive | Buy | X | 1068.11 | + 3W |
| GC/ | Gold Continuous | 4677.60 | Positive | Buy | O | 4300.26 | + 3W |
| HG/ | Copper Continuous | 6.49 | Positive | Sell | X | 5.34 | + 5W |
| ZG/ | Corn (Electronic Day Session) Continuous | 480.00 | Positive | Sell | O | 430.98 | + 2W |
Average Level
34.57
| < - -100 | -100 - -80 | -80 - -60 | -60 - -40 | -40 - -20 | -20 - 0 | 0 - 20 | 20 - 40 | 40 - 60 | 60 - 80 | 80 - 100 | 100 - > |
|---|---|---|---|---|---|---|---|---|---|---|---|
|
Buy signalfxe
|
Buy signalIJH
|
||||||||||
|
Buy signalefa
|
Sell signaldia
|
||||||||||
|
Sell signaltlt
|
Sell signalUSO
|
Buy signalijr
|
Buy signalSPY
|
Buy signalONEQ
|
|||||||
|
Sell signalief
|
Sell signalagg
|
Sell signallqd
|
Buy signalhyg
|
Buy signalrsp
|
Buy signalicf
|
Buy signalEEM
|
Buy signalXLG
|
Buy signalQQQ
|
|||
|
Buy signalshy
|
Sell signaldx/y
|
Sell signalgld
|
Buy signaldvy
|
Buy signalGSG
|
Buy signalVOOV
|
Buy signaliwm
|
Buy signalVOOG
|
Buy signalGCC
|
|||
| < - -100 | -100 - -80 | -80 - -60 | -60 - -40 | -40 - -20 | -20 - 0 | 0 - 20 | 20 - 40 | 40 - 60 | 60 - 80 | 80 - 100 | 100 - > |
| AGG | iShares US Core Bond ETF |
| USO | United States Oil Fund |
| DIA | SPDR Dow Jones Industrial Average ETF |
| DVY | iShares Dow Jones Select Dividend Index ETF |
| DX/Y | NYCE U.S.Dollar Index Spot |
| EFA | iShares MSCI EAFE ETF |
| FXE | Invesco CurrencyShares Euro Trust |
| GLD | SPDR Gold Trust |
| GSG | iShares S&P GSCI Commodity-Indexed Trust |
| HYG | iShares iBoxx $ High Yield Corporate Bond ETF |
| ICF | iShares Cohen & Steers Realty ETF |
| IEF | iShares Barclays 7-10 Yr. Tres. Bond ETF |
| LQD | iShares iBoxx $ Investment Grade Corp. Bond ETF |
| IJH | iShares S&P 400 MidCap Index Fund |
| ONEQ | Fidelity Nasdaq Composite Index Track |
| QQQ | Invesco QQQ Trust |
| RSP | Invesco S&P 500 Equal Weight ETF |
| IWM | iShares Russell 2000 Index ETF |
| SHY | iShares Barclays 1-3 Year Tres. Bond ETF |
| IJR | iShares S&P 600 SmallCap Index Fund |
| SPY | SPDR S&P 500 Index ETF Trust |
| TLT | iShares Barclays 20+ Year Treasury Bond ETF |
| GCC | WisdomTree Continuous Commodity Index Fund |
| VOOG | Vanguard S&P 500 Growth ETF |
| VOOV | Vanguard S&P 500 Value ETF |
| EEM | iShares MSCI Emerging Markets ETF |
| XLG | Invesco S&P 500 Top 50 ETF |

| Symbol | Company | Sector | Current Price | Action Price | Target | Stop | Notes |
|---|---|---|---|---|---|---|---|
| COST | Costco Wholesale Corporation | Retailing | $1021.88 | 944-1050s | 1296 | 832 | 4 TA rating, top 33% of retail sector matrix, LT mkt RS buy, LT pos trend, consec buy signals, Earn. 5/28 |
| BPOP | Popular, Inc. | Banks | $145.57 | hi 130s - low 150s | 200 | 120 | 5 for 5'er, 18 of 174 in favored BANK sector matrix, LT pos peer & mkt RS, triple top, good R-R, 2% yield |
| HAS | Hasbro, Inc. | Leisure | $94.50 | lo-hi 90s | 122 | 79 | 5 TA rating, top 33% of LEIS sector matrix, LT pos trend, pos wkly mom, Earn. 5/20 |
| GRMN | Garmin Ltd. | Leisure | $236.97 | mid 230s - mid 260s | 364 | 196 | 5 TA rating, LT pos trend and mkt RS buy, top 33% of LEIS sector matrix, buy-on-pullback |
| SBUX | Starbucks Corporation | Restaurants | $106.58 | hi 90s - mid 100s | 1296 | 85 | 4 for 5'er, top 20% of REST sector matrix, mkt RS reversal to Xs, triple top, 2.35% yield |
| OSW | OneSpaWorld Holdings Ltd. | Leisure | $23.47 | 22 - 24 | 30.50 | 19 | 5 for 5'er, top half of LEIS sector matrix, LT pos peer & mkt RS, spread quintuple top |
| IMO | Imperial Oil Limited | Oil | $133.42 | mid 120s to mid 130s | 164 | 112 | 5 for 5'er; top quartile of Oil matrix; long term mkt and peer RS; Pos. Trend since May '25. |
| SKT | Tanger Inc. | Real Estate | $36.05 | mid-to-hi 30s | 48 | 31 | 5 for 5'er, top 25% of REAL sector matrix, LT pos peer & mkt RS, R-R~2.0, 3.2% yield |
| IBOC | International Bancshares Corporation | Banks | $72.41 | low-to-mid 70s | 93 | 63 | 4 for 5'er, favored BANK sector, LT pos peer & mkt RS, bearish signal reversal, R-R~2.0, 1.95% yield |
| MSGE | Madison Square Garden Entertainment Corp. | Leisure | $64.56 | 63 to 69 | 98 | 53 | 5 for 5'er since Nov. 2025; Top Decile of Leisure Matrix; Pos. Trend since May 2025; ATH 5/7. |
| TDS | Telephone & Data Systems Inc | Telephone | $42.76 | low 40s | 70 | 35 | 4 for 5'er, favored TELE sector, LT pos peer & mkt RS, buy on pullback, R-R~4.0 |
| Symbol | Company | Sector | Current Price | Action Price | Target | Stop | Notes |
|---|---|---|---|---|---|---|---|
| ADBE | Adobe Systems Incorporated | Software | $240.83 | 240s - 250s | 168 | 288 | 0 for 5'er, bottom third of SOFT sector, LT neg mkt & peer RS, sell on rally, R-R>2.0, Earn. 6/11 |
| Symbol | Company | Sector | Current Price | Action Price | Target | Stop | Notes |
|---|---|---|---|---|---|---|---|
| DRI | Darden Restaurants, Inc. | Restaurants | $199.12 | 190s - low 200s | 226 | 168 | DRI has fallen to a sell signal. OK to hold here. Maintain $168 stop. |
| Comment | |||||||
|---|---|---|---|---|---|---|---|
|
|
|||||||
TDS Telephone & Data Systems Inc R ($42.23) - Telephone - TDS is a 4 for 5'er and member of the favored telephone sector matrix that has been on peer and market RS buy signals since 2023. On its default chart, TDS has given two consecutive buy signals and reached a new multi-year high earlier this month. The stock has subsequently pulled back to below the middle of its trading band and now sits just above prior support, offering an entry point for long exposure. Positions may be added in the low $40s and we will set our initial stop at $35, a potential spread triple bottom break on TDS's default chart. We will use the bullish price objective, $70, as our target price, giving us a reward-to-risk ratio approaching 4.0.
| 25 | 26 | ||||||||||||||||||||||||||||
| 49.00 | X | 49.00 | |||||||||||||||||||||||||||
| 48.00 | X | O | 48.00 | ||||||||||||||||||||||||||
| 47.00 | X | 5 | O | 47.00 | |||||||||||||||||||||||||
| 46.00 | 2 | O | X | O | 46.00 | ||||||||||||||||||||||||
| 45.00 | X | O | X | O | 45.00 | ||||||||||||||||||||||||
| 44.00 | X | O | 4 | O | Mid | 44.00 | |||||||||||||||||||||||
| 43.00 | • | X | 3 | X | O | 43.00 | |||||||||||||||||||||||
| 42.00 | X | • | • | • | 1 | O | X | 42.00 | |||||||||||||||||||||
| 41.00 | X | X | O | X | • | 9 | • | • | C | O | 41.00 | ||||||||||||||||||
| 40.00 | X | O | X | X | O | X | O | X | O | A | • | X | 40.00 | ||||||||||||||||
| 39.00 | X | O | 4 | X | O | X | O | X | O | X | O | X | O | X | • | 39.00 | |||||||||||||
| 38.00 | X | O | X | O | 5 | X | O | X | 8 | X | O | X | O | X | O | X | • | 38.00 | |||||||||||
| 37.00 | 2 | O | X | O | X | O | 7 | O | O | X | O | • | O | • | B | X | • | Bot | 37.00 | ||||||||||
| 36.00 | X | O | X | O | X | O | 6 | X | O | • | • | O | • | 36.00 | |||||||||||||||
| 35.00 | C | X | 3 | X | O | X | O | X | O | X | • | • | 35.00 | ||||||||||||||||
| 34.00 | X | X | O | X | O | X | O | X | O | X | O | X | • | 34.00 | |||||||||||||||
| 33.00 | X | O | X | O | X | O | X | O | O | X | O | • | 33.00 | ||||||||||||||||
| 32.00 | X | O | X | 1 | O | O | • | 32.00 | |||||||||||||||||||||
| 31.00 | X | O | • | 31.00 | |||||||||||||||||||||||||
| 30.00 | X | • | 30.00 | ||||||||||||||||||||||||||
| 29.00 | X | • | 29.00 | ||||||||||||||||||||||||||
| 28.00 | X | • | 28.00 | ||||||||||||||||||||||||||
| 25 | 26 |
| ASML ASML Holding NV ADR ($1,587.19) - Semiconductors - Shares of ASML pushed higher on Wednesday to break a double top at $1,600 for its second consecutive buy signal. Despite the absolute strength of the stock, ASML has lagged its semiconductor peers in recent weeks, losing near- and long-term relative strength versus its peer index. The 3 for 5'er currently sits at the very bottom of the semiconductor matrix and remains a hold until it demonstrates further relative improvement. |
| AVAV Aerovironment, Inc. ($160.39) - Aerospace Airline - Another day, another bad break for AVAV. Those following the technical attribute scoring system have been rewarded during this years decline, as the 0/5'er is off more than 30% so far this year. Let's continue to avoid, taking opportunities to trim as we get bounces back up to the middle of the trading band at $208. |
| CAKE The Cheesecake Factory Incorporated ($56.77) - Restaurants - CAKE broke a double bottom at $58 for a third sell signal as shares fell to $57. The move also violates the bullish support line, dropping the stock down to a 4 for 5'er trading in a negative trend. From here, support lies at $53, the March 2026 chart low, while additional resides in the lower $40s. |
| CENX Century Aluminum Co ($63.11) - Metals Non Ferrous - CENX returned to a buy signal Wednesday when it broke a triple top at $64. Wednesday's move adds to an already positive technical picture as CENX is a 4 for 5'er and ranks in the top third of the non-ferrous metals sector matrix. From here, support can be found at $58 while overhead resistance can be found at $66 and $68. |
| CVNA Carvana Company ($69.77) - Autos and Parts - CVNA broke a double bottom at $73 to complete a bearish catapult pattern as shares fell to $69. The break tests the stock's bullish support line on the trend chart and brings the market RS chart to within one box of reversing into Os, leaving two potential technical attributes at risk. Beyond the bullish support line at $68, additional support lies at $64 and $60. |
| HD Home Depot, Inc. ($302.99) - Building - HD broke a double bottom at $308 for a second sell signal as shares fell to $300, marking the lowest chart level since November 2023. HD has been a 0 for 5'er since March of this year and currently ranks within the bottom quartile of the Building sector matrix. Continue to avoid long exposure. |
| LYV Live Nation Entertainment Inc. ($169.61) - Leisure - LYV broke a spread quintuple top at $170 to clear resistance that dated back to September 2025 and count as a second buy signal. The stock is a 4 for 5'er that ranks within the top half of the Leisure sector matrix. Okay to consider here on the breakout or on a pullback to the lwoer $160s. Initial support lies at $160, while the bullish support line sits at $156. |
| PLTR Palantir Technologies Inc. Class A ($129.03) - Software - Shares of PLTR broke a double bottom at $130 for its third consecutive sell signal. The stock has declined consistently over the last several months, falling to an unacceptable 2 for 5'er in May while trading in a negative trend. Those with positions could look to cut the stock loose here, but could also wait for some rebound given how volatile it can be. Initial support lies at $124, with previous support at $128 also potentially in play. |
| ROL Rollins, Inc. ($52.68) - Business Products - ROL completed a double bottom at $52, marking its third consecutive sell signal. The 2 for 5'er moved down from a 3 after reversing back into Os against its peers. Additionally, the stock ranks in the bottom half of the business products sector matrix. A sell can be considered here. Initial resistance is at $57, with additional resistance at $61. |
| SCCO Southern Copper Corporation ($192.50) - Metals Non Ferrous - SCCO returned to a buy signal and a positive trend Wednesday when it broke a double top at $194. The positive trend change will promote SCCO to an acceptable 3 for 5'er. From here, the next level of overhead resistance sits at $196, while support can be found at $180. |
| VRT Vertiv Holdings LLC ($372.04) - Computers - Shares of VRT pushed to all-time highs on Wednesday for its third consecutive buy signal. The 5 for 5'er has put together an incredibly strong start to the year, and is currently ranked within the top 20 of the top 500 large cap matrix. However, those looking to buy should wait for consolidation or pullback to the lower $300s given that the stock currently trades in heavily overbought territory. Initial support lies at $352 and $340 with additional support found at $296. |
| Name | Option Symbol | Action | Stop Loss |
|---|---|---|---|
| Walmart Inc. - $131.30 | O: 26I130.00D18 | Buy the September 130.00 calls at 10.85 | 118.00 |
| Name | Option | Action |
|---|---|---|
| UBS AG (Switzerland) ADR ( UBS) | Aug. 40.00 Calls | Raise the option stop loss to 5.00 (CP: 7.20) |
| Advance Auto Parts, Inc. ( AAP) | Sep. 55.00 Calls | Stopped at 50.00 (CP: 50.13) |
| J.P. Morgan Chase & Co. ( JPM) | Jul. 300.00 Calls | Stopped at 15.20 (CP: 14.50) |
| Name | Option Symbol | Action | Stop Loss |
|---|---|---|---|
| Amgen Inc. - $336.72 | O: 26U340.00D18 | Buy the September 340.00 puts at 23.95 | 364.00 |
| Name | Option | Action |
|---|---|---|
| Cognizant Technology Solutions ( CTSH) | Sep. 62.50 Puts | Raise the option stop loss to 13.40 (CP: 15.40) |
| Accenture PLC ( ACN) | Aug. 200.00 Puts | Raise the option stop loss to 38.50 (CP: 44.20) |
| Name | Option Sym. | Call to Sell | Call Price | Investment for 500 Shares | Annual Called Rtn. | Annual Static Rtn. | Downside Protection |
|---|---|---|---|---|---|---|---|
| ATI Inc. $ 161.01 | O: 26G165.00D17 | Jul. 165.00 | 12.90 | $ 77,237.45 | 32.24% | 32.24% | 6.71% |
| Name | Action |
|---|---|
| Delta Air Lines Inc. ( DAL) - 70.71 | Sell the July 72.50 Calls. |
| Starbucks Corporation ( SBUX) - 106.58 | Sell the September 110.00 Calls. |
| Amkor Technology, Inc. ( AMKR) - 73.45 | Sell the July 80.00 Calls. |
| On Semiconductor Corp. ( ON) - 104.11 | Sell the July 105.00 Calls. |
| eBay Inc. ( EBAY) - 110.40 | Sell the July 110.00 Calls. |
| Block Inc ( XYZ) - 72.12 | Sell the July 75.00 Calls. |
| Name | Covered Write |
|---|---|
| Palantir Technologies Inc. Class A ( PLTR - 136.00 ) | July 150.00 covered write. |
| V.F. Corporation ( VFC - 17.59 ) | August 22.00 covered write. |
| Citigroup, Inc. ( C - 126.44 ) | July 130.00 covered write. |
Daily Equity & Market Analysis
Loading, Please Wait...
