Most Requested Symbols

Understanding how different sectors behave across market cycles is critical for evaluating shifts in risk appetite and portfolio positioning. Equity sectors are commonly grouped into growth, cyclical, and defensive categories based on their earnings profiles and sensitivity to macroeconomic conditions. Analyzing the relative performance between these groups provides insight into whether markets are favoring risk-taking or stability at a given point in time.
Leading the way to the downside among the sectors has been Utilities, which along with notable technical developments, may be seeing a change of the guard in terms of underlying leadership themes for the sector.
Weekly Rundown Video – May 13, 2026
Weekly rundown with NDW analyst team covering all major asset classes.
Weekly rundown with NDW analyst team covering all major asset classes.
Beginners Series Webinar: Join us on Monday, May 18th at 2 PM (ET) for our NDW Beginners Series Webinar. This week's topic is: Understanding Relative Strength (RS) & the Matrix Register Here
Understanding how different sectors behave across market cycles is critical for evaluating shifts in risk appetite and portfolio positioning. Equity sectors are commonly grouped into growth, cyclical, and defensive categories based on their earnings profiles and sensitivity to macroeconomic conditions. Analyzing the relative performance between these groups provides insight into whether markets are favoring risk-taking or stability at a given point in time.
Growth sectors are those expected to outpace the broader market, typically driven by secular trends and characterized by higher valuations and sensitivity to interest rates. Cyclical sectors are closely tied to the business cycle, with earnings rising during economic expansions and falling in downturns. Defensive sectors, by contrast, generate stable earnings regardless of economic conditions, as demand for their products and services tends to remain steady even in recessionary environments.
In this analysis, growth and cyclical sectors are grouped together and evaluated relative to defensive sectors using SPDR sector ETFs as proxies. The growth/cyclical basket includes Communication Services (XLC), Consumer Discretionary (XLY), Financials (XLF), Industrials (XLI), Materials (XLB), and Technology (XLK). The defensive basket consists of Consumer Staples (XLP), Health Care (XLV), and Utilities (XLU). Energy and Real Estate are excluded from the analysis due to their less consistent classification across these frameworks. This exclusion helps maintain a cleaner comparison between pro-cyclical and defensive exposures.

The chart above illustrates the rolling one-year performance spread between growth/cyclical sectors and defensive sectors. The red line represents the long-term historical average spread between the two groups. Recent market dynamics show a meaningful resurgence in growth and cyclical leadership, with the spread widening to approximately 20%. This move highlights a sharp rebound in higher-beta and economically sensitive areas of the market, signaling a shift toward a more risk-on environment.

After consolidating clustered signals into distinct observations, there have been approximately 17 instances where the rolling one-year spread exceeded the 20% threshold. The table above summarizes forward returns for each growth/cyclical sector across multiple time horizons following these occurrences. While returns are positive across all time frames, the most notable strength emerges in the intermediate term. Average forward returns reach approximately 4.10% over three months and 8.11% over six months across the group. This consistency across sectors reinforces the persistence of momentum, where strong relative performance tends to carry forward over subsequent periods.
Overall, the analysis suggests that periods of extreme outperformance by growth and cyclical sectors relative to defensives are not only indicative of a risk-on backdrop but are also associated with continued strength in the months that follow. This reinforces the importance of momentum as a factor and highlights how sector leadership trends can provide actionable signals for tactical asset allocation.

While there is still time left, May’s trading has not been too kind to sectors outside of Technology. While tech is up more than 12% so far through May, based on the State Street Technology Select Sector SPDR Fund (XLK), the remaining ten SPDR funds are down an average of 71 basis points. Leading the way to the downside among the sectors has been Utilities, which, along with notable technical developments, may be seeing a change of the guard in terms of underlying leadership themes for the sector.
The State Street Utilities Select Sector SPDR Fund (XLU) has fallen more than 4% during May (thru 5/14), and after reversing down into Os on the default trend chart during last Thursday’s (5/7) trading, this Wednesday’s (5/13) trading led to a second sell signal, with a double bottom break at $44.50. The breakdown follows another failed attempt to penetrate resistance within the $47 range, and brings the chart down to test the bullish support line.

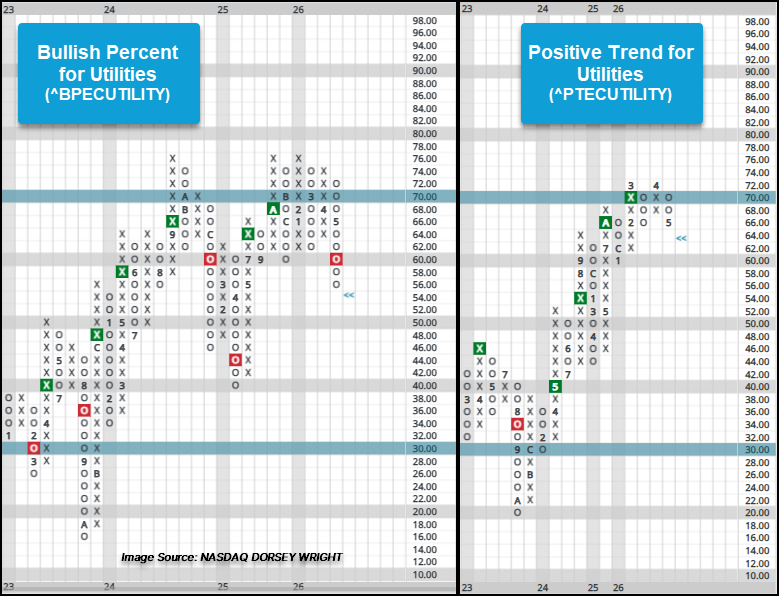
While XLU witnessed a second sell through continued consolidation within the mid $40s, individual utilities names saw a notable shift in those maintaining point and figure buy signals as the broader sector bullish percent (^BPECUTILITY) fell from the mid-60s to the mid-50s, marking the lowest level in roughly 12 months. The subsector bullish percent indicators for electric utilities (^BPEUTI) and gas utilities (^BPGUTI) similarly fell to near or below 12-month lows with readings in the upper 50s and lower 60s during this week’s trading. The long-term positive trend indicator for the broader sector (^PTUTILITY) reversed down to Os to 66% following Wednesday’s (5/13) trading. Though the readings of these intermediate- to long-term indicators have fallen, most still remain above the 50% threshold, suggesting the majority of stocks continue to maintain a buy signal and positive trend. But while utility investors closely monitor those indicators, notable developments within an underlying theme have begun to occur.
While artificial intelligence (AI) has been among, if not the main, theme for the past few years or more, nuclear energy has been a sub-theme that has garnered attention from retail to institutional investors, with AI companies themselves partnering with specific utility providers to power data centers.
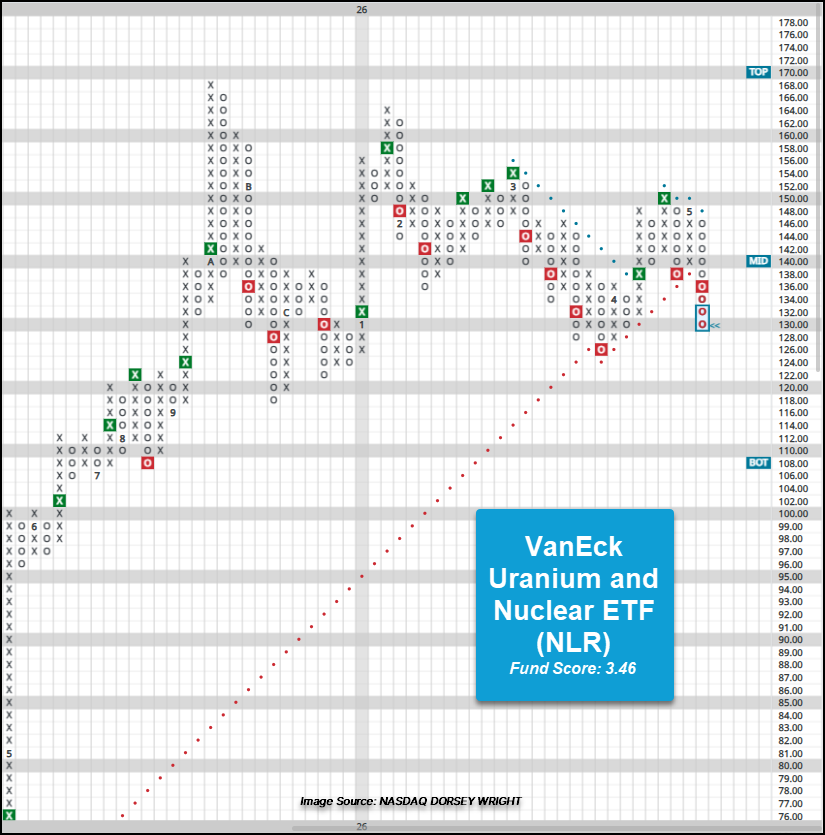
Among the more popular ETFs targeting the nuclear energy theme is the VanEck Uranium and Nuclear ETF (NLR). Similar to XLU above, this week’s trading brought a second sell signal for the fund, but along with the sell signal, NLR also witnessed a violation of its bullish support line, shifting the long-term trend to negative. While the market RS chart has been in Os since February, the peer RS chart for NLR shifted into Os during this week’s trading and brings both charts to within at least a box or two of a potential RS signal change, highlighting not only near-term relative weakness by the fund, but the potential shift in long-term weakness as well. NLR maintains an acceptable fund score of 3.46 as of Wednesday’s (5/14) close, but should additional relative weakness show, the score could see further deterioration. On the trend chart, long-term support still remains in the upper $110s to $130 range, but should these levels be violated, it would break the fund out of a range of consolidation that has been prevalent since Q4 2025.
Funds like XLU and NLR have long-term support intact, but some of the original darlings of the AI-nuclear theme have witnessed notable technical breakdowns during this week’s trading. The aforementioned “original darlings” are traditional utility companies providing nuclear energy, but some of the shift in theme has been diverted from the large utility companies to specialized companies’ development of micro nuclear or energy solutions that can be deployed on-site at data centers. Much of the shift has been driven by companies building data centers seeking reliable solutions to their immense energy needs and less reliance on the current electrical grid.
While there are a few good examples that could be used for conveying those names leading and lagging within the AI nuclear sub-theme, recent trading within NRG Energy (NRG) and Bloom Energy (BE) stands as a prime candidate. To briefly rewind two years though, it is worth noting that NRG Energy was one of the largest suppliers of nuclear energy to the shared power grid by consumers, while Bloom, a maker of micro fuel cell for power generation, was trading around $10 and fairly unknown to those just dipping their toes into the tangent AI theme within nuclear energy. NRG rallied through 2024 and front half of 2025 before stalling in the mid-$100 range. Trading over the past couple of weeks has witnessed NRG move into a negative trend and breakdown out of the phase of consolidation that has persisted for roughly 11 months. Meanwhile, BE similarly rallied in 2024 and 2025, but rather than consolidating and breaking down in 2026 like NRG, BE has continued higher, marking a new all-time chart high above $300 this week. The trend change this week brought NRG down to a 2 for 5’er in technical attribute rating, while BE has maintained a 5 technical attribute rating since mid-April.
The shift within the nuclear AI theme in 2026 has been less focused on the large utility companies with nuclear power plants that were the original darlings within the theme like NRG, Vistra (VST), and Constellation Energy (CEG), and to those companies like Bloom (BE), Oklo (OKLO), and Nano Nuclear (NNE). Even among the new wave of companies garnering attention, BE is currently the only 5 TA rated stock and is trading at an overbought level currently. With the level of price volatility within some of the aforementioned stocks, it does highlight the changing over time of how stocks within a sector can be perceived; these are not the coal and hydroelectric utility dividend payers your grandfather or father may have retired with. While exposure to the broader sector is likely an equal or underweight position within portfolios, shifts within these nuclear utility names have begun to have major effects on the broader sector, one that has historically been associated with defensiveness and less volatile price movement. The recent changes within the AI nuclear sub-theme within utilities and breakdowns within some of the original darlings shown above have brought the broader sector to an intriguing inflection point that will be worth monitoring moving forward.


| Symbol | Name | Price | Yield | PnF Trend | RS Signal | RS Col. | Fund Score | 200 Day MA | Weekly Mom |
|---|---|---|---|---|---|---|---|---|---|
| DIA | State Street SPDR Dow Jones Industrial Average ETF Trust | 500.80 | 1.42 | Positive | Sell | X | 3.77 | 474.49 | + 5W |
| EEM | iShares MSCI Emerging Markets ETF | 67.38 | 1.94 | Positive | Buy | X | 5.63 | 56.29 | + 5W |
| EFA | iShares MSCI EAFE ETF | 103.46 | 3.08 | Positive | Sell | X | 3.75 | 96.84 | + 5W |
| IJH | iShares S&P MidCap 400 Index Fund | 73.44 | 1.22 | Positive | Buy | O | 4.32 | 67.48 | + 6W |
| IJR | iShares S&P SmallCap 600 Index Fund | 136.14 | 1.16 | Positive | Sell | X | 4.25 | 123.34 | + 6W |
| QQQ | Invesco QQQ Trust | 719.79 | 0.46 | Positive | Buy | X | 5.81 | 610.25 | + 6W |
| RSP | Invesco S&P 500 Equal Weight ETF | 203.66 | 1.53 | Positive | Sell | O | 2.83 | 193.43 | + 5W |
| SPY | State Street SPDR S&P 500 ETF Trust | 748.17 | 1.03 | Positive | Buy | X | 5.27 | 675.55 | + 6W |
| XLG | Invesco S&P 500 Top 50 ETF | 64.23 | 0.67 | Positive | Buy | X | 5.55 | 57.80 | + 6W |

Average Level
36.86
| < - -100 | -100 - -80 | -80 - -60 | -60 - -40 | -40 - -20 | -20 - 0 | 0 - 20 | 20 - 40 | 40 - 60 | 60 - 80 | 80 - 100 | 100 - > |
|---|---|---|---|---|---|---|---|---|---|---|---|
|
Buy signalGCC
|
|||||||||||
|
Sell signalUSO
|
Buy signalSPY
|
||||||||||
|
Buy signalefa
|
Buy signalIJH
|
Buy signalXLG
|
|||||||||
|
Sell signaltlt
|
Sell signalgld
|
Buy signalhyg
|
Buy signalGSG
|
Sell signaldia
|
Buy signalVOOG
|
||||||
|
Sell signalief
|
Sell signallqd
|
Buy signaldvy
|
Buy signalrsp
|
Buy signalijr
|
Buy signaliwm
|
Buy signalONEQ
|
|||||
|
Buy signalshy
|
Sell signalagg
|
Sell signaldx/y
|
Buy signalfxe
|
Buy signalicf
|
Buy signalVOOV
|
Buy signalEEM
|
Buy signalQQQ
|
||||
| < - -100 | -100 - -80 | -80 - -60 | -60 - -40 | -40 - -20 | -20 - 0 | 0 - 20 | 20 - 40 | 40 - 60 | 60 - 80 | 80 - 100 | 100 - > |
| AGG | iShares US Core Bond ETF |
| USO | United States Oil Fund |
| DIA | SPDR Dow Jones Industrial Average ETF |
| DVY | iShares Dow Jones Select Dividend Index ETF |
| DX/Y | NYCE U.S.Dollar Index Spot |
| EFA | iShares MSCI EAFE ETF |
| FXE | Invesco CurrencyShares Euro Trust |
| GLD | SPDR Gold Trust |
| GSG | iShares S&P GSCI Commodity-Indexed Trust |
| HYG | iShares iBoxx $ High Yield Corporate Bond ETF |
| ICF | iShares Cohen & Steers Realty ETF |
| IEF | iShares Barclays 7-10 Yr. Tres. Bond ETF |
| LQD | iShares iBoxx $ Investment Grade Corp. Bond ETF |
| IJH | iShares S&P 400 MidCap Index Fund |
| ONEQ | Fidelity Nasdaq Composite Index Track |
| QQQ | Invesco QQQ Trust |
| RSP | Invesco S&P 500 Equal Weight ETF |
| IWM | iShares Russell 2000 Index ETF |
| SHY | iShares Barclays 1-3 Year Tres. Bond ETF |
| IJR | iShares S&P 600 SmallCap Index Fund |
| SPY | SPDR S&P 500 Index ETF Trust |
| TLT | iShares Barclays 20+ Year Treasury Bond ETF |
| GCC | WisdomTree Continuous Commodity Index Fund |
| VOOG | Vanguard S&P 500 Growth ETF |
| VOOV | Vanguard S&P 500 Value ETF |
| EEM | iShares MSCI Emerging Markets ETF |
| XLG | Invesco S&P 500 Top 50 ETF |
| Symbol | Company | Sector | Current Price | Action Price | Target | Stop | Notes |
|---|---|---|---|---|---|---|---|
| BPOP | Popular, Inc. | Banks | $144.84 | hi 130s - low 150s | 200 | 120 | 5 for 5'er, 18 of 174 in favored BANK sector matrix, LT pos peer & mkt RS, triple top, good R-R, 2% yield |
| HAS | Hasbro, Inc. | Leisure | $95.65 | lo-hi 90s | 122 | 79 | 5 TA rating, top 33% of LEIS sector matrix, LT pos trend, pos wkly mom, Earn. 5/20 |
| GRMN | Garmin Ltd. | Leisure | $234.43 | mid 230s - mid 260s | 364 | 196 | 5 TA rating, LT pos trend and mkt RS buy, top 33% of LEIS sector matrix, buy-on-pullback |
| SBUX | Starbucks Corporation | Restaurants | $106.40 | hi 90s - mid 100s | 1296 | 85 | 4 for 5'er, top 20% of REST sector matrix, mkt RS reversal to Xs, triple top, 2.35% yield |
| OSW | OneSpaWorld Holdings Ltd. | Leisure | $23.82 | 22 - 24 | 30.50 | 19 | 5 for 5'er, top half of LEIS sector matrix, LT pos peer & mkt RS, spread quintuple top |
| IMO | Imperial Oil Limited | Oil | $132.39 | mid 120s to mid 130s | 164 | 112 | 5 for 5'er; top quartile of Oil matrix; long term mkt and peer RS; Pos. Trend since May '25. |
| SKT | Tanger Inc. | Real Estate | $35.78 | mid-to-hi 30s | 48 | 31 | 5 for 5'er, top 25% of REAL sector matrix, LT pos peer & mkt RS, R-R~2.0, 3.2% yield |
| IBOC | International Bancshares Corporation | Banks | $71.67 | low-to-mid 70s | 93 | 63 | 4 for 5'er, favored BANK sector, LT pos peer & mkt RS, bearish signal reversal, R-R~2.0, 1.95% yield |
| MSGE | Madison Square Garden Entertainment Corp. | Leisure | $68.48 | 63 to 69 | 98 | 53 | 5 for 5'er since Nov. 2025; Top Decile of Leisure Matrix; Pos. Trend since May 2025; ATH 5/7. |
| TDS | Telephone & Data Systems Inc | Telephone | $41.86 | low 40s | 70 | 35 | 4 for 5'er, favored TELE sector, LT pos peer & mkt RS, buy on pullback, R-R~4.0 |
| LYV | Live Nation Entertainment Inc. | Leisure | $169.99 | low 160s to mid 170s | 202 | 142 | 4 for 5'er; Pos. Trend; Top Half of Leisure Matrix; Within one box of ATH. |
| MO | Altria Group Inc. | Food Beverages/Soap | $72.41 | low-to-mid 70s | 91 | 62 | 4 for 5'er, top quartile of FOOD sector matrix, one box from RS buy, bullish triangle, 5.9% yield |
| Symbol | Company | Sector | Current Price | Action Price | Target | Stop | Notes |
|---|---|---|---|---|---|---|---|
| ADBE | Adobe Systems Incorporated | Software | $237.01 | 240s - 250s | 168 | 288 | 0 for 5'er, bottom third of SOFT sector, LT neg mkt & peer RS, sell on rally, R-R>2.0, Earn. 6/11 |
| Symbol | Company | Sector | Current Price | Action Price | Target | Stop | Notes |
|---|---|---|---|---|---|---|---|
| COST | Costco Wholesale Corporation | Retailing | $1041.25 | 944-1050s | 1296 | 832 | Removed for earnings. Earn. 5/28 |
| Comment | |||||||
|---|---|---|---|---|---|---|---|
|
|
|||||||
MO Altria Group Inc. R ($72.93) - Food Beverages/Soap - MO is a 4 for 5'er that ranks in the top quartile of the food beverages/soap sector matrix and sits one box away from giving a market RS buy signal for the first time since 2019, which would promote it to a 5 for 5'er. On its default chart, MO has given two consecutive buy signals, most recently completing a bullish triangle last month. Long exposure may be added in the low-to-mid $70s and we will set our initial stop at $62, which would take out multiple levels of support on MO's chart and violate its trend line. We will use the bullish price objective, $91, as our target price. MO also carries a 5.9% yield.
| 25 | 26 | ||||||||||||||||||||||||||||
| 74.00 | 5 | 74.00 | |||||||||||||||||||||||||||
| 73.00 | X | O | 73.00 | ||||||||||||||||||||||||||
| 72.00 | X | O | X | 72.00 | |||||||||||||||||||||||||
| 71.00 | X | O | X | 71.00 | |||||||||||||||||||||||||
| 70.00 | X | X | O | X | 70.00 | ||||||||||||||||||||||||
| 69.00 | • | X | O | X | O | 69.00 | |||||||||||||||||||||||
| 68.00 | X | • | • | X | O | X | 68.00 | ||||||||||||||||||||||
| 67.00 | X | O | A | • | X | 3 | X | X | Mid | 67.00 | |||||||||||||||||||
| 66.00 | X | O | X | O | • | X | O | X | O | X | 66.00 | ||||||||||||||||||
| 65.00 | X | 9 | X | O | • | X | O | X | O | X | 65.00 | ||||||||||||||||||
| 64.00 | X | O | O | X | X | O | X | 4 | 64.00 | ||||||||||||||||||||
| 63.00 | 8 | O | X | O | 2 | O | • | 63.00 | |||||||||||||||||||||
| 62.00 | X | O | X | O | X | • | 62.00 | ||||||||||||||||||||||
| 61.00 | X | X | O | X | O | X | • | 61.00 | |||||||||||||||||||||
| 60.00 | X | 5 | O | X | X | O | X | O | • | 60.00 | |||||||||||||||||||
| 59.00 | X | O | X | X | O | X | O | X | O | X | • | 59.00 | |||||||||||||||||
| 58.00 | X | X | O | X | O | X | O | X | O | X | O | X | • | 58.00 | |||||||||||||||
| 57.00 | X | O | 3 | 4 | X | O | X | O | 7 | • | O | X | • | 57.00 | |||||||||||||||
| 56.00 | X | O | X | O | O | X | • | 1 | X | • | Bot | 56.00 | |||||||||||||||||
| 55.00 | B | C | X | O | X | • | O | • | 55.00 | ||||||||||||||||||||
| 54.00 | 9 | X | O | 2 | O | X | • | • | 54.00 | ||||||||||||||||||||
| 53.00 | X | O | X | O | X | O | • | 53.00 | |||||||||||||||||||||
| 52.00 | X | O | X | O | X | • | 52.00 | ||||||||||||||||||||||
| 51.00 | 8 | O | X | 1 | • | 51.00 | |||||||||||||||||||||||
| 50.00 | X | O | X | • | 50.00 | ||||||||||||||||||||||||
| 49.00 | X | A | • | 49.00 | |||||||||||||||||||||||||
| 48.00 | X | • | 48.00 | ||||||||||||||||||||||||||
| 47.00 | 7 | • | 47.00 | ||||||||||||||||||||||||||
| 46.00 | O | X | • | 46.00 | |||||||||||||||||||||||||
| 45.00 | O | X | • | 45.00 | |||||||||||||||||||||||||
| 44.00 | O | • | 44.00 | ||||||||||||||||||||||||||
| 25 | 26 |

| APP AppLovin Corp. Class A ($503.49) - Software - Shares of APP broke a triple top at $496 for its fifth consecutive buy signal. The stock has improved with the software sector over the last several weeks, moving back to a positive trend and up to a 3 for 5'er. APP remains more of a hold than anything, but is one to potentially keep an eye on given its recent improvement. From here, initial resistance lies at $520 then $568. |
| JBHT J.B. Hunt Transport Services, Inc. ($262.21) - Transports/Non Air - JBHT moved to new all-time highs today. While the stock is still only a 3/'5'er, it is up over 30% so far this year and the technical picture has broken to the upside since our last comment. On top of that, recent action has set up a nice layer of support at $232, around another point of old resistance. While we are a bit overbought around current levels, adding to JBHT wouldn't be a bad option on some normalization. |
| NOW Servicenow Inc ($95.20) - Software - Shares of NOW broke a double top at $95 to move back to a buy signal. However, the 0 for 5'er continues to lack strength, trading in a negative trend for over six months. It also sits in the bottom 10 names of the top 500 large cap matrix. Overall, it remains a stock to avoid until it shows significant improvement. |
| TLN Talen Energy Corp ($335.41) - Utilities/Electricity - TLN reversed into Os and broke a double bottom at $336 for a second sell signal. The break also violates the bullish support line, which will drop the stock down to a 4 for 5'er. Due note, both the market and peer RS charts reside within one box of reversing down into Os, leaving two additional attributes at risk. Support lies at current levels, while additional can be found in the lower $300. |
| WPM Wheaton Precious Metals Corp ($130.41) - Precious Metals - WPM was down more than 6% on Friday, falling to a sell signal and a negative trend. The trend change will drop the stock to unfavorable 2 for 5'er. From here, the next level of support on WPM's chart sits at $124. |
| XOM Exxon Mobil Corporation ($157.92) - Oil - XOM gave an initial buy signal Friday when it broke a double top at $156. Friday's move adds evidence to an already positive technical picture as XOM is a 4 for 5'er that ranks near the middle of the oil sector matrix. The stock now sits against resistance at $158. Meanwhile, support can be found at $144. |
| Name | Option Symbol | Action | Stop Loss |
|---|---|---|---|
| DuPont de Nemours Inc. - $49.31 | O: 26H50.00D21 | Buy the August 50.00 calls at 3.80 | 44.00 |
| Name | Option | Action |
|---|---|---|
| Corteva Inc ( CTVA) | May. 80.00 Calls | Expired at 2.21 |
| Fortinet Inc. ( FTNT) | Jul. 85.00 Calls | Raise the option stop loss to 34.85 (CP: 36.85) |
| Altria Group Inc. ( MO) | Sep. 70.00 Calls | Initiate an option stop loss of 3.20 (CP: 5.20) |
| Name | Option Symbol | Action | Stop Loss |
|---|---|---|---|
| GoDaddy Inc. - $87.18 | O: 26S87.50D17 | Buy the July 87.50 puts at 6.35 | 95.00 |
| Name | Option | Action |
|---|---|---|
| The Southern Company ( SO) | May. 92.50 Puts | Expired at 0 |
| Zoetis Inc. ( ZTS) | Jul. 120.00 Puts | Raise the option stop loss to 42.00 (CP: 44.00) |
| American International Group, Inc. ( AIG) | May. 75.00 Puts | Expired at 0 |
| Accenture PLC ( ACN) | Aug. 200.00 Puts | Stopped at 38.50 (CP: 37.10) |
| The Walt Disney Company ( DIS) | Jul. 110.00 Puts | Raise the option stop loss to 6.55 (CP: 8.55) |
| Amgen Inc. ( AMGN) | Sep. 340.00 Puts | Initiate an option stop loss of 24.70 (CP: 26.70) |
| Name | Option Sym. | Call to Sell | Call Price | Investment for 500 Shares | Annual Called Rtn. | Annual Static Rtn. | Downside Protection |
|---|---|---|---|---|---|---|---|
| General Motors $ 77.75 | O: 26I77.50D18 | Sep. 77.50 | 5.50 | $ 35,263.60 | 25.55% | 19.28% | 6.24% |
| Name | Action |
|---|---|
| Delta Air Lines Inc. ( DAL) - 71.55 | Sell the July 72.50 Calls. |
| Starbucks Corporation ( SBUX) - 106.40 | Sell the September 110.00 Calls. |
| Amkor Technology, Inc. ( AMKR) - 72.09 | Sell the July 80.00 Calls. |
| On Semiconductor Corp. ( ON) - 118.37 | Sell the July 105.00 Calls. |
| Block Inc ( XYZ) - 71.53 | Sell the July 75.00 Calls. |
| ATI Inc. ( ATI) - 162.57 | Sell the July 165.00 Calls. |
| Oracle Corporation ( ORCL) - 195.61 | Sell the August 200.00 Calls. |
| Name | Covered Write |
|---|---|
|
|
|
Daily Equity & Market Analysis
Loading, Please Wait...
