Small caps remain actionable... but have lost some relative strength with recent market action. We discuss this and how it helps you build out the full picture when considering an investment framework
At the cornerstone of NDW analysis lies relative strength. Relative strength is pivotal in understanding which asset(s) are fit for investment over others, rather than focusing on which direction a security is heading. In simple terms, your clients might be happy if you tell them their portfolio was up 10% in any given year…. but only if you omitted the fact that the broader market was up 20%. Said otherwise, relative strength is a key player in understanding who is leading that pack, and is a fundamental building block of NDW strategies and analysis.
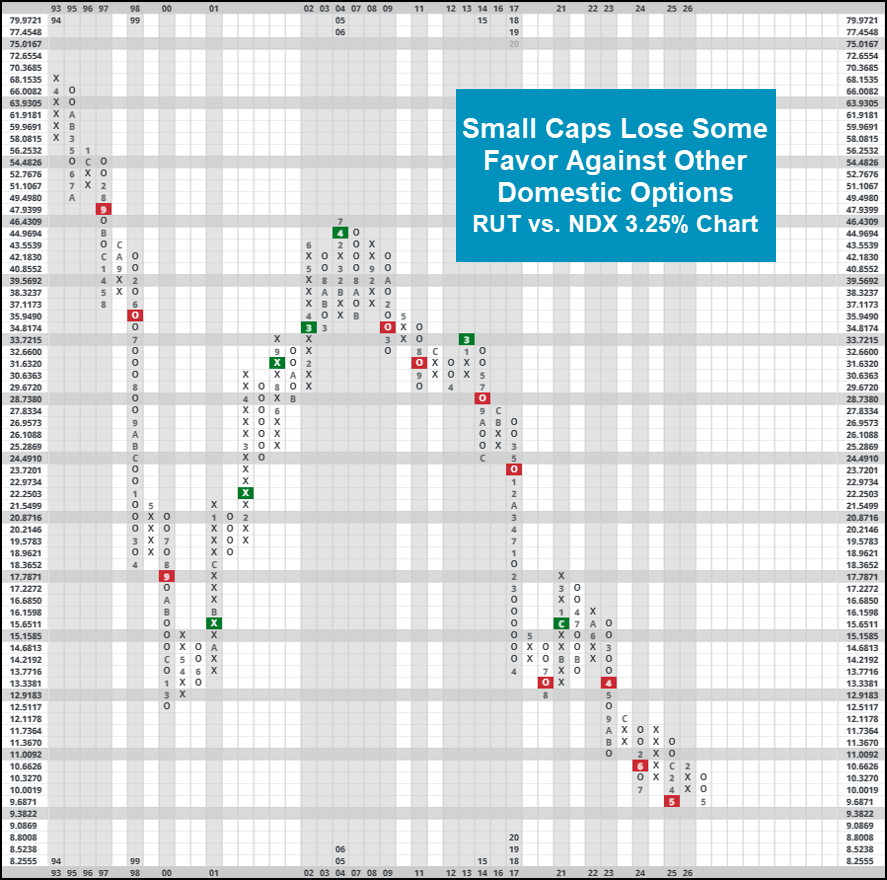
Given the understanding that relative strength is important, it goes without saying that many members of the NDW analyst team utilize different relative strength tests to help identify the everchanging leadership landscape. For many of us, these tracked RS charts will utilize some combination of broad domestic equity indices vs. cash, other major benchmarks, sectors, or some combination of the group. Over the last week, one major shift between major domestic representatives came on a 3.25% chart between the Russell 2000 (RUT) and the Nasdaq-100 (NDX). With action on 5/13, this chart reversed back down into O’s favoring NDX, matching its lowest point of “relative price” dating back to May of 2025. This marks the first constructive move on this chart in favor of NDX of 2026. However, perhaps the most important point of nuance here builds on a often discussed topic within NDW research: Consistency. While February’s reversal towards RUT was certainly interesting, it by no means would have convinced the astute trend follower that small caps had taken over their large cap tech counterparts for the long-term. Those following an RS Switching (owns whichever asset is on a buy signal) between [RUT & NDX would have been rewarded with a portfolio value that surpasses a buy and hold value of holding either asset on its own.
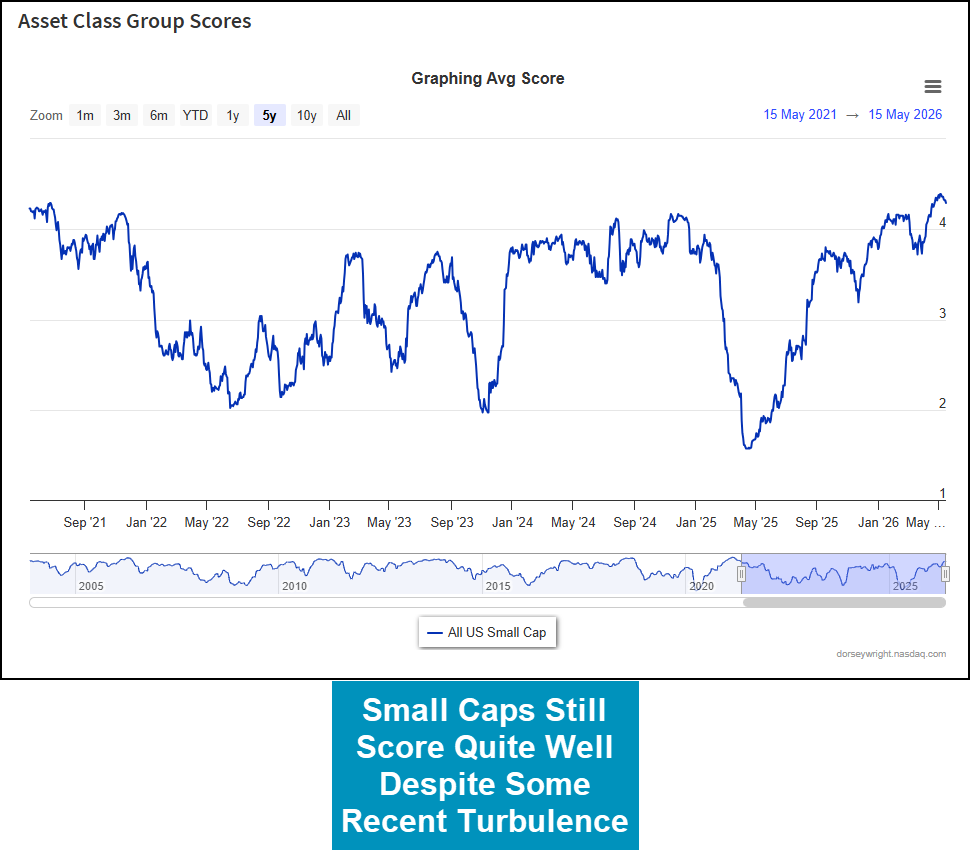
As discussed previously, relative strength can help identify which assets between a group are relatively strong, it is an important point to note that in depth analysis of a group’s absolute performance can also qualify specific assets fit for investment, particularly when considering typical portfolio constraints. Said more plainly, in a world where deploying all of a client’s portfolio to NDX would violate several compliance requirements, knowing that there are other “strong” asset groups allows you to properly diversify into different asset classes. While still relative by nature, utilizing NDW’s broad ranking tools like the DALI rankings or Asset Class Group Scores Page can help support a groups overall strength (or perhaps, lack thereof.) For instance, even though small caps have weakened against other areas, the All Small Caps group on the ACGS page scores quite strongly with an average score of 4.29. This outpaces several other areas, but does notably lag behind the S&P 500/core group- arguably the most important benchmark when deciding your broader small cap exposure. When you are looking for which names to pick, NDW offers our small cap buy list, which offers lists of technically strong small cap options across various sectors. As always, keep an eye on the charts to be notified of any important changes as they occur.