
Inflation is the consumer’s biggest enemy, and anyone buying gas or groceries over the last several years can attest to that. Unfortunately, the impact of inflation often goes beyond our budgets, with portfolios taking a hit while strength shifts underneath the surface.
Inflation is the consumer’s biggest enemy, and anyone buying gas or groceries over the last several years can attest to that. Unfortunately, the impact of inflation often goes beyond our budgets, with portfolios taking a hit while strength shifts underneath the surface. Higher inflation is combated with higher interest rates from the Fed, lowering fixed income prices while slowing down the economy, often shrinking equity valuations as well. This past Friday, the S&P 500 fell 1.2% as the 10‑year Treasury yield pushed well above 4.5%—a level that has recently worried Wall Street and is often associated with pressure on equity valuations as discount rates reset higher. However, not all areas face headwinds from higher inflation. With the prices of goods and resources rising, commodities are a natural beneficiary, and the group has been one of the best performing areas of the market this year as inflation worries grow.
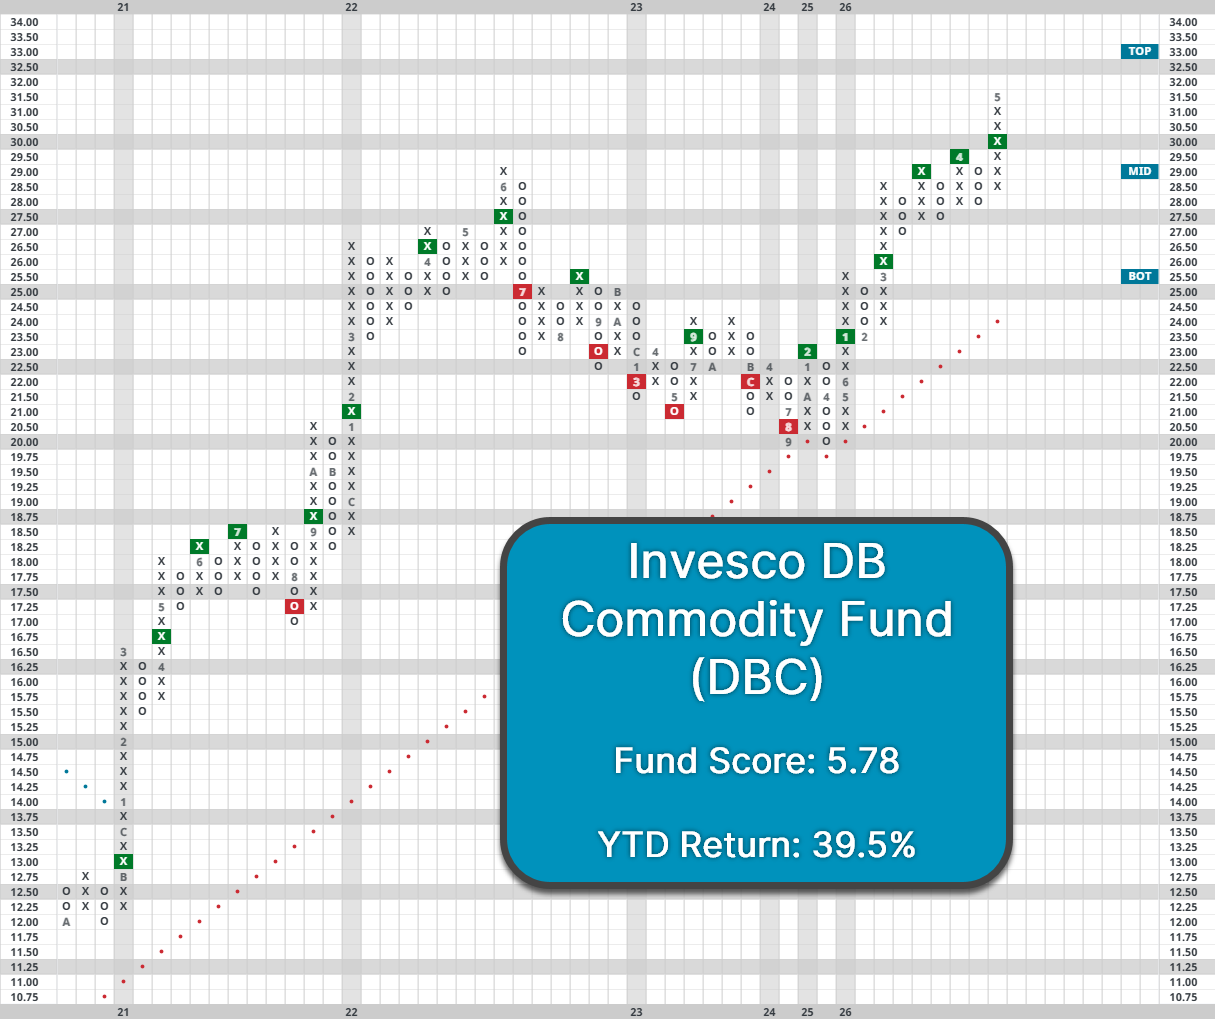
The Invesco DB Commodity Index Tracking Fund (DBC) is up nearly 40% YTD and has consistently pushed higher over that span. The fund is on a streak of five consecutive buy signals—its longest since the asset class rallied from its COVID lows. DBC’s improvement over that span has pushed its fund score up to a near-perfect 5.79, in addition to a sharply positive score direction of 3.59. Despite its rapid gains, the fund trades in relatively actionable territory with an OBOS reading around 50%. Initial support for the fund lies between $27 and $28, with the bullish support line at $24. While commodities could be hurt by a resolution of the Iran conflict if oil prices fall back down to Earth, the group’s long-term relative strength remains attractive for now.
In addition to hurting some of the most common parts of portfolios, inflation can also disrupt established norms. Fixed income is seen as the biggest staple of diversification from equities, but when rates are increasing or at higher levels, those diversification benefits can fall apart. Over the past year, AGG has a positive correlation of 0.27 with the S&P 500. Additionally, environments where 2yr rates (light gray) are high or rising are more likely to see higher sustained correlations, as was the case for much of the 90s. Meanwhile, commodities have served as a better portfolio diversifier over the past year, with DBC displaying a correlation of negative 0.22 with SPX. While there’s no guarantee it will stay around there, periods like the 90s or 2022 to 2024 show that it’s possible for commodities to serve as a better diversifier than bonds for a sustained time.

Ultimately, the outlook of the two asset classes is largely a function of where monetary policy needs to adjust. The two-year Treasury yield is often the best indication of near-term policy expectations for where the Federal Reserve will move interest rates. When the US2YR rate increases, usually in response to elevated inflation, commodities have performed much better while bonds have struggled. Specifically, if US2YR rose in a calendar year, DBC gained 14.2% while AGG rose 0.9%. Conversely, if the two-year rate fell on the year, DBC gained 1.2% while AGG gained 9.1%. If policy is expected to lean more hawkish over the next year, then it would make sense to prefer commodities over bonds. Unfortunately, there’s no magic crystal ball we can use to predict exactly what rates will do over the next year, even if there might be solid guesses.
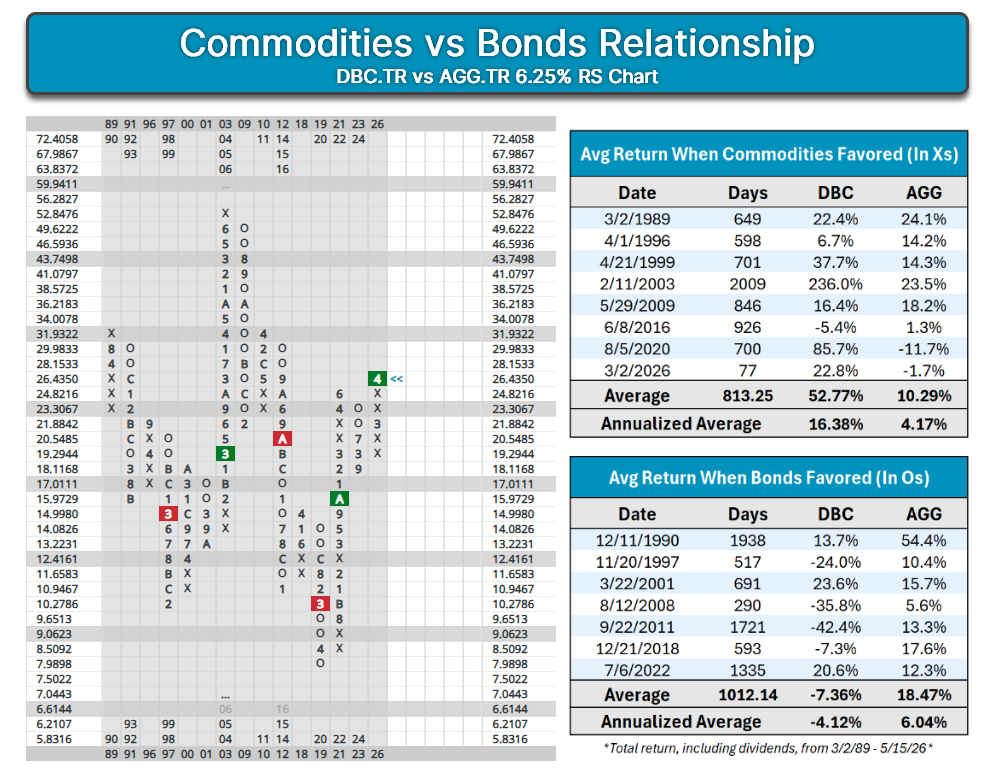
Rather than making portfolio decisions off predictions, relative strength has been just as good as an indication of whether an environment will favor commodities or bonds. Looking relative strength chart between DBC and AGG on a 6.5% scale (including their dividends), following column changes have been extremely profitable. When commodities are favored and the chart is in Xs, DBC averaged an annualized return of 16.5% compared to 4.2% for AGG. When bonds are favored and the chart is in Os, then DBC averages an annual decline of 4.1% compared to a 6% gain for AGG. In essence, following the RS chart has been just as effective as if you were able to predict what rates would be a year in the future, underscoring the relationship’s consistency. Granted, it's unrealistic to assume that investors can come entirely out of fixed income, but the relationship is still serves as a solid indicator.
With DBC remaining in Xs while the broader asset class sits well ahead of fixed income in DALI, the weight of the technical evidence suggests that our current environment is more conducive to higher rates and inflation. Additionally, inflation has remained stubbornly elevated recently, mentioned in last week’s fixed income update, supporting the need for a potential rise in interest rates over the next couple of years. If that scenario does play out, overweighting commodities could help defend against those moves from both a return and diversification perspective.
