Most Requested Symbols

Of the 28 trading days in the books so far in Q2 (3/31 – 5/11), XLK has been positive during 25 of those with an average return of 1.3% per day during positive trading days as the fund has gained more than 30%.
The rise in equity prices over the last few years, despite some uncomfortable bumps in the road, has led the S&P 500 Index ([SPX]) to reach historically expensive levels.
Weekly Rundown Video – May 6, 2026
Weekly rundown with NDW analyst team covering all major asset classes.
Weekly rundown with NDW analyst team covering all major asset classes.
While Monday’s (5/11) trading appeared muted for broader U.S. equity indices with the S&P 500 Index (SPX) up 19 basis points, technology continued its charge higher with the State Street Technology Select Sector SPDR ETF (XLK) gaining 1.3% and rallying to a new chart high at $178. Of the 28 trading days in the books so far in Q2 (3/31 – 5/11), XLK has been positive during 25 of those with an average return of 1.3% per day during positive trading days (average return of 1% including the three negative trading days) as the fund has gained more than 30%.
An examination under the hood of the individual holdings within XLK reveals that 29 out of 73 (or roughly 40%) have made new or matched all-time chart highs during the month of May, with 20 of those 29 improving on recent highs during Monday’s trading. Below is the list of XLK holdings that have reached new highs, organized by date. Among those individual stocks to push to new all-time highs during Monday’s (5/11) trading are NVIDIA (NVDA), Micron (MU), Advanced Micro Devices (AMD), Intel (INTC), and Cisco (CSCO).

On the trend chart, XLK reversed into a column of Xs to kick of Q2 in the lower $130s and has since maintained that column as the fund has rallied to new highs this week, extending further into overbought territory. Monday’s (5/11) Daily Equity Report covered the broader market’s recent run into overbought territory, noting that while currently in very overbought territory, the weekly OBOS readings haven’t gotten to rarified territory, just yet. For XLK though, the weekly overbought reading for the fund has reached its highest level ever with data going back to the beginning of 1999. Friday’s (5/8) trading solidified the highest weekly OBOS reading by the week’s end (when the readings become official) at 136%, while Monday’s trading brought a further increase to the weekly OBOS reading at 146%.

The continued push to new highs in recent weeks by XLK has brought technical improvements as well, with the market RS chart against the S&P 500 Equal Weight Index (SPXEWI) reversing back into Xs in the back half of April. With a fund score of 5.78 (out of 6), XLK scores higher than the average technology fund (4.33) on the Asset Class Group Scores page, lagging only semiconductor and smaller cap tech ETFs in terms of fund score.
With the extension into overbought territory prevalent on charts like XLK’s, investors will look for when and to what extent a pullback might persist. Ideally, pulling back, consolidating near highs, developing support near current trading levels, and a normalization of the 10-week trading band and weekly overbought/oversold reading provides a constructive setup for potentially entering into positions coming off recent highs. Tuesday’s action brought about a reversal into Os from recent highs to $172, but a further pullback to the lower $160 to upper $150 range to bring the fund into a more actionable range. Prior resistance around $150 may be seen as initial support, while support at $128 has been in place since August of 2025.


The rise in equity prices over the last few years, despite some uncomfortable bumps in the road, has led the S&P 500 Index (SPX) to reach historically expensive levels. With data going back to mid-1999, the P/E over the last twelve months (LTM) for SPX is nearly 30. The other two times the LTM P/E was this high were mid-2021 and 1999. However, LTM P/E is backwards looking and doesn’t focus on investor expectations for future earnings growth. Expectations of AI-driven economic growth naturally push the next twelve month (NTM) P/E for SPX down to about 21. It is normal for LTM P/E to be above NTM P/E as markets usually price in some form of earnings growth over the next year. However, both LTM and NTM P/E for SPX are well above their historical averages since 1999 of 19.1 and 16.7, respectively. Furthermore, both metrics are near the top-end of their historical ranges as highlighted in the chart below.
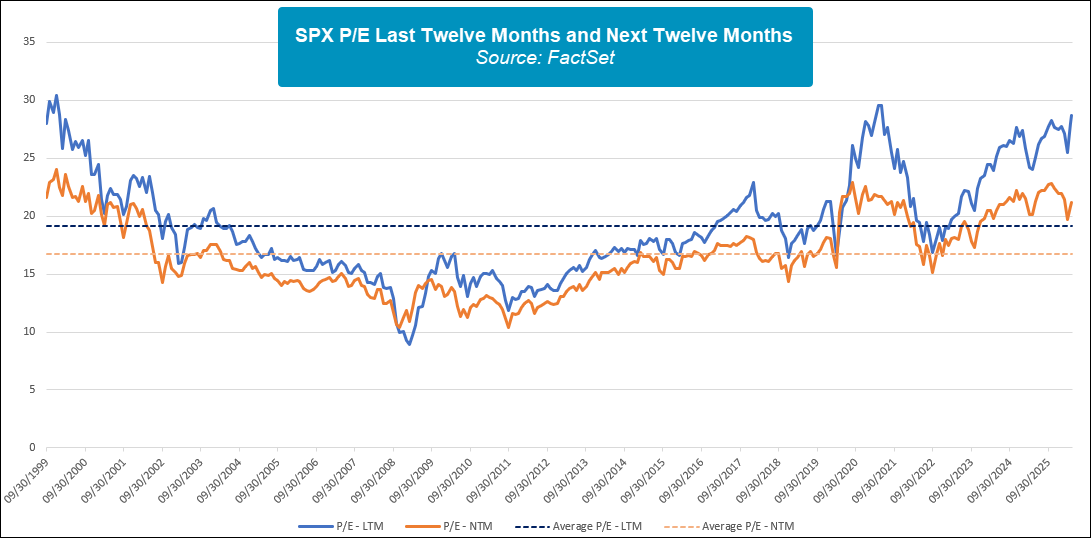
While it is almost always the case that LTM P/E is greater than NTM P/E, there is rarely this big of a spread between the two. The average historical spread between LTM P/E and NTM P/E is just over two but is currently north of seven. Plainly, there are enormous expectations for earnings growth to justify current prices. The last two times the spread between LTM P/E and NTM P/E hit seven were in October 1999 and April 2021. October 1999 naturally draws parallels to today with tech-related optimism. April 2021, while showing even higher earnings expectations, was fueled by unprecedented fiscal and monetary support for the economy as policymakers attempted to deal with the fallout from the covid shutdown. Even with some historical precedent, two prior occurrences are not nearly enough to make well-founded predictions about the future. Of course, AI could impact the economy even more than what is currently priced in the market. However, we can say that the expectations are exceptionally high and there is little room for error if markets are to remain at current price levels.

With the caveat of a small sample size behind us, the forward returns for SPX when the spread between LTM P/E and NTM P/E hits seven are muted. Average one year and two year forward returns are 0.02% and -9.62%, respectively. Interestingly, returns over the next six months were strong with both prior instances gaining over 7%. While we won’t know the forward returns until they happen, the prior one-year and two-year returns leading up to the P/E spread rising above seven are very similar this time to 1999 and 2021. While we have only mentioned point-to-point forward returns, both prior periods had large drawdowns over the next two years. Following both October 1999 and April 2021, SPX entered a bear market both times if using the common 20% decline to define a bear market. Before anyone gets too despondent (or excited), we have a small sample size and no real relative strength changes to suggest weakness is developing. However, if the market is unable to meet the current lofty expectations, we could see a similar situation to the last two times they were this high.

Average Level
37.90
| < - -100 | -100 - -80 | -80 - -60 | -60 - -40 | -40 - -20 | -20 - 0 | 0 - 20 | 20 - 40 | 40 - 60 | 60 - 80 | 80 - 100 | 100 - > |
|---|---|---|---|---|---|---|---|---|---|---|---|
|
Buy signalshy
|
Sell signalUSO
|
||||||||||
|
Sell signalief
|
Buy signalGSG
|
Sell signaldia
|
Buy signalVOOG
|
||||||||
|
Sell signaltlt
|
Buy signalefa
|
Buy signalIJH
|
Buy signalEEM
|
Buy signalGCC
|
|||||||
|
Sell signaldx/y
|
Sell signalgld
|
Buy signaldvy
|
Buy signalfxe
|
Buy signalicf
|
Buy signalijr
|
Buy signalSPY
|
Buy signalONEQ
|
||||
|
Sell signalagg
|
Sell signallqd
|
Buy signalhyg
|
Buy signalrsp
|
Buy signalVOOV
|
Buy signaliwm
|
Buy signalXLG
|
Buy signalQQQ
|
||||
| < - -100 | -100 - -80 | -80 - -60 | -60 - -40 | -40 - -20 | -20 - 0 | 0 - 20 | 20 - 40 | 40 - 60 | 60 - 80 | 80 - 100 | 100 - > |
| AGG | iShares US Core Bond ETF |
| USO | United States Oil Fund |
| DIA | SPDR Dow Jones Industrial Average ETF |
| DVY | iShares Dow Jones Select Dividend Index ETF |
| DX/Y | NYCE U.S.Dollar Index Spot |
| EFA | iShares MSCI EAFE ETF |
| FXE | Invesco CurrencyShares Euro Trust |
| GLD | SPDR Gold Trust |
| GSG | iShares S&P GSCI Commodity-Indexed Trust |
| HYG | iShares iBoxx $ High Yield Corporate Bond ETF |
| ICF | iShares Cohen & Steers Realty ETF |
| IEF | iShares Barclays 7-10 Yr. Tres. Bond ETF |
| LQD | iShares iBoxx $ Investment Grade Corp. Bond ETF |
| IJH | iShares S&P 400 MidCap Index Fund |
| ONEQ | Fidelity Nasdaq Composite Index Track |
| QQQ | Invesco QQQ Trust |
| RSP | Invesco S&P 500 Equal Weight ETF |
| IWM | iShares Russell 2000 Index ETF |
| SHY | iShares Barclays 1-3 Year Tres. Bond ETF |
| IJR | iShares S&P 600 SmallCap Index Fund |
| SPY | SPDR S&P 500 Index ETF Trust |
| TLT | iShares Barclays 20+ Year Treasury Bond ETF |
| GCC | WisdomTree Continuous Commodity Index Fund |
| VOOG | Vanguard S&P 500 Growth ETF |
| VOOV | Vanguard S&P 500 Value ETF |
| EEM | iShares MSCI Emerging Markets ETF |
| XLG | Invesco S&P 500 Top 50 ETF |

| Symbol | Company | Sector | Current Price | Action Price | Target | Stop | Notes |
|---|---|---|---|---|---|---|---|
| COST | Costco Wholesale Corporation | Retailing | $999.47 | 944-1050s | 1296 | 832 | 4 TA rating, top 33% of retail sector matrix, LT mkt RS buy, LT pos trend, consec buy signals, Earn. 5/28 |
| DRI | Darden Restaurants, Inc. | Restaurants | $195.80 | 190s - low 200s | 226 | 168 | 4 for 5'er, LT pos peer & mkt RS, pos trend flip, triple top, 3% yield |
| BPOP | Popular, Inc. | Banks | $146.95 | hi 130s - low 150s | 200 | 120 | 5 for 5'er, 18 of 174 in favored BANK sector matrix, LT pos peer & mkt RS, triple top, good R-R, 2% yield |
| HAS | Hasbro, Inc. | Leisure | $95.18 | lo-hi 90s | 122 | 79 | 5 TA rating, top 33% of LEIS sector matrix, LT pos trend, pos wkly mom, Earn. 5/20 |
| GRMN | Garmin Ltd. | Leisure | $242.38 | mid 230s - mid 260s | 364 | 196 | 5 TA rating, LT pos trend and mkt RS buy, top 33% of LEIS sector matrix, buy-on-pullback |
| SBUX | Starbucks Corporation | Restaurants | $105.74 | hi 90s - mid 100s | 1296 | 85 | 4 for 5'er, top 20% of REST sector matrix, mkt RS reversal to Xs, triple top, 2.35% yield |
| OSW | OneSpaWorld Holdings Ltd. | Leisure | $24.00 | 22 - 24 | 30.50 | 19 | 5 for 5'er, top half of LEIS sector matrix, LT pos peer & mkt RS, spread quintuple top |
| IMO | Imperial Oil Limited | Oil | $130.23 | mid 120s to mid 130s | 164 | 112 | 5 for 5'er; top quartile of Oil matrix; long term mkt and peer RS; Pos. Trend since May '25. |
| SKT | Tanger Inc. | Real Estate | $36.01 | mid-to-hi 30s | 48 | 31 | 5 for 5'er, top 25% of REAL sector matrix, LT pos peer & mkt RS, R-R~2.0, 3.2% yield |
| IBOC | International Bancshares Corporation | Banks | $72.96 | low-to-mid 70s | 93 | 63 | 4 for 5'er, favored BANK sector, LT pos peer & mkt RS, bearish signal reversal, R-R~2.0, 1.95% yield |
| MSGE | Madison Square Garden Entertainment Corp. | Leisure | $63.95 | 63 to 69 | 98 | 53 | 5 for 5'er since Nov. 2025; Top Decile of Leisure Matrix; Pos. Trend since May 2025; ATH 5/7. |
| Symbol | Company | Sector | Current Price | Action Price | Target | Stop | Notes |
|---|---|---|---|---|---|---|---|
| ADBE | Adobe Systems Incorporated | Software | $246.15 | 240s - 250s | 168 | 288 | 0 for 5'er, bottom third of SOFT sector, LT neg mkt & peer RS, sell on rally, R-R>2.0 |
| Comment | |||||||
|---|---|---|---|---|---|---|---|
|
|
|||||||
MSGE Madison Square Garden Entertainment Corp. R ($64.65) - Leisure - MSGE has been a 5 for 5’er in technical attribute rating since November 2025. Along with superior near- and long-term relative strength against the market and its peer group, MSGE ranks within the top decile of the Leisure sector matrix. On the trend chart, MSGE has maintained a positive trend since May 2025 and returned to a buy signal in the latter part of April this year. Action during May brought the chart to a new all-time high at $69 on 5/7 before pulling back to the lower $60s and then reversing higher to $66 during Tuesday’s (5/12) intraday trading. Long exposure may be considered in the $63 to $69 range. The initial stop loss will be set at $53, which would violate multiple levels of support as well as the bullish support line. We will utilize the bullish price objective of $98 as out target price.
| 26 | |||||||||||||||||||||||||||||
| 69.00 | X | 69.00 | |||||||||||||||||||||||||||
| 68.00 | 5 | O | 68.00 | ||||||||||||||||||||||||||
| 67.00 | X | O | 67.00 | ||||||||||||||||||||||||||
| 66.00 | X | O | 66.00 | ||||||||||||||||||||||||||
| 65.00 | X | X | O | 65.00 | |||||||||||||||||||||||||
| 64.00 | X | O | X | O | 64.00 | ||||||||||||||||||||||||
| 63.00 | 2 | X | O | X | X | O | 63.00 | ||||||||||||||||||||||
| 62.00 | X | O | X | X | O | X | O | X | 62.00 | ||||||||||||||||||||
| 61.00 | X | X | O | X | O | X | O | X | O | X | 61.00 | ||||||||||||||||||
| 60.00 | X | O | X | O | X | O | X | O | X | 3 | 4 | Mid | 60.00 | ||||||||||||||||
| 59.00 | X | O | X | O | X | O | O | O | X | 59.00 | |||||||||||||||||||
| 58.00 | X | O | O | O | X | 58.00 | |||||||||||||||||||||||
| 57.00 | X | O | X | 57.00 | |||||||||||||||||||||||||
| 56.00 | X | O | X | 56.00 | |||||||||||||||||||||||||
| 55.00 | X | 1 | O | 55.00 | |||||||||||||||||||||||||
| 54.00 | X | O | X | 54.00 | |||||||||||||||||||||||||
| 53.00 | X | O | X | 53.00 | |||||||||||||||||||||||||
| 52.00 | X | O | • | 52.00 | |||||||||||||||||||||||||
| 51.00 | X | • | 51.00 | ||||||||||||||||||||||||||
| 50.00 | C | • | 50.00 | ||||||||||||||||||||||||||
| 49.00 | X | X | • | Bot | 49.00 | ||||||||||||||||||||||||
| 48.00 | X | X | O | X | • | 48.00 | |||||||||||||||||||||||
| 47.00 | A | O | B | O | X | • | 47.00 | ||||||||||||||||||||||
| 46.00 | X | O | X | O | X | • | 46.00 | ||||||||||||||||||||||
| 45.00 | X | O | X | O | • | 45.00 | |||||||||||||||||||||||
| 44.00 | X | O | X | • | 44.00 | ||||||||||||||||||||||||
| 43.00 | X | O | X | • | 43.00 | ||||||||||||||||||||||||
| 42.00 | X | O | • | 42.00 | |||||||||||||||||||||||||
| 41.00 | X | X | 9 | • | 41.00 | ||||||||||||||||||||||||
| 40.00 | X | O | X | O | X | X | • | 40.00 | |||||||||||||||||||||
| 39.00 | • | 6 | O | X | O | X | O | X | • | 39.00 | |||||||||||||||||||
| 38.00 | • | X | 7 | O | X | O | X | • | 38.00 | ||||||||||||||||||||
| 37.00 | X | 8 | O | X | • | 37.00 | |||||||||||||||||||||||
| 36.00 | X | O | • | 36.00 | |||||||||||||||||||||||||
| 35.00 | X | • | 35.00 | ||||||||||||||||||||||||||
| 34.00 | X | 5 | • | 34.00 | |||||||||||||||||||||||||
| 33.00 | X | O | X | • | 33.00 | ||||||||||||||||||||||||
| 32.00 | X | O | X | • | 32.00 | ||||||||||||||||||||||||
| 31.00 | 4 | X | • | 31.00 | |||||||||||||||||||||||||
| 30.00 | O | X | • | 30.00 | |||||||||||||||||||||||||
| 29.00 | O | • | 29.00 | ||||||||||||||||||||||||||
| 26 |
| DECK Deckers Outdoor Corporation ($94.89) - Textiles/Apparel - DECK broke a double bottom at $96 for a second sell signal as shares fell to $95. This will violate the bullish support line, which will drop the stock down to a 1 for 5'er trading in a negative trend. The break follows both the peer and market RS charts returning to Os earlier in May. Support for the stock now lies at $93, while the November 2025 chart lows reside around $80. |
| DHI D.R. Horton, Inc. ($143.50) - Building - DHI broke a double bottom at $142 to return the stock to a sell signal. The move also violates the bullish support line, which will drop the stock down to a 1 for 5'er trading in a negative trend. This breakdown follows a peer RS sell signal on 5/5, further technical weakness from a relative strength perspective. Support now lies at $140, while additional can be found in the lower $130s. |
| NET Cloudflare Inc Class A ($187.55) - Internet - Shares of NET broke a spread triple bottom at $192 for its second consecutive sell signal. The 3 for 5'er lost near-term relative strength versus the market and its peers recently as it pulls back, but those with positions can continue to hold on given its long-term relative strength. The stock is currently right above its bullish support line at $184, but movement below there would take it into a negative trend and into sell territory. |
| TER Teradyne, Inc. ($356.41) - Semiconductors - Shares of TER fell on Tuesday, breaking a double bottom at $344 to move back to a sell signal. The 3 for 5'er has pulled back from its April highs, losing two attributes as it gave up some near-term relative strength. However, the stock continues to display long-term relative strength, and it still ranks in the top decile of the top 500 large cap matrix. Investors with existing TER positions should continue to hold on while those looking to add should wait on the sidelines for further improvement. From here, initial support lies at $340. |
| WSM Williams-Sonoma, Inc. ($176.25) - Retailing - WSM broke a double bottom at $174 for a second sell signal and to violate support that dates to December 2025. This breakdown continues technical deterioration in late April that saw the stock move into a negative trend and shift into Os on the market RS chart. WSM has also fallen into the bottom half of the Retailing sector matrix. Support lies at current chart levels as well as $172. A move to $170 would mark the lowest level for the stock since July 2025. |

| Name | Option Symbol | Action | Stop Loss |
|---|---|---|---|
| Bunge Limited - $126.21 | O: 26G125.00D17 | Buy the July 125.00 calls at 8.00 | 116.00 |
| Name | Option | Action |
|---|---|---|
| The Allstate Corporation ( ALL) | Jul. 210.00 Calls | Initiate an option stop loss of 10.00 (CP: 12.00) |
| J.P. Morgan Chase & Co. ( JPM) | Jul. 300.00 Calls | Initiate an option stop loss of 15.20 (CP: 17.20) |
| Name | Option Symbol | Action | Stop Loss |
|---|---|---|---|
| Open Text Corporation - $23.89 | O: 26S25.00D17 | Buy the July 25.00 puts at 2.45 | 27.00 |
| Name | Option | Action |
|---|---|---|
| Abbott Laboratories ( ABT) | Aug. 115.00 Puts | Stopped at 28.80 (CP: 28.40) |
| Cognizant Technology Solutions ( CTSH) | Sep. 62.50 Puts | Raise the option stop loss to 11.30 (CP: 13.30) |
| Accenture PLC ( ACN) | Aug. 200.00 Puts | Raise the option stop loss to 32.50 (CP: 34.50) |
| PDD Holdings Inc. ( PDD) | Jul. 100.00 Puts | Initiate an option stop loss of 6.75 (CP: 8.75) |
| Name | Option Sym. | Call to Sell | Call Price | Investment for 500 Shares | Annual Called Rtn. | Annual Static Rtn. | Downside Protection |
|---|---|---|---|---|---|---|---|
| Block Inc $ 73.17 | O: 26G75.00D17 | Jul. 75.00 | 4.10 | $ 35,547.65 | 41.46% | 26.69% | 4.60% |
| Name | Action |
|---|---|
| Palantir Technologies Inc. Class A ( PLTR) - 136.89 | Sell the July 150.00 Calls. |
| V.F. Corporation ( VFC) - 17.94 | Sell the August 22.00 Calls. |
| Delta Air Lines Inc. ( DAL) - 71.20 | Sell the July 72.50 Calls. |
| Starbucks Corporation ( SBUX) - 105.74 | Sell the September 110.00 Calls. |
| Citigroup, Inc. ( C) - 125.85 | Sell the July 130.00 Calls. |
| Amkor Technology, Inc. ( AMKR) - 76.69 | Sell the July 80.00 Calls. |
| On Semiconductor Corp. ( ON) - 107.24 | Sell the July 105.00 Calls. |
| eBay Inc. ( EBAY) - 108.13 | Sell the July 110.00 Calls. |
| Name | Covered Write |
|---|---|
| Synchrony Financial ( SYF - 70.28 ) | September 72.50 covered write. |
Daily Equity & Market Analysis
Loading, Please Wait...
