Most Requested Symbols

Energy focused moved into the 2nd position within the DALI rankings. We cover what that might mean for you and what charts you need to be watching as we move through March
The continued downside and technical deterioration witnessed in indices and stocks last week have begun to show within the intermediate to long-term indicators like the bullish percents and positive trend indicators.
Weekly Rundown Video – Mar 4, 2026
Weekly rundown with NDW analyst team covering all major asset classes.
Weekly rundown with NDW analyst team covering all major asset classes.
Recent events have ushered in lots of price movement worth watching… and perhaps more importantly said price action has stemmed from parts of the markets that have been dormant for quite some time. As usual, unrest in the middle east has sent energy prices skyrocketing, seeing the price of crude climb over $100 (even hitting nearly $120 over the weekend) for the first time since 2022. This comes after the last three years have seen little to no sustained upside action for any parts of the larger energy complex, with many representatives having traded largely sideways since the start of 2023’s bull market. Of course, the rapid movement of energy’s upside has led to some notable changes in relative strength… changes we will discuss in more detail today.

The largest change on the platform most of you will see is Commodities overtaking Domestic Equites for second place within the overall broad rankings within DALI. The move marks the first instance of domestic equites sitting outside the top two rankings since June of last year when international equites, commodities (largely precious metals) and domestic equities were all vowing for the top spot. The three-way battle for first was ultimately reclaimed by domestic equities… but the move served as a reminder for technical strength outside of the core domestic space. It is worth mentioning that despite domestic equites moving lower, the top three asset classes remain relatively risk-on, while other areas like fixed income and cash have yet to see notable upticks. A general rule of thumb for those of you looking to make broader allocation changes based on the change- wait to see if this shift is “legitimate.” Take last summer’s brief bounce in top three leadership positioning as a lesson that those of you too quick to make changes can be quickly punished… especially when moving out of domestic equites which many of you benchmark to.
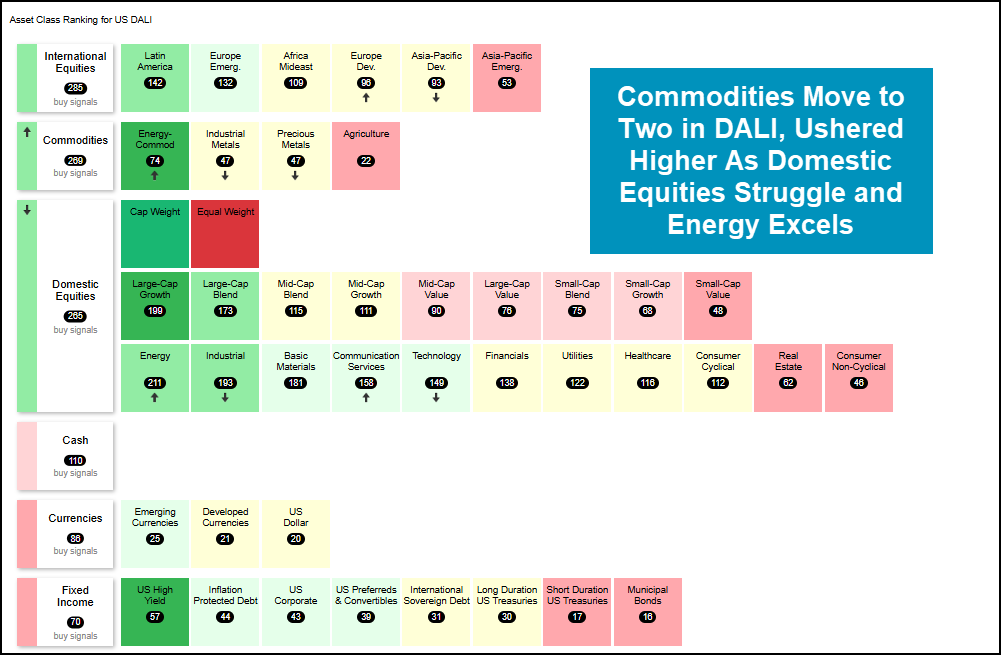
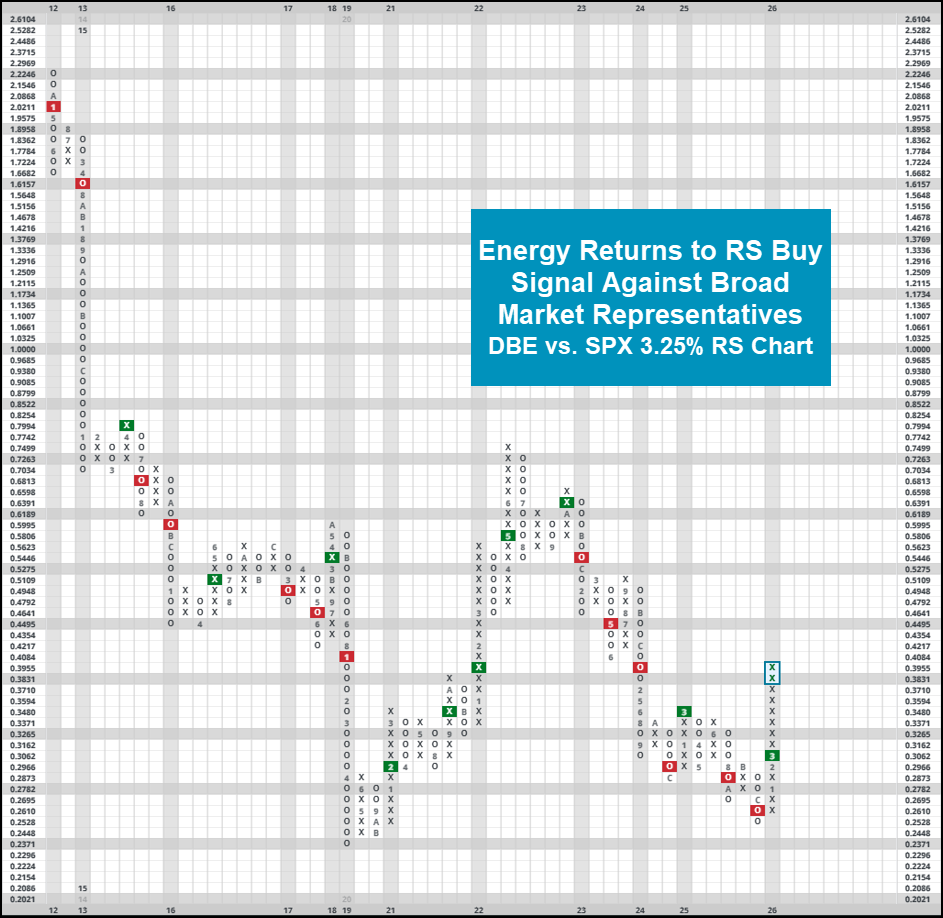
For the uninitiated, DALI is a matrix based ranking system that throws together several representatives against each other to see which members are relatively strongest. While the exact breakdown of DALI constituents is proprietary to NDW, we take care in updating/monitoring the universe to ensure every group is represented fairly. Outside of our matrix-based system, there have been several relevant relative strength relationships that have shifted in favor of energy options over the last week. Invesco Energy representative DBE (up ~50% this year) most recently returned to a buy signal against SPX, SPXEWI & NDX since the start of March. DBO (oil) & DBC (broad commodities] have seen similar RS rotations. While the shifts are certainly is quite notable, it is important to highlight the overbought nature of many of these representatives. The near 200% weekly OBOS for DBE is one of the highest readings ever, and many energy representatives sit without relevant support on their default charts for quite some way.
All of this to say, continue to exercise caution on the equity front. The drop down out of the top two positions in DALI is quite notable, but rapidly cutting domestic equity exposure in exchange for an overbought commodity space certainly carries risk. Regardless, the drop in relative strength does suggest we could continue to see volatility as we wrap up Q1 2026, so keep an eye on the charts.

Friday’s (3/6) trading capped off a second week of negative action for most U.S. equity indices. The S&P 500 Index (SPX) fell over 2% last week (2/27 – 3/6), dropping the index into negative territory on a year-to-date basis, down 1.5%. Similar action transpired for the Russell 1000 (RUI), down 2% last week, and the Dow Jones Industrial Average (.DJIA), down 3%, bringing both into negative territory on a year-to-date basis. Even after falling more than 3% and 4% last week the S&P 500 Equal Weight Index (SPXEWI) and Russell 2000 (RUT) are the only indices that maintain positive year-to-date performance (through 3/6).

The continued downside and technical deterioration witnessed in indices and stocks last week have begun to show within the intermediate to long-term indicators like the bullish percents and positive trend indicators. While other indicator universes also saw action, the primary focus today will be on those indicators within NYSE universe.
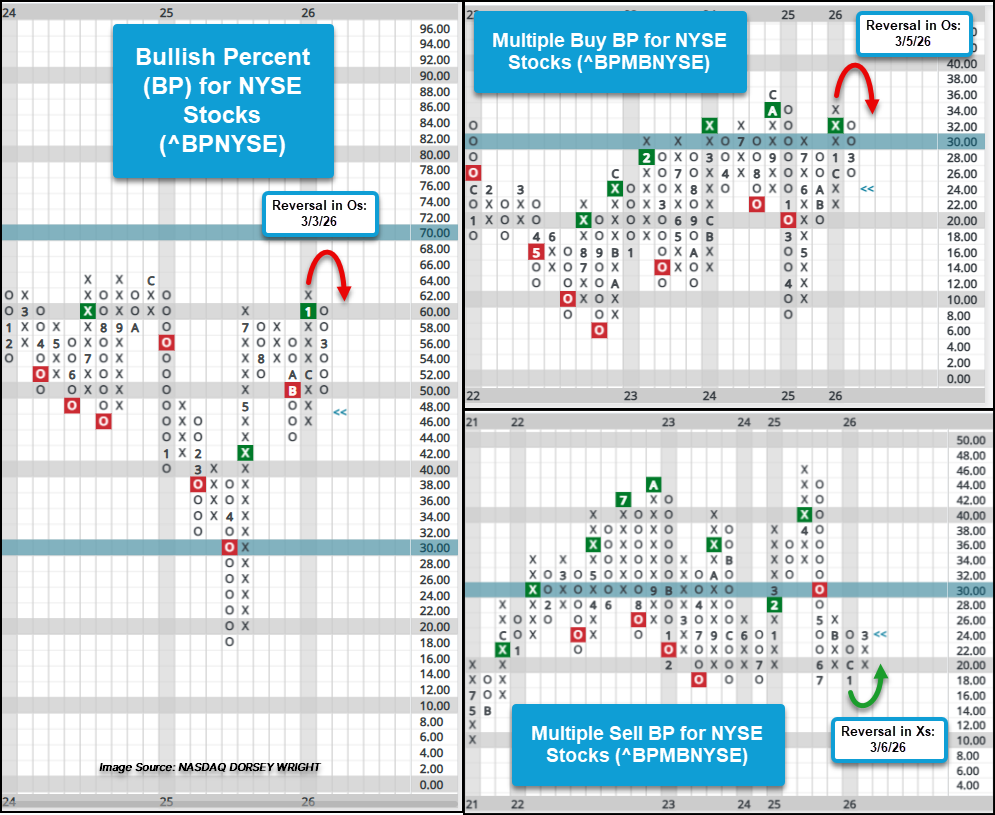
Likely the most notable indicator shift last week was the reversal down and move below 50% for the bullish percent for the NYSE (^BPNYSE). After reversing down from the January high mark of 62% to 54% following trading on Tuesday, March 3rd, Friday’s (3/6) trading brought the chart down to 50% with the actual indicator reading dipping below at 48.14%. This suggests that now less than half of the roughly 1800+ stocks maintain a point and figure buy signals.
Along with the bullish percent, which measures the percentage of stocks that have given a single point and figure buy signal, the multiple buy signal bullish percent for the NYSE (^BPMBNYSE) reversed into Os during last week’s trading. For those not familiar with the multiple buy indicators they measure the percentage of stocks that maintain two or more point and figure buy signals. The reversal down suggests that stocks that had even maintained a series of buy signals ended that string of buy signals with last week’s trading. Now less than 1 out of every 4 stocks that maintained consecutive buy signals continue to do so.
Last week’s trading brought about a reversal higher for the multiple buy signals bullish percent sibling indicator, the multiple sell signals BP for the NYSE. Rather than measuring the percentage of stocks maintaining two or more buy signals, the multiple sell signals BP measures the percentage of stocks that maintain two or more sell signals. The reversal higher to 24% on the chart and an actual reading of 25% suggests that 1 out of 4 stocks of the roughly 1800+ names within the NYSE universe maintain multiple sell signals.
The combination of all three aforementioned BPs seeing reversal highlights a notable shift in participation, impacting the intermediate-term outlook and noting a shift to a defensive posture.
While the longer-term positive trend indicator for the NYSE universe continues to maintain a column of Xs since mid-January at 62%, the reading for the indicator has fallen back to 54.48% as of Friday’s (3/6) close. This places the indicator within one box of reversing down into Os and suggests that along with seeing some stocks give consecutive sell signals, the downside action has been enough to shift trends to from positive to negative. Even with a potential reversal into Os in the offing, the long-term PT for the NYSE will maintain above the important 50% threshold. A move below 50% on the PTNYSE chart would indicate less than half of the stocks within the universe maintain a positive trend and would further a defensive posture for domestic equities.

Though intermediate and long-term technical indicators have seen movement lower, they are all considered to be in the “middle of the playing field” and have not quite reached a low, or washed out, level, indicating a full defensive posture shift to equity exposure. Short-term indicators like the 10-week (^TWNYSE) and weekly distribution (^WDNYSE) have fallen to their lowest levels since November of last year. The 10-week’s (^TWNYSE) current chart reading of 42% as of Friday’s (3/6) suggests roughly four out of every 10 stocks maintain above their 50-day moving average, which is above the October and November 2025 chart lows at 32% and the April 2025 lows of 4% (last visit to “washed out” territory).
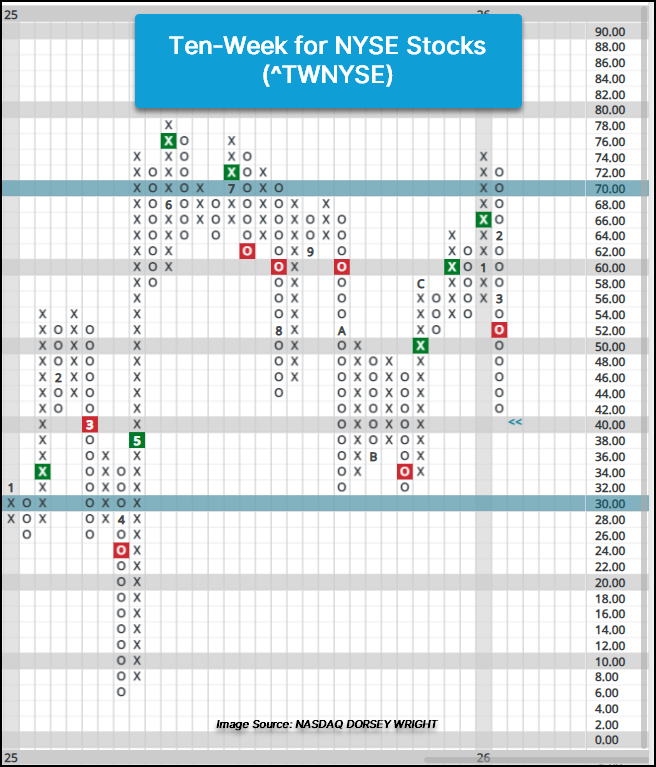
The weekly distribution indicator for the NYSE universe (^WDNYSE), which measures the average overbought/oversold reading, has fallen to oversold territory at -10%. This is well above the November and April 2025 chart lows of -28% and -78% oversold and helps provide context to how investors may approach U.S. equity exposure.
The recent downturn in the indicators provides a call to action to evaluate U.S. equity exposure, and should a position be seeing sell signals and violations of key support or long-term trendlines it may warrant lightening up on exposure or selling, depending on the level of technical deterioration. For positions that may not have witnessed the level of technical deterioration like those that have contributed to indicators moving lower, NDW users should look at the alerts system for either technical breakdown or price alerts for positions that may be closely monitored.

Average Level
-6.19
| < - -100 | -100 - -80 | -80 - -60 | -60 - -40 | -40 - -20 | -20 - 0 | 0 - 20 | 20 - 40 | 40 - 60 | 60 - 80 | 80 - 100 | 100 - > |
|---|---|---|---|---|---|---|---|---|---|---|---|
|
Buy signalfxe
|
|||||||||||
|
Buy signaldia
|
|||||||||||
|
Buy signalefa
|
Buy signaliwm
|
||||||||||
|
Buy signalXLG
|
Buy signalEEM
|
||||||||||
|
Buy signalshy
|
Buy signalQQQ
|
||||||||||
|
Sell signalVOOG
|
Sell signallqd
|
Buy signalVOOV
|
Buy signalief
|
||||||||
|
Sell signalONEQ
|
Buy signalijr
|
Buy signalagg
|
Sell signaltlt
|
Sell signaldx/y
|
Buy signalicf
|
Buy signalGSG
|
|||||
|
Buy signalhyg
|
Buy signalSPY
|
Buy signalIJH
|
Buy signalrsp
|
Buy signaldvy
|
Buy signalGLD
|
Buy signalgcc
|
Buy signalUSO
|
||||
| < - -100 | -100 - -80 | -80 - -60 | -60 - -40 | -40 - -20 | -20 - 0 | 0 - 20 | 20 - 40 | 40 - 60 | 60 - 80 | 80 - 100 | 100 - > |
| AGG | iShares US Core Bond ETF |
| USO | United States Oil Fund |
| DIA | SPDR Dow Jones Industrial Average ETF |
| DVY | iShares Dow Jones Select Dividend Index ETF |
| DX/Y | NYCE U.S.Dollar Index Spot |
| EFA | iShares MSCI EAFE ETF |
| FXE | Invesco CurrencyShares Euro Trust |
| GLD | SPDR Gold Trust |
| GSG | iShares S&P GSCI Commodity-Indexed Trust |
| HYG | iShares iBoxx $ High Yield Corporate Bond ETF |
| ICF | iShares Cohen & Steers Realty ETF |
| IEF | iShares Barclays 7-10 Yr. Tres. Bond ETF |
| LQD | iShares iBoxx $ Investment Grade Corp. Bond ETF |
| IJH | iShares S&P 400 MidCap Index Fund |
| ONEQ | Fidelity Nasdaq Composite Index Track |
| QQQ | Invesco QQQ Trust |
| RSP | Invesco S&P 500 Equal Weight ETF |
| IWM | iShares Russell 2000 Index ETF |
| SHY | iShares Barclays 1-3 Year Tres. Bond ETF |
| IJR | iShares S&P 600 SmallCap Index Fund |
| SPY | SPDR S&P 500 Index ETF Trust |
| TLT | iShares Barclays 20+ Year Treasury Bond ETF |
| GCC | WisdomTree Continuous Commodity Index Fund |
| VOOG | Vanguard S&P 500 Growth ETF |
| VOOV | Vanguard S&P 500 Value ETF |
| EEM | iShares MSCI Emerging Markets ETF |
| XLG | Invesco S&P 500 Top 50 ETF |

| Symbol | Company | Sector | Current Price | Action Price | Target | Stop | Notes |
|---|---|---|---|---|---|---|---|
| ABBV | AbbVie Inc. | Drugs | $230.11 | 210s - low 230s | 284 | 188 | 5 for 5'er, favored DRUG sector, LT pos peer & mkt RS, breakout from consec sell signals, 2.9% yield |
| AB | AllianceBernstein Holding LP | Wall Street | $37.91 | low 40s | 64 | 32 | 3 TA rating, LT mkt RS buy, LT pos trend, top 50% of WALL sector matrix, consec buy signals, buy-on-pullback, yield > 8% |
| ZWS | Zurn Elkay Water Solutions Corp. | Machinery and Tools | $47.39 | hi 40s - lo 50s | 95 | 42 | 5 TA rating, LT pos trend, LT mkt RS buy, consec buy signals, buy-on-pullback |
| CACI | CACI International Inc. | Computers | $616.00 | 570s - 600s | 672 | 528 | 5 for 5'er, top 25% of COMP sector matrix, LT pos mkt RS, triple top breakout |
| WBS | Webster Financial Corporation | Banks | $68.50 | hi 60s - low 70s | 91 | 58 | 4 for 5'er, top 25% of BANK sector matrix, one box from peer RS buy, buy on pullback, 2.2% yield |
| MCK | McKesson Corporation | Drugs | $919.26 | 396-hi 470s | 1304 | 752 | 5 TA rating, top 33% of DRUG sector matrix, LT RS buy, consec buy signals, buy-on-pullback |
| CGON | CG Oncology, Inc. | Biomedics/Genetics | $61.88 | hi 50s - low 60s | 80 | 50 | 5 for 5'er, 18 of 162 in BIOM sector matrix, bullish catapult, good R-R, Earn. 3/26 |
| AZN | Astrazeneca Group PLC Ads (United Kingdom) ADR | Drugs | $194.22 | mid 180s - upper 190s | 236 | 160 | 4 for 5'er, top 25% of DRUG sector matrix, LT pos peer RS, one box from mkt RS buy, bullish triangle |
| Symbol | Company | Sector | Current Price | Action Price | Target | Stop | Notes |
|---|---|---|---|---|---|---|---|
| CPRT | Copart Incorporated | Autos and Parts | $37.74 | hi 30s | 28 | 42 | 1 TA rating, bottom 50% of AUTO sector matrix, NT and mkt RS sell last month, consec sell signals |
| Symbol | Company | Sector | Current Price | Action Price | Target | Stop | Notes |
|---|---|---|---|---|---|---|---|
| PKG | Packaging Corp of America | Forest Prods/Paper | $222.52 | hi 200s - mid 230s | 358 | 184 | PKG has fallen to a sell signal OK to hold here. Maintain $184 stop. |
| CAKE | The Cheesecake Factory Incorporated | Restaurants | $61.71 | low-to-mid 60s | 96 | 52 | CAKE has fallen to a sell signal. OK to hold here. Raise stop to $54. |
| Comment | |||||||
|---|---|---|---|---|---|---|---|
|
|
|||||||
AZN Astrazeneca Group PLC Ads R (United Kingdom) ADR ($193.24) - Drugs - AZN is a 4 for 5'er that ranks in the top quartile of the of the drugs sector matrix and has been on a peer RS buy signal since 2019; the stock also sits one box away from giving a market RS buy signal which would promote it to a 5 for 5'er. On its default chart, AZN has given two consecutive buy signals, most recently completing a bullish triangle at $194 last month. AZN has subsequently pulled back into its prior consolidation range, just below the middle of its trading, offering an entry point for long exposure. Positions may be added in the mid $180s to upper $190s s and we will set our initial stop at $160, which would take out multiple levels of support on AZN's chart and violate its trend line. We will use the bullish price objective, $236, as our target price. AZN also carries a 1.7% yield.
| 26 | |||||||||||||||||||||||||||||
| 212.00 | X | 212.00 | |||||||||||||||||||||||||||
| 208.00 | X | O | 208.00 | ||||||||||||||||||||||||||
| 204.00 | X | O | 204.00 | ||||||||||||||||||||||||||
| 200.00 | X | 3 | 200.00 | ||||||||||||||||||||||||||
| 198.00 | X | O | 198.00 | ||||||||||||||||||||||||||
| 196.00 | X | O | 196.00 | ||||||||||||||||||||||||||
| 194.00 | X | X | O | 194.00 | |||||||||||||||||||||||||
| 192.00 | X | X | O | X | X | Mid | 192.00 | ||||||||||||||||||||||
| 190.00 | X | O | X | X | O | 2 | O | X | 190.00 | ||||||||||||||||||||
| 188.00 | X | X | O | X | O | X | O | X | O | X | 188.00 | ||||||||||||||||||
| 186.00 | X | O | X | X | O | X | O | X | O | X | O | X | 186.00 | ||||||||||||||||
| 184.00 | X | O | X | O | X | O | O | X | O | X | O | 184.00 | |||||||||||||||||
| 182.00 | X | C | X | O | 1 | O | X | O | X | 182.00 | |||||||||||||||||||
| 180.00 | X | O | X | O | X | O | X | O | X | 180.00 | |||||||||||||||||||
| 178.00 | X | O | X | O | X | O | X | O | 178.00 | ||||||||||||||||||||
| 176.00 | X | O | O | O | X | • | 176.00 | ||||||||||||||||||||||
| 174.00 | X | X | O | • | 174.00 | ||||||||||||||||||||||||
| 172.00 | X | O | X | • | 172.00 | ||||||||||||||||||||||||
| 170.00 | X | O | X | • | 170.00 | ||||||||||||||||||||||||
| 168.00 | X | O | X | • | 168.00 | ||||||||||||||||||||||||
| 166.00 | X | O | X | • | 166.00 | ||||||||||||||||||||||||
| 164.00 | 9 | X | O | X | • | 164.00 | |||||||||||||||||||||||
| 162.00 | X | O | X | B | • | 162.00 | |||||||||||||||||||||||
| 160.00 | X | O | X | • | Bot | 160.00 | |||||||||||||||||||||||
| 158.00 | X | O | X | • | 158.00 | ||||||||||||||||||||||||
| 156.00 | X | O | X | • | 156.00 | ||||||||||||||||||||||||
| 154.00 | X | X | O | A | • | 154.00 | |||||||||||||||||||||||
| 152.00 | X | O | X | O | X | • | 152.00 | ||||||||||||||||||||||
| 150.00 | X | O | X | X | O | X | • | 150.00 | |||||||||||||||||||||
| 148.00 | • | X | O | X | O | X | O | • | 148.00 | ||||||||||||||||||||
| 146.00 | X | • | • | X | 8 | X | O | X | • | 146.00 | |||||||||||||||||||
| 144.00 | X | O | X | • | X | O | X | O | X | • | 144.00 | ||||||||||||||||||
| 142.00 | X | O | X | O | X | O | • | O | • | 142.00 | |||||||||||||||||||
| 140.00 | • | O | X | O | X | • | • | 140.00 | |||||||||||||||||||||
| 138.00 | 7 | X | O | • | 138.00 | ||||||||||||||||||||||||
| 136.00 | O | • | • | 136.00 | |||||||||||||||||||||||||
| 26 |
| AAP Advance Auto Parts, Inc. ($50.73) - Autos and Parts - AAP broke a double bottom at $49 for a second sell signal since the February rally high at $65. The stock continues to maintain a 5 technical attribute rating and ranks within the top half of the Autos and Parts sector matrix. From here, support now lies at $47, the bullish support line, as well as at $40 and $38. |
| CC The Chemours Company ($17.19) - Chemicals - CC fell to a sell signal Monday when it broke a double bottom at $16.50 and continued lower to $15.50. The outlook for the stock remains favorable as CC is a 4 for 5'er that ranks in the top quintile of the chemicals sector matrix. From here, the next level of support sits at $14.50. |
| HUM Humana Inc. ($178.01) - Healthcare - HUM inched lower to complete a double bottom break at $176, marking its third consecutive sell signal. The 0 for 5'er lost two signals in January after moving into a negative trend and reversing back into a sell signal against its peers. Additionally, the stock ranks near the bottom of the healthcare sector matrix. The weekly OBOS indicates that the stock is in oversold territory, so wait for a normalization of the 10-week trading band before selling your position. Initial resistance can be seen at $184, with additional resistance at $192. |
| IHG InterContinental Hotels Group plc (United Kingdom) ADR ($129.79) - Leisure - IHG broke a double bottom at $128 for a second sell signal since peaking at $150 in February. The stock continues to maintain a 5 technical attribute rating and ranks within the top half of the Leisure sector matrix. From here, support lies at $126, while additional can be found at $118. |
| JBHT J.B. Hunt Transport Services, Inc. ($215.60) - Transports/Non Air - Quite an interesting technical setup for JBHT with todays action. On one hand, the stock fell below the middle of the trading band and posted its first sell signal of 2026. On the other, the signal is setting up for a possible bullish shakeout pattern on its default chart, which you should watch out for at $220. Transports have picked up quite nicely recently, so having a list of possible ideas is probably a decent idea as we move into March. Depending on your risk tolerance, JBHT could be on that list with a positive reversal here. |
| MMM 3M Company ($152.39) - Chemicals - MMM fell to a sell signal and a negative trend Monday when it broke a double bottom at $150 and continued lower taking out additional support when it hit $148. The negative trend change will drop MMM to a 1 for 5'er. From here, the next level of support sits at $146. |
| SPG Simon Property Group, Inc. ($188.64) - Real Estate - Shares of SPG broke a double bottom at $190, ending its streak of three consecutive buy signals. The 5 for 5'er is still one to own but investors should watch for a potential move to a negative trend with it now testing the bullish support line. After that, further support starts at $182. |
| USAU U.S. Gold Corp ($17.57) - Precious Metals - USAU fell to a sell signal and a negative trend Monday when it broke a double bottom at $17. The negative trend change will drop the stock to unfavorable 2 5 for 5'er and USAU ranks in near the bottom of the precious metals sector matrix. From here, the next level of support sits at $15.50. |

| Name | Option Symbol | Action | Stop Loss |
|---|---|---|---|
| eBay Inc. - $92.73 | O: 26E92.50D15 | Buy the May 92.50 calls at 7.75 | 85.00 |
| Name | Option | Action |
|---|---|---|
|
|
||
| Name | Option Symbol | Action | Stop Loss |
|---|---|---|---|
| Enphase Energy Inc - $40.96 | O: 26Q40.00D15 | Buy the May 40.00 puts at 4.95 | 46.00 |
| Name | Option | Action |
|---|---|---|
| MetLife, Inc. ( MET) | Apr. 77.50 Puts | Raise the option stop loss to 5.00 (CP: 7.00) |
| ARM Holdings PLC ADR ( ARM) | Apr. 130.00 Puts | Stopped at 16.35 (CP: 15.75) |
| CBRE Group, Inc. ( CBRE) | Apr. 145.00 Puts | Raise the option stop loss to 8.40 (CP: 10.40) |
| Name | Option Sym. | Call to Sell | Call Price | Investment for 500 Shares | Annual Called Rtn. | Annual Static Rtn. | Downside Protection |
|---|---|---|---|---|---|---|---|
| Iron Mountain Inc. $ 105.18 | O: 26G110.00D17 | Jul. 110.00 | 8.30 | $ 49,926.50 | 32.53% | 25.61% | 6.68% |
| Name | Action |
|---|---|
| Intel Corporation ( INTC) - 43.42 | Sell the May 49.00 Calls. |
| Freeport-McMoRan Inc. ( FCX) - 59.36 | Sell the June 65.00 Calls. |
| Micron Technology, Inc. ( MU) - 370.30 | Sell the June 420.00 Calls. |
| Moderna, Inc. ( MRNA) - 52.52 | Sell the April 55.00 Calls. |
| Cameco Corporation ( CCJ) - 109.68 | Sell the April 120.00 Calls. |
| Invesco PLC ( IVZ) - 23.67 | Sell the April 24.00 Calls. |
| Name | Covered Write |
|---|---|
|
|
|
Daily Equity & Market Analysis
LISTEN TO PODCAST
Apr 09, 2026
Loading, Please Wait...
