Most Requested Symbols

As if markets didn't have enough to think about, earnings season is getting going with a slew of big banks reporting this week. We talk about the technical picture of financials in today's report.
Like produce in a supermarket, sectors rotate in and out of favor, and the first quarter saw lots of rotation. Given the movement, how do things currently stack up?
Weekly Rundown Video – April 8, 2026
Weekly rundown with NDW analyst team covering all major asset classes.
Weekly rundown with NDW analyst team covering all major asset classes.
Just like that, its earnings season again. As we do every quarter, markets ring in earnings season with a handful of household names, most hailing from the financials sector. While we will root for positive results from every company, more seems to lie in the balance when it comes to the big banks. After all, productive quarters for big financial companies typically signal robust economic growth/actively over the preceding quarter, a strong sign for the broader economy. All that to say, keeping tabs on what price action might be telling us about this group ahead of their earnings report can pay dividends down the line.
We will start first by showing you how to access NDW’s “earnings tracker” via our premade database reports. By going to the screener (“Old” or “new” version) you can navigate to database reports and scroll down to the “Stocks with Earnings Releases” tab. From there, you are able to organize stocks based on their next published earnings date. We also include a handful of other information, like that stock’s sector or TA score to help guide you around earnings related plays in your portfolio. Remember, earnings are one of the most common ways in which the fundamentals and technicals can collide, so having a gameplan in place around earnings related price movement is paramount.

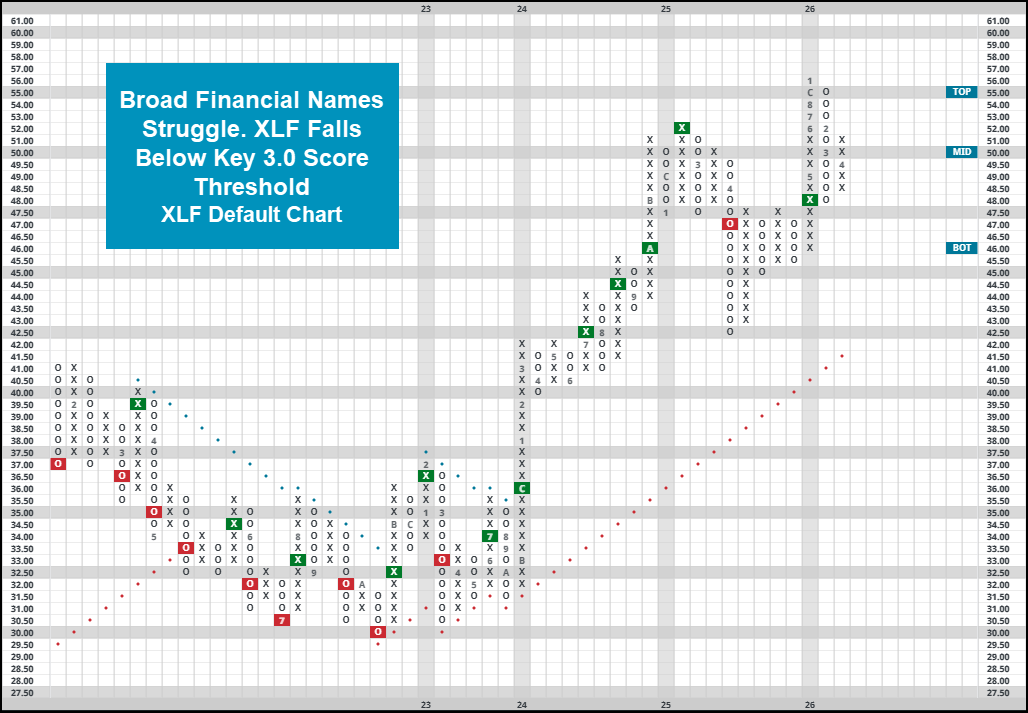
Financials have struggled mightily this year. Even after the ceasefire in the Middle East provided some relief for major markets, financial representative XLF remains the worst performing sector so far in 2026. Having fallen over 7% so far this year, XLF has seen its fund score drop below a 3.0 fund score as technical weakness has emerged. This has coincided with a decrease in relative strength against other sectors as financials has fallen from as high as the first position to the seventh position over the last few months. All that to say, the sector has certainly fallen far enough in the rankings that the average investor need to be wary with exposure to the group.
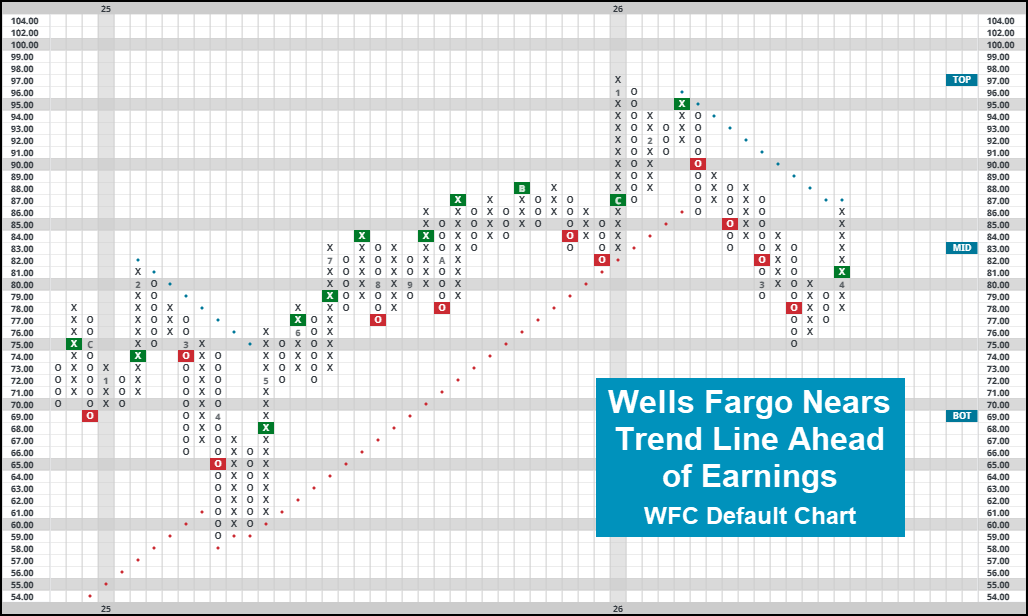
Large bank names reporting this week include the likes of Goldman Sachs (GS), JP Morgan Chase (JPM), Wells Fargo (WFC), Citigroup (C), Blackrock (BLK), Bank of America (BAC) and Morgan Stanley (MS). They join the likes of Johnson & Johnson (JNJ Netflix (NFLX) Taiwan Semiconductor (TSM) and several other insurance names to open up the first week. GS reported this morning (4/13), falling as much as 4.5% in the morning before rallying alongside broader markets throughout the day. Like many of the names reporting this week, the technical picture of GS remains largely defendable. The stock is a 5/5’er, and even after the decline on 4/13 it has maintained a string of higher lowers since last August. Many other options have very similar technical pictures as they move into earnings. JPM, C, and BAC maintain technically acceptable TA scores to open up Q2. Wells Fargo is the lowest rated option heading into its earnings call, earning a poor 2/5 technical attributes as it tests its negative trend line. While there is still plenty of resistance in the upper-$80’s, further upside action could lead to a change in trend as the name attempts to get back to even on the year.
Remember, unlocking the full picture of any investment includes judging the technicals and the fundamentals of a security. Earnings can be a valuable opportunity to look behind the curtain from a fundamental perspective but can certainly impact price action that will affect NDW’s view from a purely technical vantage point. Best practices around earnings will be to identify notable support and resistance points that names could drift towards after results. From there, set alerts to be notified of large price action that would be considered more than just “noise”.

Nothing is constant except change, and the stock market is no exception. Like produce in a supermarket, areas rotate in and out of favor. Unfortunately, investors’ favorite areas are off to a slow start so far this year, with weakness concentrated in sectors that lifted the market higher in previous years. Risk-on groups such as technology, communication services, consumer discretionary are underperforming the market in 2026. However, what keeps bull markets alive is when new areas of strength emerge as others begin to falter. While growth-focused areas have stumbled out of the gate, other sectors have stepped up this year to fill the void.
For context, S&P 500 fund SPY is negative on the year, yet the majority of major sectors have gained at least 5% so far, underscoring broader market upside. Energy has led the way to the upside, with SDPR sector fund XLE gaining almost 30% YTD. Meanwhile, other old‑economy sectors such as basic materials (XLB), utilities (XLU), and industrials (XLI) are also off to strong starts, each gaining more than 10%. Dragging down markets have been the aforementioned growth areas, in addition to financials and healthcare. Offsetting these gains, the aforementioned growth sectors—along with financials and healthcare—have weighed on the market.

The culmination of these performances have resulted in significant changes in relative strength rankings. Technology fell from first to fourth, while communication services slipped to third. Meanwhile, old-economy areas flourished, with industrials rising to second and energy gaining eight ranks to claim the top spot. Utilities also advanced two positions. Lastly, financials and cyclicals lost ground, falling two and three spots, respectively.

When evaluating the strength of a group or security, NDW places primary emphasis on long‑term strength. However, short-term strength can often be an indication of where long-term strength may be headed. DALI rankings are based on a group’s long‑term RS Buy Signal tally, but short‑term strength can also be assessed by summing the RS column of Xs across a group's constituents. Doing so provides a view into which sectors might be primed for further strengthening or weakening.
Examining near‑term strength across major sectors reveals several notable deviations from their long‑term profiles. Utilities and basic materials stand out as sectors on the rise. Excluding energy, these have been the best‑performing sectors this year, despite uneven paths. Basic materials entered the year strong, rising as high as second in DALI before losing momentum as metal companies weakened, falling to sixth. However, precious metal miners have rebounded alongside the broader market, allowing basic materials to regain near-term strength. Meanwhile, utilities got off to a hot start until declining equities and rising rates in March temporarily derailed its gains. Both sectors sit slightly above average in long‑term strength, but their placement in the top‑right quadrant alongside technology, communication services, and industrials is encouraging.

By contrast, the energy sector shows the weakest near‑term relative strength among top‑half DALI sectors, despite ranking first overall. While the group put together a herculean first quarter, XLE has since fallen almost 10% from its highs, nearly entering correction territory. In fact, energy now sits farther from all‑time highs than any other major sector. Energy initially benefited from rising oil prices but has since declined alongside the commodity, with further oil weakness posing a potential headwind. Negative action saw XLE lose its near-term market relative strength last week. Investors seeking energy exposure at this stage may prefer less crude‑dependent areas such as oil‑services (IEZ) or clean energy (PBW, QCLN), especially as they display equivalent or higher levels of strength than other energy areas.

While a group with more near-term strength is more likely to rise in DALI, there’s no guarantee it will do so. Basic materials exhibited some of the most near-term strength of any group entering the first quarter and followed through up with a strong few months. However, healthcare entered the year with similar near-term strength, yet XLV is down more than 5% from the start of the year, serving as a reminder that momentum can fade if not sustained. Conversely, a lack of near‑term strength in a leading group such as energy is not a death sentence, even though it may serve as an early warning sign.
Average Level
5.47
| < - -100 | -100 - -80 | -80 - -60 | -60 - -40 | -40 - -20 | -20 - 0 | 0 - 20 | 20 - 40 | 40 - 60 | 60 - 80 | 80 - 100 | 100 - > |
|---|---|---|---|---|---|---|---|---|---|---|---|
|
Sell signalXLG
|
|||||||||||
|
Buy signalSPY
|
|||||||||||
|
Buy signalIJH
|
|||||||||||
|
Buy signalgld
|
Buy signalEEM
|
||||||||||
|
Buy signalrsp
|
Buy signalfxe
|
||||||||||
|
Buy signalhyg
|
Buy signalefa
|
||||||||||
|
Sell signalief
|
Buy signalVOOV
|
Sell signalVOOG
|
|||||||||
|
Buy signaltlt
|
Buy signaldvy
|
Buy signaliwm
|
Buy signalGSG
|
||||||||
|
Sell signalagg
|
Buy signaldx/y
|
Sell signalONEQ
|
Buy signalijr
|
Buy signalGCC
|
|||||||
|
Buy signalshy
|
Sell signallqd
|
Sell signaldia
|
Sell signalQQQ
|
Buy signalicf
|
Sell signalUSO
|
||||||
| < - -100 | -100 - -80 | -80 - -60 | -60 - -40 | -40 - -20 | -20 - 0 | 0 - 20 | 20 - 40 | 40 - 60 | 60 - 80 | 80 - 100 | 100 - > |
| AGG | iShares US Core Bond ETF |
| USO | United States Oil Fund |
| DIA | SPDR Dow Jones Industrial Average ETF |
| DVY | iShares Dow Jones Select Dividend Index ETF |
| DX/Y | NYCE U.S.Dollar Index Spot |
| EFA | iShares MSCI EAFE ETF |
| FXE | Invesco CurrencyShares Euro Trust |
| GLD | SPDR Gold Trust |
| GSG | iShares S&P GSCI Commodity-Indexed Trust |
| HYG | iShares iBoxx $ High Yield Corporate Bond ETF |
| ICF | iShares Cohen & Steers Realty ETF |
| IEF | iShares Barclays 7-10 Yr. Tres. Bond ETF |
| LQD | iShares iBoxx $ Investment Grade Corp. Bond ETF |
| IJH | iShares S&P 400 MidCap Index Fund |
| ONEQ | Fidelity Nasdaq Composite Index Track |
| QQQ | Invesco QQQ Trust |
| RSP | Invesco S&P 500 Equal Weight ETF |
| IWM | iShares Russell 2000 Index ETF |
| SHY | iShares Barclays 1-3 Year Tres. Bond ETF |
| IJR | iShares S&P 600 SmallCap Index Fund |
| SPY | SPDR S&P 500 Index ETF Trust |
| TLT | iShares Barclays 20+ Year Treasury Bond ETF |
| GCC | WisdomTree Continuous Commodity Index Fund |
| VOOG | Vanguard S&P 500 Growth ETF |
| VOOV | Vanguard S&P 500 Value ETF |
| EEM | iShares MSCI Emerging Markets ETF |
| XLG | Invesco S&P 500 Top 50 ETF |

| Symbol | Company | Sector | Current Price | Action Price | Target | Stop | Notes |
|---|---|---|---|---|---|---|---|
| WBS | Webster Financial Corporation | Banks | $71.78 | hi 60s - low 70s | 91 | 58 | 4 for 5'er, top 25% of BANK sector matrix, one box from peer RS buy, buy on pullback, 2.2% yield, Earn. 4/28 |
| CGON | CG Oncology, Inc. | Biomedics/Genetics | $67.70 | hi 50s - low 60s | 80 | 50 | 5 for 5'er, 18 of 162 in BIOM sector matrix, bullish catapult, good R-R, Earn. 5/7 |
| CNX | CNX Resources Corp | Oil | $39.28 | hi 30s - mid 40s | 71 | 33 | 5 TA rating, top 50% of OIL sector matrix, LT RS buy and pos trend, consec buy signals, Earn. 4/30 |
| FFIV | F5 Inc. | Internet | $289.81 | 280s - 290s | 344 | 256 | 4 for 5'er, top third of INET sector matrix, LT pos peer RS, spread quad top, Earn. 4/28 |
| INVA | Innoviva, Inc | Drugs | $23.76 | lo-mid 20s | 32.50 | 18.50 | 5 TA rating, top half of drugs sector RS matrix, LT pos trend, LT RS buy, buy-on-pullback, Earn. 5/6 |
| ARCB | ArcBest Corp. | Transports/Non Air | $108.48 | low-to-mid 90s | 113 | 79 | 4 for 5'er, one box from market RS buy, top half of favored TRAN sector matrix, good R-R, Earn. 4/28 |
| GSK | GlaxoSmithKline Plc. (United Kingdom) ADR | Drugs | $58.21 | hi 40s - mid 50s | 67 | 42 | 5 TA rating, top 25% of DRUG sector matrix, LT pos trend, yield > 3%, buy-on-pullback, Earn. 4/29 |
| ADI | Analog Devices, Inc. | Semiconductors | $350.14 | 310s - 330s | 380 | 268 | 4 for 5'er, top half of favored SEMI sector matrix, LT pos market RS, return to buy signal |
| CSCO | Cisco Systems, Inc. | Computers | $82.22 | Upper 70s to lower 80s | 96 | 70 | 5 for 5'er; top quintile of Computers matrix; Pos. Trend since Sept. '24; Bull Triangle on 3/25. |
| CAT | Caterpillar, Inc. | Machinery and Tools | $790.66 | 680s - 720s | 848 | 592 | 5 for 5'er, top 10% in favored MACH sector matrix, LT pos peer & mkt RS, buy on pullback, Earn. 4/30 |
| DBD | Diebold Nixdorf Inc | Finance | $84.78 | low-to-mid 70s | 99 | 63 | 5 for 5'er, #3 of 77 in FINA sector matrix, LT pos peer RS, bearish signal reversal, R-R>2.0, Earn. 4/30/b> |
| NI | Nisource, Inc. | Gas Utilities | $48.05 | mid-hi 40s | 78 | 38 | 5 TA rating, LT pos trend, LT mkt RS buy, consec buy signals, Earn. 5/6 |
| FHI | Federated Hermes Inc | Wall Street | $55.27 | 54-hi 50s | 91 | 46 | 5 TA rating, top 25% of WALL sector RS matrix, LT pos trend and mkt RS buy, consec buy signals, good R-R, Earn. 4/30 |
| CRS | Carpenter Technology Corporation | Steel/Iron | $435.30 | hi 370s - low 400s | 500 | 320 | 5 for 5'er, top third of STEE sector matrix, LT pos peer & mkt RS, spread quintuple top, buy on pullback, Earn. 4/29 |
| COST | Costco Wholesale Corporation | Retailing | $998.47 | 944-1050s | 1296 | 832 | 4 TA rating, top 33% of retail sector matrix, LT mkt RS buy, LT pos trend, consec buy signals |
| ATRO | Astronics Corp | Aerospace Airline | $72.49 | hi 60s - mid 70s | 90 | 59 | 5 for 5'er, top 20% of AERO sector matrix, bearish signal reversal to spread triple top |
| BURL | Burlington Stores, Inc. | Retailing | $333.73 | mid 320s to 340s | 400 | 284 | 5 for 5'er; top quintile of Retail matrix; Multi-Yr High on 4/9; R-R > 4. |
| AMG | Affiliated Managers Group | Wall Street | $285.36 | 270s - 280s | 356 | 232 | 5 for 5'er, top third of WALL sector matrix, LT pos peer RS, spread triple top, Earn. 5/7 |
| ATI | ATI Inc. | Aerospace Airline | $162.21 | 150s - mid 160s | 192 | 134 | 5 for 5'er, top 10% of favored AERO sector matrix, LT pos peer & mkt RS, bullish catapult, Earn. 4/30 |
| Symbol | Company | Sector | Current Price | Action Price | Target | Stop | Notes |
|---|---|---|---|---|---|---|---|
| CPRT | Copart Incorporated | Autos and Parts | $32.76 | hi 30s | 28 | 42 | 1 TA rating, bottom 50% of AUTO sector matrix, NT and mkt RS sell last month, consec sell signals |
| Symbol | Company | Sector | Current Price | Action Price | Target | Stop | Notes |
|---|---|---|---|---|---|---|---|
| BRX | Brixmor Property Group Inc | Real Estate | $29.71 | hi 20s - lo 30s | 38 | 24 | Removed for earnings.Earn. 4/27 |
| Comment | |||||||
|---|---|---|---|---|---|---|---|
|
|
|||||||
ATI ATI Inc. ($162.21) - Aerospace Airline - ATI is a 5 for 5'er that ranks in the top decile of the favored aerospace/airline sector matrix and has been on peer and market RS buy signals since 2020. After giving three consecutive sell signals, ATI returned to a buy signal when it broke a triple top at $154 and gave a second consecutive buy signal last week when it completed a bullish catapult at $156. Long exposure may be added in $150s to mid $160s and we will set our initial stop at $134, which would take out two levels of support on ATI's default chart. We will use the bullish price objective, $192, as our target price.
| 26 | |||||||||||||||||||||||||||||
| 168.00 | X | 168.00 | |||||||||||||||||||||||||||
| 166.00 | X | O | 166.00 | ||||||||||||||||||||||||||
| 164.00 | X | 3 | O | 164.00 | |||||||||||||||||||||||||
| 162.00 | X | O | X | O | X | X | 162.00 | ||||||||||||||||||||||
| 160.00 | X | O | X | O | X | O | X | 160.00 | |||||||||||||||||||||
| 158.00 | X | O | O | X | O | X | 158.00 | ||||||||||||||||||||||
| 156.00 | X | O | X | O | X | 156.00 | |||||||||||||||||||||||
| 154.00 | X | O | X | O | X | X | 154.00 | ||||||||||||||||||||||
| 152.00 | X | O | X | O | X | X | X | O | X | 152.00 | |||||||||||||||||||
| 150.00 | X | O | X | O | X | O | X | O | X | O | X | 150.00 | |||||||||||||||||
| 148.00 | X | O | O | X | O | X | O | 4 | O | X | Mid | 148.00 | |||||||||||||||||
| 146.00 | X | O | X | O | X | O | X | O | 146.00 | ||||||||||||||||||||
| 144.00 | X | O | X | O | X | O | X | 144.00 | |||||||||||||||||||||
| 142.00 | X | O | X | O | X | O | X | 142.00 | |||||||||||||||||||||
| 140.00 | X | O | O | O | X | 140.00 | |||||||||||||||||||||||
| 138.00 | X | O | X | 138.00 | |||||||||||||||||||||||||
| 136.00 | X | X | O | 136.00 | |||||||||||||||||||||||||
| 134.00 | X | O | X | 134.00 | |||||||||||||||||||||||||
| 132.00 | X | O | X | 132.00 | |||||||||||||||||||||||||
| 130.00 | X | O | X | 130.00 | |||||||||||||||||||||||||
| 128.00 | X | O | X | 128.00 | |||||||||||||||||||||||||
| 126.00 | X | 2 | O | X | 126.00 | ||||||||||||||||||||||||
| 124.00 | X | O | X | O | 124.00 | ||||||||||||||||||||||||
| 122.00 | X | X | O | X | 122.00 | ||||||||||||||||||||||||
| 120.00 | X | O | X | O | X | 120.00 | |||||||||||||||||||||||
| 118.00 | 1 | O | X | O | 118.00 | ||||||||||||||||||||||||
| 116.00 | X | O | 116.00 | ||||||||||||||||||||||||||
| 114.00 | X | 114.00 | |||||||||||||||||||||||||||
| 112.00 | X | 112.00 | |||||||||||||||||||||||||||
| 110.00 | X | Bot | 110.00 | ||||||||||||||||||||||||||
| 108.00 | X | 108.00 | |||||||||||||||||||||||||||
| 106.00 | X | 106.00 | |||||||||||||||||||||||||||
| 104.00 | X | 104.00 | |||||||||||||||||||||||||||
| 102.00 | C | 102.00 | |||||||||||||||||||||||||||
| 100.00 | O | X | X | X | X | 100.00 | |||||||||||||||||||||||
| 99.00 | O | X | O | X | O | X | O | X | 99.00 | ||||||||||||||||||||
| 98.00 | O | X | O | X | O | X | O | X | 98.00 | ||||||||||||||||||||
| 97.00 | B | X | O | X | O | O | X | 97.00 | |||||||||||||||||||||
| 96.00 | O | X | O | O | X | 96.00 | |||||||||||||||||||||||
| 95.00 | O | X | O | X | 95.00 | ||||||||||||||||||||||||
| 94.00 | O | O | • | 94.00 | |||||||||||||||||||||||||
| 26 |
| ALB Albemarle Corp ($185.58) - Chemicals - ALB returned to a buy signal Monday when it broke a double top at $182. Monday's move adds to an already positive technical picture as ALB is a 5 for 5'er that ranks near the middle of the of the favored chemicals sector matrix. From here, the next level of resistance sits at $204. Meanwhile, support can be found at $172. ALB is expected to report earnings on 5/6. |
| DELL Dell Technologies Inc Class C ($187.74) - Computers - DELL pushed higher Monday to break a double top at $190, marking a second consecutive buy signal and new all-time high. This 5 for 5'er moved to a positive trend in February and sits near the top of the computers sector RS matrix. The weight of the technical evidence is favorable and continues to improve. However, DELL is entering overbought territory. Initial support can be seen at $178 with further support at $156. |
| DRI Darden Restaurants, Inc. ($189.79) - Restaurants - DRI broke a triple bottom at $190 for a second sell signal and to violate the bullish support line. The breakdown will shift the trend to negative and drop the stock down to a 3 for 5'er with positive attribution coming from mostly long-term RS buy signals versus the market and its peer group. Initial support now lies at $184, while additional lies in the low to mid $170s. |

| Name | Option Symbol | Action | Stop Loss |
|---|---|---|---|
| Advance Auto Parts, Inc. - $55.88 | O: 26I55.00D18 | Buy the September 55.00 calls at 9.70 | 50.00 |
| Name | Option | Action |
|---|---|---|
| Target Corporation ( TGT) | May. 115.00 Calls | Stopped at 8.00 (CP: 5.85) |
| Merck & Co., Inc. ( MRK) | Jun. 115.00 Calls | Stopped at 9.60 (CP: 8.50) |
| Darden Restaurants, Inc. ( DRI) | Jul. 200.00 Calls | Stopped at 190.00 (CP: 189.20) |
| Name | Option Symbol | Action | Stop Loss |
|---|---|---|---|
| SoFi Technologies Inc. - $16.89 | O: 26S17.00D17 | Buy the July 17.00 puts at 2.04 | 18.00 |
| Name | Option | Action |
|---|---|---|
| General Mills, Inc. ( GIS) | Apr. 45.00 Puts | Raise the option stop loss to 8.20 (CP: 10.20) |
| Abbott Laboratories ( ABT) | Aug. 115.00 Puts | Raise the option stop loss to 13.70 (CP: 15.70) |
| Apollo Global Management Inc. ( APO) | May. 115.00 Puts | Stopped at 10.20 (CP: 8.90) |
| T-Mobile US Inc. ( TMUS) | Jun. 210.00 Puts | Raise the option stop loss to 18.20 (CP: 20.20) |
| Salesforce Inc. ( CRM) | May. 185.00 Puts | Stopped at 19.60 (CP: 15.80) |
| Oracle Corporation ( ORCL) | Jul. 150.00 Puts | Stopped at 20.05 (CP: 14.80) |
| Name | Option Sym. | Call to Sell | Call Price | Investment for 500 Shares | Annual Called Rtn. | Annual Static Rtn. | Downside Protection |
|---|---|---|---|---|---|---|---|
| Frontline PLC $ 34.34 | O: 26H40.00D21 | Aug. 40.00 | 2.30 | $ 16,576.90 | 55.01% | 16.31% | 5.49% |
| Name | Action |
|---|---|
| Palantir Technologies Inc. Class A ( PLTR) - 128.06 | Sell the July 150.00 Calls. |
| Alcoa Inc. ( AA) - 73.03 | Sell the July 75.00 Calls. |
| Dow, Inc. ( DOW) - 39.01 | Sell the May 40.00 Calls. |
| Name | Covered Write |
|---|---|
|
|
|
Daily Equity & Market Analysis
LISTEN TO PODCAST
Apr 09, 2026
Loading, Please Wait...
