Most Requested Symbols

In what has been an extremely busy year, most of us could use a break. Luckily, many of the NDW analysts will be able to sit back and watch their favorite pastime from the couch this weekend as the Masters will have everyone’s eyes glued to the screen.
So far, the second quarter has seen 30 of the 40 sector bullish‑percent charts return to a column of Xs, suggesting a notable increase in stocks maintaining point and figure buy signals.
Weekly Rundown Video – April 8, 2026
Weekly rundown with NDW analyst team covering all major asset classes.
Weekly rundown with NDW analyst team covering all major asset classes.
Beginners Series Webinar: Join us on Monday, April 13th at 2 PM (ET) for our NDW Beginners Series Webinar. This week's topic is: Fund Score Composition and the Asset Class Group Scores Page Register Here
In what has been an extremely busy year, most of us could use a break. Luckily, many of the NDW analysts will be able to sit back and watch their favorite pastime from the couch this weekend as the Masters will have everyone’s eyes glued to the screen. Whether you are a lifelong fan of the game or an amateur trying to break 100 for the first time, the beauty of Augusta undoubtedly gives us all something to enjoy. As our favorite players tee it up and go after the green jacket, markets have tried to do the same to open up Q2. The S&P 500 is up just over 3% since April 1st. While SPX is still fighting for par so far this year, the return to a PnF buy signal and move back up to the middle of the trading band is certainly constructive.
There is a reason for the saying “Buy What You Know.” Whether it be airlines, cars, or apparel, our clients enjoy following brands they most often use in their day to day lives. For many of the analysts in Richmond, part of that “buy what you know” slogan could involve some of the world’s most famous golf brands. Whether it be pulling out the new driver on the tee box or searching for the resulting shot in the woods in your new pair of shoes, most of us will have some association with a handful of golf-related brands. The table below breaks down these brands in more detail.

While golf club/gear names have mixed/good technical pictures in aggregate, golf apparel brands seem to be struggling a bit more as more discretionary stocks have lost some relative strength so far this year. While the likes of NKE, LULU, or UA found their way to the rough off the tee, there are several names eyeing birdie as they construct technical pictures to open Q2. Titleist/Footjoy parent company Acushnet Holdings (rightfully tracked via ticker GOLF) has put together quite a productive opening to 2026. Up over 23% YTD, this perfect 5/5’er recently broke back into a positive trend on its default chart pictured below. With plenty of support ranging between the upper $80’s and lower $90’s, the name seems poised to make the cut heading further into 2026. All this to say, remember to monitor the health of these “buy what you know” companies within client portfolios. While it can be easy to want to own a piece of the brand you rep as you fish your golf ball out of water, sometimes the real hole-in-one comes when you avoid those relative losers all together.


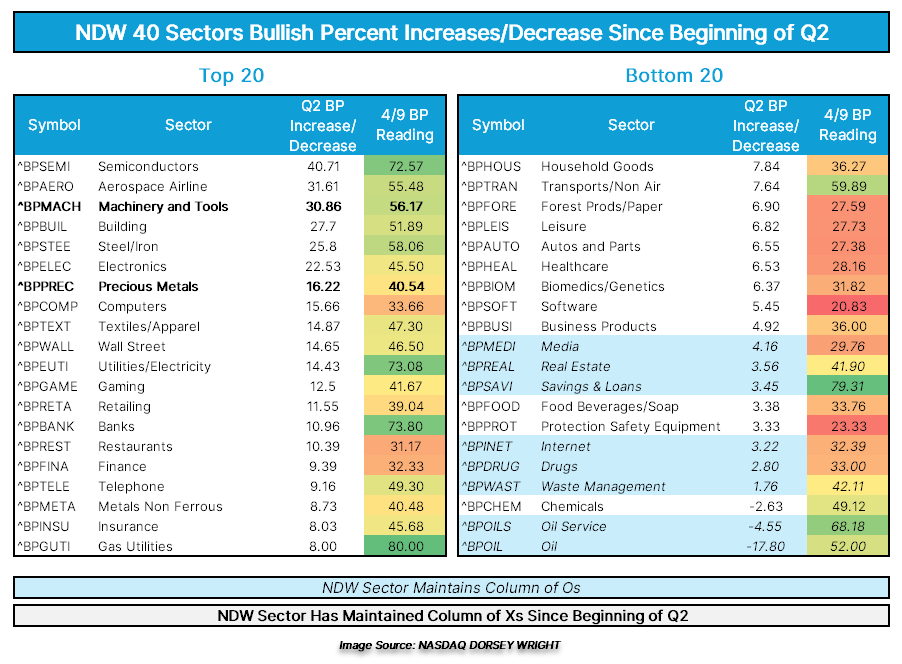
While Thursday’s (4/9) trading was comparatively muted, the positive impact on U.S. equity indices and intermediate‑ and long‑term indicators from Wednesday’s (4/8) trading was significant. The notable amount of positive action within indicators, such as the bullish percents, deserves a deeper analysis of which sectors or subsectors were the biggest contributors.
The table below displays the NDW 40 sector bullish‑percent increases or decreases since the beginning of Q2 2026 – encompassing a little over a week’s time - along with current readings as of 4/9. So far, the second quarter has seen 30 of the 40 sector bullish‑percent charts return to a column of Xs, suggesting a notable increase in stocks maintaining point and figure buy signals. On average, NDW sectors have seen their bullish percents rise roughly 10% during Q2, though approximately fifteen sectors have posted substantial gains alongside a few laggards worth noting. Highlights from the data are summarized below.
Considering the Q2 increases in bullish percents, semiconductors, aerospace & airlines, and machinery & tools appear to be attractive areas when evaluating new or existing portfolio exposure. Listed below are three stocks—one from each sector—that present favorable technical setups and are actionable either on recent breakouts or on pullbacks. Additional stock ideas are also provided and meet the following criteria: a technical attribute (TA) rating of 4 or 5, a positive trend, a buy signal, a ranking in the top half of the sector matrix, and earnings more than two weeks away.
ATI ATI Inc. ($160.13) – Aerospace & Airlines - Formerly Allegheny Technologies, ATI has maintained a perfect 5‑for‑5 technical attribute rating since October 2025, when the stock returned to a column of Xs versus both the market and its peer group. The stock has also demonstrated superior long‑term relative strength versus the market and peer group since 2020 and currently ranks within the top decile of the Aerospace & Airlines sector matrix. On the default trend chart, ATI has maintained a positive trend since April of last year and returned to a buy signal at the start of April. Wednesday’s trading produced a second consecutive buy signal, completing a bullish catapult, as shares rallied to $162 during Thursday’s session. The stock’s all‑time chart high from March stands at $168. Initial support is near $146, with additional support around $136. Earnings are expected on April 30.
Additional ideas: AerCap Holdings (AER), AAR Corp. (AIR), Curtiss‑Wright Corp. (CW), and Howmet Aerospace (HWM).

MU Micron Technology, Inc. ($412.75) – Semiconductors - Following Thursday’s trading, Micron’s market relative‑strength chart versus the S&P 500 Equal Weight Index (SPXEWI) returned to a column of Xs, raising the stock to a 4‑for‑5 technical attribute rating. From a long‑term perspective, MU has maintained positive relative strength versus the market since June of last year and against its peer group since March 2023. On the trend chart, the stock has remained in a positive trend since May 2025 and returned to a buy signal at the start of April 2026. This week’s action marked a third buy signal with a double‑top breakout at $388, as shares rallied to $416. MU appears actionable at current levels or on a pullback to the $380–$390 range. Initial support lies at $368, with additional support at $344 and $312—the March 2026 low.
Additional ideas: Applied Materials (AMAT), Lattice Semiconductor (LSCC), Lam Research (LRCX), MACOM Technology Solutions (MTSI), and NOVA Ltd. (NVMI).

CAT Caterpillar Inc. ($790.13) – Machinery & Tools - Caterpillar has carried a 5‑for‑5 technical attribute rating since July 2025 and has maintained at least a 3 rating since October 2022. The stock has shown long‑term positive relative strength versus the market since February 2021 and against its peer group since September 2023, and it currently ranks second out of 69 within the Machinery & Tools sector matrix. On the trend chart, CAT has traded within a positive trend since June of last year and returned to a buy signal in late March 2026. This week’s trading produced a third consecutive buy signal at $744 before extending to a new all‑time high near $792. CAT is actionable on the breakout or on a pullback into the mid‑$700s. Initial support is near $712, with additional support in the $670s and $660s. Earnings are expected on April 30.
Additional ideas: Regal Rexnord (RRX), Cummins Inc. (CMI), Helios Technologies (HLIO), and The Timken Company (TKR).


| Symbol | Name | Price | Yield | PnF Trend | RS Signal | RS Col. | Fund Score | 200 Day MA | Weekly Mom |
|---|---|---|---|---|---|---|---|---|---|
| DIA | State Street SPDR Dow Jones Industrial Average ETF Trust | 481.90 | 1.52 | Positive | Sell | X | 3.71 | 468.34 | + 1W |
| EEM | iShares MSCI Emerging Markets ETF | 60.28 | 1.94 | Positive | Buy | X | 5.45 | 54.36 | - 6W |
| EFA | iShares MSCI EAFE ETF | 101.95 | 3.08 | Positive | Sell | X | 4.30 | 95.16 | - 6W |
| IJH | iShares S&P MidCap 400 Index Fund | 70.67 | 1.32 | Positive | Buy | O | 4.44 | 66.30 | + 1W |
| IJR | iShares S&P SmallCap 600 Index Fund | 130.75 | 1.29 | Positive | Sell | X | 4.36 | 120.36 | + 1W |
| QQQ | Invesco QQQ Trust | 610.19 | 0.46 | Positive | Buy | O | 4.29 | 596.34 | + 1W |
| RSP | Invesco S&P 500 Equal Weight ETF | 198.08 | 1.62 | Positive | Sell | O | 2.99 | 191.17 | - 6W |
| SPY | State Street SPDR S&P 500 ETF Trust | 679.91 | 1.14 | Positive | Buy | X | 4.75 | 664.00 | + 1W |
| XLG | Invesco S&P 500 Top 50 ETF | 56.84 | 0.67 | Positive | Buy | O | 3.59 | 56.78 | + 1W |

Average Level
7.97
| < - -100 | -100 - -80 | -80 - -60 | -60 - -40 | -40 - -20 | -20 - 0 | 0 - 20 | 20 - 40 | 40 - 60 | 60 - 80 | 80 - 100 | 100 - > |
|---|---|---|---|---|---|---|---|---|---|---|---|
|
Sell signaldia
|
|||||||||||
|
Sell signalXLG
|
|||||||||||
|
Buy signalVOOV
|
|||||||||||
|
Buy signalhyg
|
|||||||||||
|
Buy signaldvy
|
|||||||||||
|
Sell signalVOOG
|
|||||||||||
|
Buy signalSPY
|
|||||||||||
|
Buy signalEEM
|
|||||||||||
|
Sell signalONEQ
|
|||||||||||
|
Sell signallqd
|
Buy signaldx/y
|
Buy signaliwm
|
|||||||||
|
Sell signalief
|
Buy signalgld
|
Sell signalQQQ
|
Buy signalicf
|
||||||||
|
Buy signaltlt
|
Buy signalfxe
|
Buy signalefa
|
Buy signalijr
|
||||||||
|
Buy signalshy
|
Sell signalagg
|
Buy signalrsp
|
Buy signalIJH
|
Buy signalGCC
|
Buy signalGSG
|
Sell signalUSO
|
|||||
| < - -100 | -100 - -80 | -80 - -60 | -60 - -40 | -40 - -20 | -20 - 0 | 0 - 20 | 20 - 40 | 40 - 60 | 60 - 80 | 80 - 100 | 100 - > |
| AGG | iShares US Core Bond ETF |
| USO | United States Oil Fund |
| DIA | SPDR Dow Jones Industrial Average ETF |
| DVY | iShares Dow Jones Select Dividend Index ETF |
| DX/Y | NYCE U.S.Dollar Index Spot |
| EFA | iShares MSCI EAFE ETF |
| FXE | Invesco CurrencyShares Euro Trust |
| GLD | SPDR Gold Trust |
| GSG | iShares S&P GSCI Commodity-Indexed Trust |
| HYG | iShares iBoxx $ High Yield Corporate Bond ETF |
| ICF | iShares Cohen & Steers Realty ETF |
| IEF | iShares Barclays 7-10 Yr. Tres. Bond ETF |
| LQD | iShares iBoxx $ Investment Grade Corp. Bond ETF |
| IJH | iShares S&P 400 MidCap Index Fund |
| ONEQ | Fidelity Nasdaq Composite Index Track |
| QQQ | Invesco QQQ Trust |
| RSP | Invesco S&P 500 Equal Weight ETF |
| IWM | iShares Russell 2000 Index ETF |
| SHY | iShares Barclays 1-3 Year Tres. Bond ETF |
| IJR | iShares S&P 600 SmallCap Index Fund |
| SPY | SPDR S&P 500 Index ETF Trust |
| TLT | iShares Barclays 20+ Year Treasury Bond ETF |
| GCC | WisdomTree Continuous Commodity Index Fund |
| VOOG | Vanguard S&P 500 Growth ETF |
| VOOV | Vanguard S&P 500 Value ETF |
| EEM | iShares MSCI Emerging Markets ETF |
| XLG | Invesco S&P 500 Top 50 ETF |
| Symbol | Company | Sector | Current Price | Action Price | Target | Stop | Notes |
|---|---|---|---|---|---|---|---|
| WBS | Webster Financial Corporation | Banks | $71.69 | hi 60s - low 70s | 91 | 58 | 4 for 5'er, top 25% of BANK sector matrix, one box from peer RS buy, buy on pullback, 2.2% yield, Earn. 4/30 |
| CGON | CG Oncology, Inc. | Biomedics/Genetics | $68.57 | hi 50s - low 60s | 80 | 50 | 5 for 5'er, 18 of 162 in BIOM sector matrix, bullish catapult, good R-R, Earn. 5/7 |
| BRX | Brixmor Property Group Inc | Real Estate | $29.57 | hi 20s - lo 30s | 38 | 24 | 4 for 5'er, top third of REAL sector matrix, LT pos peer & mkt RS, LT pos trend, bullish triangle, 4% yield, Earn. 4/27 |
| CNX | CNX Resources Corp | Oil | $38.82 | hi 30s - mid 40s | 71 | 33 | 5 TA rating, top 50% of OIL sector matrix, LT RS buy and pos trend, consec buy signals, Earn. 4/30 |
| FFIV | F5 Inc. | Internet | $294.59 | 280s - 290s | 344 | 256 | 4 for 5'er, top third of INET sector matrix, LT pos peer RS, spread quad top, Earn. 4/28 |
| INVA | Innoviva, Inc | Drugs | $24.20 | lo-mid 20s | 32.50 | 18.50 | 5 TA rating, top half of drugs sector RS matrix, LT pos trend, LT RS buy, buy-on-pullback, Earn. 5/6 |
| ARCB | ArcBest Corp. | Transports/Non Air | $109.25 | low-to-mid 90s | 113 | 79 | 4 for 5'er, one box from market RS buy, top half of favored TRAN sector matrix, good R-R, Earn. 4/28 |
| GSK | GlaxoSmithKline Plc. (United Kingdom) ADR | Drugs | $58.36 | hi 40s - mid 50s | 67 | 42 | 5 TA rating, top 25% of DRUG sector matrix, LT pos trend, yield > 3%, buy-on-pullback, Earn. 4/29 |
| ADI | Analog Devices, Inc. | Semiconductors | $351.36 | 310s - 330s | 380 | 268 | 4 for 5'er, top half of favored SEMI sector matrix, LT pos market RS, return to buy signal |
| CSCO | Cisco Systems, Inc. | Computers | $83.17 | Upper 70s to lower 80s | 96 | 70 | 5 for 5'er; top quintile of Computers matrix; Pos. Trend since Sept. '24; Bull Triangle on 3/25. |
| CAT | Caterpillar, Inc. | Machinery and Tools | $787.07 | 680s - 720s | 848 | 592 | 5 for 5'er, top 10% in favored MACH sector matrix, LT pos peer & mkt RS, buy on pullback, Earn. 4/30 |
| DBD | Diebold Nixdorf Inc | Finance | $84.51 | low-to-mid 70s | 99 | 63 | 5 for 5'er, #3 of 77 in FINA sector matrix, LT pos peer RS, bearish signal reversal, R-R>2.0, Earn. 5/6 |
| NI | Nisource, Inc. | Gas Utilities | $48.47 | mid-hi 40s | 78 | 38 | 5 TA rating, LT pos trend, LT mkt RS buy, consec buy signals, Earn. 5/6 |
| FHI | Federated Hermes Inc | Wall Street | $56.93 | 54-hi 50s | 91 | 46 | 5 TA rating, top 25% of WALL sector RS matrix, LT pos trend and mkt RS buy, consec buy signals, good R-R, Earn. 4/30 |
| CRS | Carpenter Technology Corporation | Steel/Iron | $431.21 | hi 370s - low 400s | 500 | 320 | 5 for 5'er, top third of STEE sector matrix, LT pos peer & mkt RS, spread quintuple top, buy on pullback, Earn. 4/29 |
| COST | Costco Wholesale Corporation | Retailing | $1032.03 | 944-1050s | 1296 | 832 | 4 TA rating, top 33% of retail sector matrix, LT mkt RS buy, LT pos trend, consec buy signals |
| ATRO | Astronics Corp | Aerospace Airline | $73.78 | hi 60s - mid 70s | 90 | 59 | 5 for 5'er, top 20% of AERO sector matrix, bearish signal reversal to spread triple top |
| BURL | Burlington Stores, Inc. | Retailing | $338.40 | mid 320s to 340s | 400 | 284 | 5 for 5'er; top quintile of Retail matrix; Multi-Yr High on 4/9; R-R > 4. |
| AMG | Affiliated Managers Group | Wall Street | $286.32 | 270s - 280s | 356 | 232 | 5 for 5'er, top third of WALL sector matrix, LT pos peer RS, spread triple top, |
| Symbol | Company | Sector | Current Price | Action Price | Target | Stop | Notes |
|---|---|---|---|---|---|---|---|
| CPRT | Copart Incorporated | Autos and Parts | $32.99 | hi 30s | 28 | 42 | 1 TA rating, bottom 50% of AUTO sector matrix, NT and mkt RS sell last month, consec sell signals |
| Symbol | Company | Sector | Current Price | Action Price | Target | Stop | Notes |
|---|---|---|---|---|---|---|---|
| GLW | Corning Incorporated | Electronics | $169.80 | hi 130s - 140s | 196 | 120 | GLW has moved to heavily overbought territory. OK to hold here. Raise stop to $140. Earn. 4/28 |
| Comment | |||||||
|---|---|---|---|---|---|---|---|
|
|
|||||||
AMG Affiliated Managers Group R ($283.20) - Wall Street - AMG is a 5 for 5'er that ranks in the top third of the Wall Street sector matrix and has been on a peer RS buy signal since 2021. After giving four consecutive sell signals on its default chart, AMG returned to a buy signal earlier this week when it broke a double top at $286 and continued higher, breaking a spread triple top at $288. Long exposure may be added in the $270s to $280 and we will set our initial stop at $232, which would violate AMG's trend line. We will use the bullish price objective, $356, as our target price.
| 26 | |||||||||||||||||||||||||||||
| 332.00 | X | X | 332.00 | ||||||||||||||||||||||||||
| 328.00 | X | O | X | O | 328.00 | ||||||||||||||||||||||||
| 324.00 | X | O | X | O | 324.00 | ||||||||||||||||||||||||
| 320.00 | X | O | X | O | 320.00 | ||||||||||||||||||||||||
| 316.00 | X | O | X | O | X | 316.00 | |||||||||||||||||||||||
| 312.00 | X | O | X | X | O | X | O | 3 | X | 312.00 | |||||||||||||||||||
| 308.00 | X | O | X | O | X | O | X | O | X | O | X | O | 308.00 | ||||||||||||||||
| 304.00 | X | 2 | X | O | X | O | X | O | X | O | X | O | 304.00 | ||||||||||||||||
| 300.00 | 1 | O | X | O | X | O | X | O | O | O | 300.00 | ||||||||||||||||||
| 296.00 | X | O | O | X | O | X | O | Mid | 296.00 | ||||||||||||||||||||
| 292.00 | X | O | O | X | O | 292.00 | |||||||||||||||||||||||
| 288.00 | X | O | X | O | X | 288.00 | |||||||||||||||||||||||
| 284.00 | X | O | X | O | X | X | X | 284.00 | |||||||||||||||||||||
| 280.00 | X | O | O | X | O | X | O | X | X | 280.00 | |||||||||||||||||||
| 276.00 | X | O | X | O | X | O | X | O | X | 276.00 | |||||||||||||||||||
| 272.00 | C | O | O | X | O | X | O | X | 272.00 | ||||||||||||||||||||
| 268.00 | X | O | O | 4 | X | 268.00 | |||||||||||||||||||||||
| 264.00 | X | X | O | X | 264.00 | ||||||||||||||||||||||||
| 260.00 | X | O | X | O | X | 260.00 | |||||||||||||||||||||||
| 256.00 | X | O | X | O | 256.00 | ||||||||||||||||||||||||
| 252.00 | X | O | X | 252.00 | |||||||||||||||||||||||||
| 248.00 | X | B | O | 248.00 | |||||||||||||||||||||||||
| 244.00 | X | O | X | X | 244.00 | ||||||||||||||||||||||||
| 240.00 | X | O | X | O | X | 240.00 | |||||||||||||||||||||||
| 236.00 | X | O | X | O | X | 236.00 | |||||||||||||||||||||||
| 232.00 | 9 | A | O | • | 232.00 | ||||||||||||||||||||||||
| 228.00 | X | • | 228.00 | ||||||||||||||||||||||||||
| 224.00 | X | • | Bot | 224.00 | |||||||||||||||||||||||||
| 220.00 | X | • | 220.00 | ||||||||||||||||||||||||||
| 216.00 | O | X | • | 216.00 | |||||||||||||||||||||||||
| 212.00 | O | X | • | 212.00 | |||||||||||||||||||||||||
| 208.00 | 8 | X | • | 208.00 | |||||||||||||||||||||||||
| 204.00 | O | X | • | 204.00 | |||||||||||||||||||||||||
| 200.00 | O | • | 200.00 | ||||||||||||||||||||||||||
| 26 |

| FIVE Five Below Inc ($220.39) - Retailing - FIVE broke a double bottom at $216 to initate a shakeout pattern. The stock has been a 5 for 5'er since June 2025 and current ranks 3rd (out of 92) within the Retailing sector matrix. The action point for the shakeout pattern would be a reversal back into Xs at $228, while the pattern would be complete upon a triple top break at $240, a potential all-time chart high. Initial support currently resides in the $208 to $212 range, while additional can be found in the $190s. |
| SMG The Scotts Company ($60.74) - Chemicals - SMG fell to a sell signal a negative trend Friday when it broke a double bottom at $61. The negative trend change will drop the stock to a 1 for 5'er and SMG ranks in the bottom quintile of the chemicals sector matrix. From here, the next level of support sits at $59. |
| Name | Option Symbol | Action | Stop Loss |
|---|---|---|---|
| Delta Air Lines Inc. - $67.82 | O: 26G67.50D17 | Buy the July 67.50 calls at 6.20 | 62.00 |
| Name | Option | Action |
|---|---|---|
| General Dynamics Corporation ( GD) | May. 360.00 Calls | Stopped at 336.00 (CP: 334.74) |
| The TJX Companies, Inc. ( TJX) | Jul. 160.00 Calls | Stopped at 8.50 (CP: 8.40) |
| Name | Option Symbol | Action | Stop Loss |
|---|---|---|---|
| Alibaba Group Holding Ltd (China) ADR - $127.33 | O: 26S130.00D17 | Buy the July 130.00 puts at 12.45 | 140.00 |
| Name | Option | Action |
|---|---|---|
| Abbott Laboratories ( ABT) | Aug. 115.00 Puts | Raise the option stop loss to 13.20 (CP: 15.20) |
| Apollo Global Management Inc. ( APO) | May. 115.00 Puts | Raise the option stop loss to 10.20 (CP: 12.20) |
| T-Mobile US Inc. ( TMUS) | Jun. 210.00 Puts | Raise the option stop loss to 16.60 (CP: 18.60) |
| Salesforce Inc. ( CRM) | May. 185.00 Puts | Raise the option stop loss to 19.60 (CP: 21.60) |
| Oracle Corporation ( ORCL) | Jul. 150.00 Puts | Raise the option stop loss to 20.05 (CP: 22.05) |
| Name | Option Sym. | Call to Sell | Call Price | Investment for 500 Shares | Annual Called Rtn. | Annual Static Rtn. | Downside Protection |
|---|---|---|---|---|---|---|---|
| Dow, Inc. $ 38.04 | O: 26E40.00D15 | May. 40.00 | 2.07 | $ 18,675.40 | 63.08% | 46.33% | 4.26% |
| Name | Action |
|---|---|
| Palantir Technologies Inc. Class A ( PLTR) - 130.49 | Sell the July 150.00 Calls. |
| Alcoa Inc. ( AA) - 73.27 | Sell the July 75.00 Calls. |
| Name | Covered Write |
|---|---|
| Hewlett Packard Enterprise Company ( HPE - 24.83 ) | May 24.00 covered write. |
Daily Equity & Market Analysis
LISTEN TO PODCAST
Apr 09, 2026
Loading, Please Wait...
