Most Requested Symbols

There has been no shortage of volatility in energy markets over the last month. Including Wednesday, April 8, 2026, crude oil has had five days this year with a daily absolute move greater than 10%.
Despite larger exhales for major markets throughout the first quarter, momentum strategies were able to put together productive opening to the year in comparison to broader benchmarks.
Weekly Rundown Video – April 8, 2026
Weekly rundown with NDW analyst team covering all major asset classes.
Weekly rundown with NDW analyst team covering all major asset classes.
There has been no shortage of volatility in energy markets over the last month. Including Wednesday, April 8, 2026, crude oil has had five days this year with a daily absolute move greater than 10%. The last couple of oil price shock events, onset of the Russia-Ukraine conflict and Covid, had their fair share of extreme daily moves for crude oil. From March through May of 2020, Crude Oil Continuous (CL/) had seventeen 10% magnitude daily moves. While the start of the Russia-Ukraine conflict led oil significantly higher, it had only one day where it had a 10% daily move which was the day after the top for the cycle had been established. With data going back to 1983, these volatile periods were usually followed by some form of mean reversion to historical norms over the next year. While there is still elevated risk as tensions are still high in the Middle East, the amount of volatility we’ve experienced typically happens closer to the end of a move rather than the beginning.

Moving onto the trend chart of crude oil, it was able to get one box away from its initial shock high of 118 before falling roughly 15% on April 8th and giving a sell signal (will be on the chart April 9th as commodity prices update overnight). Two important levels on the downside to watch are $86 and $78. A break below $78 opens up crude oil to fall back to the area it spent most of last year and would dispel worries of inflation. With that said, it may take awhile for production to get back to pre-conflict levels and for storage capacity in importers to fill back up, so it’ll take some time before the market can get back to the low 60s. Coupled with the possibility of continued conflict, look for crude oil to settle in the mid-80s over the next couple of months if the ceasefire holds. With all those contingencies, the levels will be key to watch over the coming weeks and months.


Despite larger exhales for major markets throughout the first quarter, momentum strategies were able to put together productive opening to the year in comparison to broader benchmarks. This was particularly evident for large cap equities which were able to post postive results for the calendar quarter (12/31/25-3/31/26). Small cap momentum strategies, while still positive for the year, posted outperformance of a smaller magnitude against major benchmarks.
The performance table below compares the price return of the Invesco Dorsey Wright Momentum ETF (PDP) and the Invesco Dorsey Wright SmallCap Momentum ETF (DWAS) to their respective benchmarks through the first quarter, while the two bottom tables zoom out to broader, full year calendar year performance throughout history as well as updated performance so far in 2026 (through 4/7/2026).

Our approach toward momentum through relative strength analysis looks to capitalize on consistent trends across the market. Changing trends cause the portfolios to readjust to maintain exposure to the strongest areas. Underperformance is typical during those environments as areas that had demonstrated relative strength fall in our rankings. The most important step in our approach comes next – those areas that have declined in strength are sold to make room for the new leaders. Any investment process is going to produce a portfolio of winners and losers. Relative strength analysis gives us a systematic way to cull the losers and constantly push the portfolio toward the strongest areas of the market.
In the most recent quarter, we saw 45 changes (out of 100 holdings) in PDP and 95 changes (out of 200 holdings) in DWAS, repositioning both portfolios toward areas of leadership as we enter the second quarter. Those metrics sit roughly on par with the number of changes each strategy saw last quarter,.
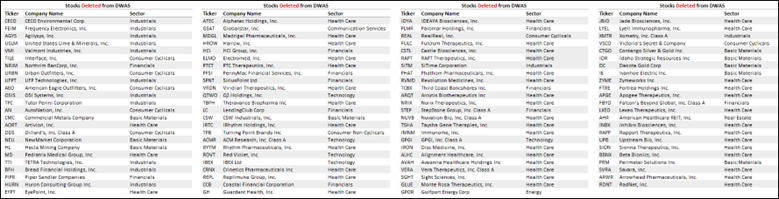
Below you'll find an update about the specific changes made in both strategies with the most recent index reconstitution. Keep in mind that removed positions likely no longer maintain characteristics of superior relative strength; meanwhile, additions have improved to a place of leadership and could be ideas to consider.
Invesco DWA Momentum ETF (PDP)
The stock-selection process behind the Invesco Dorsey Wright Momentum ETF (PDP) is simple yet robust. Every quarter, we apply the Relative Strength process to compare approximately 1,000 large and mid-cap US stocks and select the strongest 100 names. The quarterly reconstitution process's goal is to weed out the weak names and realign the portfolio toward strength. As mentioned before, with this most recent reconstitution and rebalance, we removed 45 stocks and added 45 new stocks, which we've compiled in the tables below. Several observations:


Invesco DWA SmallCap Momentum ETF (DWAS)
The stock-selection process used in DWAS is like PDP. Every quarter, we apply the Relative Strength process to compare approximately 2,000 US-listed small-cap stocks and select the strongest 200 names. With this most recent reconstitution and rebalance we pushed the portfolio towards strength by removing 95 stocks and adding 95 new stocks, which we've outlined in the table below. However, and perhaps unique to DWAS, not all stocks that were removed are technically weak. We have received this question in the past, so we want to address it here.
One reason for these removals is due to stocks exceeding the market cap filter. High-momentum stocks should, ideally, increase in market cap which means that sometimes a name will exceed the small-cap maximum at the end of a quarter. This is not the norm, but worth keeping in mind when reviewing the changes. Several takeaways:

Disclosures:
This article is intended for Financial Professional Use Only.
Management and other expenses can have a material impact on performance when compounded over time. Past performance, hypothetical or actual, does not guarantee future results. In all securities trading there is a potential for loss as well as profit. It should not be assumed that recommendations made in the future will be profitable or will equal the performance as shown.
Click here for more information from Invesco on the Invesco DWA Momentum ETF (PDP): https://www.invesco.com/us/financial-products/etfs/product-detail?audienceType=Investor&ticker=PDP
Click here for more information from Invesco on the Invesco DWA SmallCap Momentum ETF (DWAS): https://www.invesco.com/us/financial-products/etfs/product-detail?audienceType=Investor&productId=ETF-DWAS
Dorsey, Wright & Associates, LLC is owned by Nasdaq, Inc. and we have affiliates who also provide financial services, research, information, and act as Brokers/Dealers to a wide variety of clients. Our affiliates use the information we create to create indexes, which are then used to create Exchange Traded Funds. These things create a potential conflict of interest in that we may have an incentive to promote or use the products and services of our affiliates and business partners. A number of Dorsey Wright representatives are registered with and hold securities licenses with the affiliate broker-dealers. In this capacity, they assist with the marketing and distribution of Exchange Traded Products.
Each week the analysts at NDW review and comment on all major asset classes in the global markets. Shown below is the summary or snapshot of the primary technical indicators we follow for multiple areas. Should there be changes mid-week we will certainly bring these to your attention via the report.
| Universe | BP Col & Level (actual) | BP Rev Level | PT Col & Level (actual) | PT Rev Level | HiLo Col & Level (actual) | HiLo Rev Level | 10 Week Col & Level (actual) | 10 Week Rev Level | 30 Week Col & Level (actual) | 30 Week Rev Level |
|---|---|---|---|---|---|---|---|---|---|---|
| ALL |
|
40% |
|
42% |
|
26% |
|
28% |
|
34% |
| NYSE |
|
46% |
|
52% |
|
34% |
|
28% |
|
42% |
| OTC |
|
36% |
|
38% |
|
22% |
|
28% |
|
38% |
| World |
|
38% |
|
44% |
|
|
|
24% |
|
42% |

Remember, these are technical comments only. Just as you must be aware of fundamental data for the stocks we recommend based on technical criteria in the report, so too must you be aware of important data regarding delivery, market moving government releases, and other factors that may influence commodity pricing. We try to limit our technical comments to the most actively traded contracts in advance of delivery, but some contracts trade actively right up to delivery while others taper off well in advance. Be sure you check your dates before trading these contracts. For questions regarding this section or additional coverage of commodities email james.west@nasdaq.com.
Data represented in the table below is through 4/7/2026:
| Symbol | Name | Price | PnF Trend | RS Signal | RS Col. | 200 Day MA | Weekly Mom |
|---|---|---|---|---|---|---|---|
| CL/ | Crude Oil Continuous | 112.95 | Positive | Sell | X | 66.35 | + 15W |
| DBLCIX | Deutsche Bank Liquid Commodities Index | 468.52 | Positive | Sell | O | 460.74 | - 39W |
| DWACOMMOD | NDW Continuous Commodity Index | 1166.58 | Positive | Buy | X | 1045.80 | - 1W |
| GC/ | Gold Continuous | 4657.10 | Positive | Buy | O | 4130.19 | - 5W |
| HG/ | Copper Continuous | 5.54 | Negative | Sell | O | 5.25 | - 11W |
| ZG/ | Corn (Electronic Day Session) Continuous | 449.00 | Positive | Sell | O | 424.77 | - 1W |
Average Level
-11.11
| < - -100 | -100 - -80 | -80 - -60 | -60 - -40 | -40 - -20 | -20 - 0 | 0 - 20 | 20 - 40 | 40 - 60 | 60 - 80 | 80 - 100 | 100 - > |
|---|---|---|---|---|---|---|---|---|---|---|---|
|
Sell signalief
|
|||||||||||
|
Buy signalVOOV
|
|||||||||||
|
Sell signallqd
|
|||||||||||
|
Buy signalfxe
|
|||||||||||
|
Buy signalrsp
|
|||||||||||
|
Buy signaltlt
|
|||||||||||
|
Sell signalXLG
|
|||||||||||
|
Buy signalSPY
|
|||||||||||
|
Buy signalhyg
|
|||||||||||
|
Buy signalEEM
|
|||||||||||
|
Buy signalgld
|
Buy signaliwm
|
||||||||||
|
Sell signalVOOG
|
Buy signalIJH
|
||||||||||
|
Buy signalefa
|
Buy signaldvy
|
||||||||||
|
Sell signalagg
|
Sell signalONEQ
|
Buy signalijr
|
Buy signalGSG
|
||||||||
|
Buy signalshy
|
Sell signaldia
|
Sell signalQQQ
|
Buy signalicf
|
Buy signalGCC
|
Buy signaldx/y
|
Buy signalUSO
|
|||||
| < - -100 | -100 - -80 | -80 - -60 | -60 - -40 | -40 - -20 | -20 - 0 | 0 - 20 | 20 - 40 | 40 - 60 | 60 - 80 | 80 - 100 | 100 - > |
| AGG | iShares US Core Bond ETF |
| USO | United States Oil Fund |
| DIA | SPDR Dow Jones Industrial Average ETF |
| DVY | iShares Dow Jones Select Dividend Index ETF |
| DX/Y | NYCE U.S.Dollar Index Spot |
| EFA | iShares MSCI EAFE ETF |
| FXE | Invesco CurrencyShares Euro Trust |
| GLD | SPDR Gold Trust |
| GSG | iShares S&P GSCI Commodity-Indexed Trust |
| HYG | iShares iBoxx $ High Yield Corporate Bond ETF |
| ICF | iShares Cohen & Steers Realty ETF |
| IEF | iShares Barclays 7-10 Yr. Tres. Bond ETF |
| LQD | iShares iBoxx $ Investment Grade Corp. Bond ETF |
| IJH | iShares S&P 400 MidCap Index Fund |
| ONEQ | Fidelity Nasdaq Composite Index Track |
| QQQ | Invesco QQQ Trust |
| RSP | Invesco S&P 500 Equal Weight ETF |
| IWM | iShares Russell 2000 Index ETF |
| SHY | iShares Barclays 1-3 Year Tres. Bond ETF |
| IJR | iShares S&P 600 SmallCap Index Fund |
| SPY | SPDR S&P 500 Index ETF Trust |
| TLT | iShares Barclays 20+ Year Treasury Bond ETF |
| GCC | WisdomTree Continuous Commodity Index Fund |
| VOOG | Vanguard S&P 500 Growth ETF |
| VOOV | Vanguard S&P 500 Value ETF |
| EEM | iShares MSCI Emerging Markets ETF |
| XLG | Invesco S&P 500 Top 50 ETF |

| Symbol | Company | Sector | Current Price | Action Price | Target | Stop | Notes |
|---|---|---|---|---|---|---|---|
| WBS | Webster Financial Corporation | Banks | $69.77 | hi 60s - low 70s | 91 | 58 | 4 for 5'er, top 25% of BANK sector matrix, one box from peer RS buy, buy on pullback, 2.2% yield, Earn. 4/30 |
| CGON | CG Oncology, Inc. | Biomedics/Genetics | $69.85 | hi 50s - low 60s | 80 | 50 | 5 for 5'er, 18 of 162 in BIOM sector matrix, bullish catapult, good R-R, Earn. 5/7 |
| BRX | Brixmor Property Group Inc | Real Estate | $29.22 | hi 20s - lo 30s | 38 | 24 | 4 for 5'er, top third of REAL sector matrix, LT pos peer & mkt RS, LT pos trend, bullish triangle, 4% yield, Earn. 4/27 |
| CNX | CNX Resources Corp | Oil | $39.74 | hi 30s - mid 40s | 71 | 33 | 5 TA rating, top 50% of OIL sector matrix, LT RS buy and pos trend, consec buy signals, Earn. 4/30 |
| FFIV | F5 Inc. | Internet | $309.09 | 280s - 290s | 344 | 256 | 4 for 5'er, top third of INET sector matrix, LT pos peer RS, spread quad top, Earn. 4/28 |
| INVA | Innoviva, Inc | Drugs | $23.28 | lo-mid 20s | 32.50 | 18.50 | 5 TA rating, top half of drugs sector RS matrix, LT pos trend, LT RS buy, buy-on-pullback, Earn. 5/6 |
| ARCB | ArcBest Corp. | Transports/Non Air | $103.52 | low-to-mid 90s | 113 | 79 | 4 for 5'er, one box from market RS buy, top half of favored TRAN sector matrix, good R-R, Earn. 4/28 |
| GSK | GlaxoSmithKline Plc. (United Kingdom) ADR | Drugs | $55.84 | hi 40s - mid 50s | 67 | 42 | 5 TA rating, top 25% of DRUG sector matrix, LT pos trend, yield > 3%, buy-on-pullback, Earn. 4/29 |
| ADI | Analog Devices, Inc. | Semiconductors | $327.41 | 310s - 330s | 380 | 268 | 4 for 5'er, top half of favored SEMI sector matrix, LT pos market RS, return to buy signal |
| CSCO | Cisco Systems, Inc. | Computers | $80.68 | Upper 70s to lower 80s | 96 | 70 | 5 for 5'er; top quintile of Computers matrix; Pos. Trend since Sept. '24; Bull Triangle on 3/25. |
| CAT | Caterpillar, Inc. | Machinery and Tools | $724.44 | 680s - 720s | 848 | 592 | 5 for 5'er, top 10% in favored MACH sector matrix, LT pos peer & mkt RS, buy on pullback, Earn. 4/30 |
| DBD | Diebold Nixdorf Inc | Finance | $78.25 | low-to-mid 70s | 99 | 63 | 5 for 5'er, #3 of 77 in FINA sector matrix, LT pos peer RS, bearish signal reversal, R-R>2.0, Earn. 5/6 |
| NI | Nisource, Inc. | Gas Utilities | $47.65 | mid-hi 40s | 78 | 38 | 5 TA rating, LT pos trend, LT mkt RS buy, consec buy signals, Earn. 5/6 |
| GLW | Corning Incorporated | Electronics | $148.52 | hi 130s - 140s | 196 | 120 | 5 for 5'er, #2 of 66 in ELEC sector matrix, quad top breakout, R-R>2.5, Earn. 4/28 |
| FHI | Federated Hermes Inc | Wall Street | $56.79 | 54-hi 50s | 91 | 46 | 5 TA rating, top 25% of WALL sector RS matrix, LT pos trend and mkt RS buy, consec buy signals, good R-R, Earn. 4/30 |
| CRS | Carpenter Technology Corporation | Steel/Iron | $394.00 | hi 370s - low 400s | 500 | 320 | 5 for 5'er, top third of STEE sector matrix, LT pos peer & mkt RS, spread quintuple top, buy on pullback, Earn. 4/29 |
| COST | Costco Wholesale Corporation | Retailing | $1013.21 | 944-1050s | 1296 | 832 | 4 TA rating, top 33% of retail sector matrix, LT mkt RS buy, LT pos trend, consec buy signals |
| ATRO | Astronics Corp | Aerospace Airline | $71.86 | hi 60s - mid 70s | 90 | 59 | 5 for 5'er, top 20% of AERO sector matrix, bearish signal reversal to spread triple top |
| Symbol | Company | Sector | Current Price | Action Price | Target | Stop | Notes |
|---|---|---|---|---|---|---|---|
| CPRT | Copart Incorporated | Autos and Parts | $33.11 | hi 30s | 28 | 42 | 1 TA rating, bottom 50% of AUTO sector matrix, NT and mkt RS sell last month, consec sell signals |
| Comment | |||||||
|---|---|---|---|---|---|---|---|
|
|
|||||||
ATRO Astronics Corp R ($72.06) - Aerospace Airline - ATRO is a 5 for 5'er that ranks in the top quintile of the aerospace/airline sector matrix. After giving five consecutive sell signals, ATRO returned to a buy signal last week when it completed a bearish signal reversal at $70. In Wednesday's trading, the stock gave a second consecutive buy signal when it broke a spread triple top at $72. Long exposure may be added in the high $60s to mid $70s and we will set our initial stop at $59, which would violate ATRO's bullish support line. We will use the bullish price objective, $90, as our target price.
| 83.00 | X | 83.00 | |||||||||||||||||||||||||||
| 82.00 | X | O | 82.00 | ||||||||||||||||||||||||||
| 81.00 | X | X | 3 | O | 81.00 | ||||||||||||||||||||||||
| 80.00 | X | O | X | O | X | O | X | 80.00 | |||||||||||||||||||||
| 79.00 | X | X | O | X | X | O | X | O | X | O | 79.00 | ||||||||||||||||||
| 78.00 | X | O | 2 | O | X | O | X | X | O | X | O | X | O | 78.00 | |||||||||||||||
| 77.00 | X | O | X | O | X | O | X | O | X | O | X | O | X | O | X | 77.00 | |||||||||||||
| 76.00 | O | X | O | X | O | X | O | X | O | X | O | X | O | X | O | X | O | 76.00 | |||||||||||
| 75.00 | O | X | O | O | X | O | X | O | O | X | O | O | X | O | X | 75.00 | |||||||||||||
| 74.00 | O | O | X | O | X | O | X | O | O | X | O | Mid | 74.00 | ||||||||||||||||
| 73.00 | O | X | O | O | X | O | X | O | 73.00 | ||||||||||||||||||||
| 72.00 | O | O | X | O | X | O | 72.00 | ||||||||||||||||||||||
| 71.00 | O | X | O | O | X | X | X | 71.00 | |||||||||||||||||||||
| 70.00 | O | O | X | O | X | O | X | 70.00 | |||||||||||||||||||||
| 69.00 | O | X | O | X | X | O | X | 69.00 | |||||||||||||||||||||
| 68.00 | O | X | O | X | O | 4 | O | 68.00 | |||||||||||||||||||||
| 67.00 | O | X | O | X | O | X | 67.00 | ||||||||||||||||||||||
| 66.00 | O | X | O | X | O | X | 66.00 | ||||||||||||||||||||||
| 65.00 | O | X | O | X | O | X | 65.00 | ||||||||||||||||||||||
| 64.00 | O | O | X | O | X | 64.00 | |||||||||||||||||||||||
| 63.00 | O | O | X | 63.00 | |||||||||||||||||||||||||
| 62.00 | O | 62.00 |
| AU AngloGold Ashanti Limited (South Africa) ADR ($107.35) - Precious Metals - AU gave a third consecutive buy signal Wednesday when it broke a double top at $104 and continued higher, returning to a positive trend in the process. The positive trend change will promote AU to a 5 for 5'er. From here, support sits at $98. |
| BLK BlackRock, Inc. ($1,005.00) - Wall Street - BLK shares moved higher today to break a double top at $1008 to mark its second consecutive buy signal. This 3 for 5'er moved to a negative trend in March but has been on an RS buy signal versus the market since October 2020. BLK shares are trading in more normalized territory and are one box away from testing their negative trendline. From here, support is offered at $944 and $928. |
| BURL Burlington Stores, Inc. ($335.69) - Retailing - BURL broke a double top at $340 for a third buy signal since the back half of March and to mark a new multi-year chart high. The stock improved to a 5 for 5'er after moving back into a positive trend in the latter weeks of March and currently ranks within the top quintile of the Retailing sector matrix. Okay to consider here on the breakout. Note the stock's all-time chart high from 2021 resides in the $350 range. Initial support can be found at $324, while additional resides in the $310 range. |
| COP ConocoPhillips ($125.22) - Oil - COP fell to a sell signal Wednesday along with much of the energy sector when it broke a double bottom at $126. Wednesday's move adds to an already unfavorable technical picture as COP is a 2 for 5'er. From here, the next level of support sits at $114. |
| CVX Chevron Corporation ($192.89) - Oil - CVX gave an initial sell signal Wednesday when it broke a double bottom at $194 amid a sector-wide selloff. CVX's technical picture remains favorable despite Wednesday's move as the stock is a 4 for 5'er that ranks in the top half of the oil sector matrix. From here, the next level of support sits at $186. |
| DAL Delta Air Lines Inc. ($68.63) - Aerospace Airline - DAL reversed into Xs and broke a triple top at $69 as shares rallied to $74, clearing resistance in the lower $70s during the process. This action follows a return to a buy signal and positive trend reversal in the latter half of March, which increased the stock to a 3 for 5'er. DAL is action in the upper $60s to lower $70s. Initial support can be found in the mid to lower $60s, while additional resides in the upper to mid $50s. |
| DLR Digital Realty Trust, Inc. ($184.45) - Real Estate - Shares of DLR broke a triple top at $184 for its third consecutive buy signal. The 3 for 5'er has improved significantly over the last several months, moving back to a positive trend in late January. However, the stock remains more of a hold than anything given its lack of market relative strength. From here, resistance lies at $186 then $198 from all-time highs in 2024. |
| GOLF Acushnet Holdings Corp ($98.85) - Leisure - GOLF broke a spread triple top at $96 for a second buy signal as shares rallied to $99. The breakout follows a return to a buy signal and positive trend reversal during the closing days of March, which increased the stock back to a 5 for 5'er. Okay to consider here on the breakout or on a pullback to the mid $90s. Note resistance near chart highs in the low to mid $100 range. Initial support lies at $92, the bullish support line, while additional cane be found in the lower $90s and upper $80s. |
| JPM J.P. Morgan Chase & Co. ($306.94) - Banks - JPM shares moved higher today to break a double top at $300 and return to a buy signal on its trend chart. This 5 for 5'er has been in a positive trend since November 2023 and on an RS buy signal versus the market since March 2024. JPM shares are trading in normalized territory near the middle of their ten-week trading band. From here, support is offered at $284 and $280. |
| KR The Kroger Co. ($70.60) - Retailing - Shares of KR broke a triple bottom at $69, and today's action also saw the stock move into a negative trend. However, the stock continues to display peer and marketing relative strength. so the stock remains a buy as a 4 for 5'er for the time being. From here, initial support lies at $67 and $59. |
| MMM 3M Company ($148.54) - Chemicals - MMM returned to a buy signal Wednesday when it broke a double top at $150. The outlook for the stock remains negative, however, as MMM is a 1 for 5'er and ranks in the bottom quartile of the chemicals sector matrix. From here, support sits at $142, while overhead resistance can be found at $156. |
| MS Morgan Stanley ($175.92) - Wall Street - MS shares moved higher today to break a triple top at $170 to mark their second consecutive buy signal. This 5 for 5'er has been in a positive trend since March and on an RS buy signal versus the market since June 2013. MS shares are trading in actionable territory near the middle of their ten-week trading band. From here, support is offered at $162, $160, and $158. |
| NUE Nucor Corporation ($182.16) - Steel/Iron - NUE gave a second consecutive buy signal and returned to a positive trend when it broke a double top at $176. The positive trend change will promote NUE to an acceptable 3 for 5'er. |
| OXY Occidental Petroleum Corporation ($59.93) - Oil - OXY fell to a sell signal Wednesday along with many other members of the energy sector when it broke a double bottom at $61, OXY's technical picture remains favorable, however, as the stock is a 4 for 5'er that ranks in the top half of the oil sector matrix. From here, the next level of support sits at $53. |
| RGLD Royal Gold Inc ($268.17) - Precious Metals - RGLD gave a second consecutive buy signal and returned to a positive trend Wednesday when it broke a double top at $272. The outlook for the stock remains negative, as even with the positive trend change RGLD is a weak 2 for 5'er. |
| RL Ralph Lauren ($374.03) - Textiles/Apparel - RL broke a double top at $360 for a third buy signal as shares rallied to $376. The breakout follows a positive trend flip, which increased the stock to a 5 for 5'er. RL has maintained long-term positive RS against the market since late 2023 and its peer group since early 2022. Okay to consider here on the breakout or on a pullback to the $350 range, near the mid-point of the 10-week trading band. Note the stock's prior chart high from February in the $380 range. Initial support lies at $344, while additional can be found at $336 and $328. |
| RS Reliance Inc. ($320.33) - Steel/Iron - RS returned to a buy signal Wednesday when it completed a bearish signal reversal at $312. The outlook for the stock remains negative, however, as RS is a 2 for 5'er. From here, the first level of support sits at $292. |
| SCCO Southern Copper Corporation ($187.17) - Metals Non Ferrous - SCCO rose almost 7% on Wednesday giving a third consecutive buy signal and returning to a positive trend when it completed a bullish triangle at $180. The positive trend change will elevate SCCO to a 4 for 5'er. The stock now shows support at $172 and $170. |
| SHEL Shell PLC Sponsored ADR ($92.06) - Oil - SHEL fell to a sell signal Wednesday when it broke a double bottom at $90 amid a broad selloff in energy stocks. The technical picture for SHEL remains strong, however, as the stock is a 5 for 5'er that ranks in the top half of the favored oil sector matrix. From here, the next level of support sits at $89. |
| SPHR Sphere Entertainment Co. ($130.69) - Leisure - SPHR broke a double top at $132 for a third buy signal and to mark a new all-time chart high. The stock has been a 5 for 5'er since September 2025 and currently ranks as the top stock within the Leisure sector matrix. Okay to consider here on the breakout. Initial support lies at $124, while additional can be found at $106. |
| VLO Valero Energy Corp ($241.05) - Oil Service - VLO fell to a sell signal Wednesday when it broke a double bottom at $232, where it now sits against support. The outlook for VLO remains decidedly positive, however, as it is a 5 for 5'er that ranks in the top third of the oil service sector matrix. |
| XOM Exxon Mobil Corporation ($155.83) - Oil - XOM fell to a sell signal Wednesday when it broke a triple bottom at $158 and continued lower violating additional support when it hit $154. The outlook for the stock remains favorable, however, as XOM is a 5 for 5'er that ranks in the top third of the favored oil sector matrix. From here, the next level of support sits at $148. |
| Name | Option Symbol | Action | Stop Loss |
|---|---|---|---|
| UBS AG (Switzerland) ADR - $41.00 | O: 26H40.00D21 | Buy the August 40.00 calls at 3.70 | 36.00 |
| Name | Option | Action |
|---|---|---|
| The TJX Companies, Inc. ( TJX) | Jul. 160.00 Calls | Initiate an option stop loss of 6.80 (CP: 8.80) |
| Target Corporation ( TGT) | May. 115.00 Calls | Raise the option stop loss to 7.35 (CP: 9.35) |
| Merck & Co., Inc. ( MRK) | Jun. 115.00 Calls | Raise the option stop loss to 9.60 (CP: 11.60) |
| Archer-Daniels-Midland Company ( ADM) | May. 65.00 Calls | Stopped at 6.70 (CP: 6.60) |
| Cisco Systems, Inc. ( CSCO) | Jul. 77.50 Calls | Raise the option stop loss to 6.25 (CP: 8.25) |
| Name | Option Symbol | Action | Stop Loss |
|---|---|---|---|
| Cognizant Technology Solutions - $61.40 | O: 26U62.50D18 | Buy the September 62.50 puts at 6.60 | 67.00 |
| Name | Option | Action |
|---|---|---|
|
|
||
| Name | Option Sym. | Call to Sell | Call Price | Investment for 500 Shares | Annual Called Rtn. | Annual Static Rtn. | Downside Protection |
|---|---|---|---|---|---|---|---|
| Hewlett Packard Enterprise Company $ 24.63 | O: 26E24.00D15 | May. 24.00 | 24.70 | $ 11,557.75 | 27.21% | 27.21% | 6.41% |
| Name | Action |
|---|---|
| Fortinet Inc. ( FTNT) - 83.72 | Sell the May 85.00 Calls. |
| Palantir Technologies Inc. Class A ( PLTR) - 150.07 | Sell the July 150.00 Calls. |
| Name | Covered Write |
|---|---|
| Dell Technologies Inc Class C ( DELL - 177.69 ) | May 170.00 covered write. |
| Exxon Mobil Corporation ( XOM - 163.91 ) | July 165.00 covered write. |
| CF Industries Holdings, Inc. ( CF - 133.78 ) | May 135.00 covered write. |
| Devon Energy Corporation ( DVN - 49.95 ) | May 50.00 covered write. |
Daily Equity & Market Analysis
LISTEN TO PODCAST
Apr 02, 2026
Loading, Please Wait...
