
The continued downside and technical deterioration witnessed in indices and stocks last week have begun to show within the intermediate to long-term indicators like the bullish percents and positive trend indicators.
Friday’s (3/6) trading capped off a second week of negative action for most U.S. equity indices. The S&P 500 Index (SPX) fell over 2% last week (2/27 – 3/6), dropping the index into negative territory on a year-to-date basis, down 1.5%. Similar action transpired for the Russell 1000 (RUI), down 2% last week, and the Dow Jones Industrial Average (.DJIA), down 3%, bringing both into negative territory on a year-to-date basis. Even after falling more than 3% and 4% last week the S&P 500 Equal Weight Index (SPXEWI) and Russell 2000 (RUT) are the only indices that maintain positive year-to-date performance (through 3/6).

The continued downside and technical deterioration witnessed in indices and stocks last week have begun to show within the intermediate to long-term indicators like the bullish percents and positive trend indicators. While other indicator universes also saw action, the primary focus today will be on those indicators within NYSE universe.
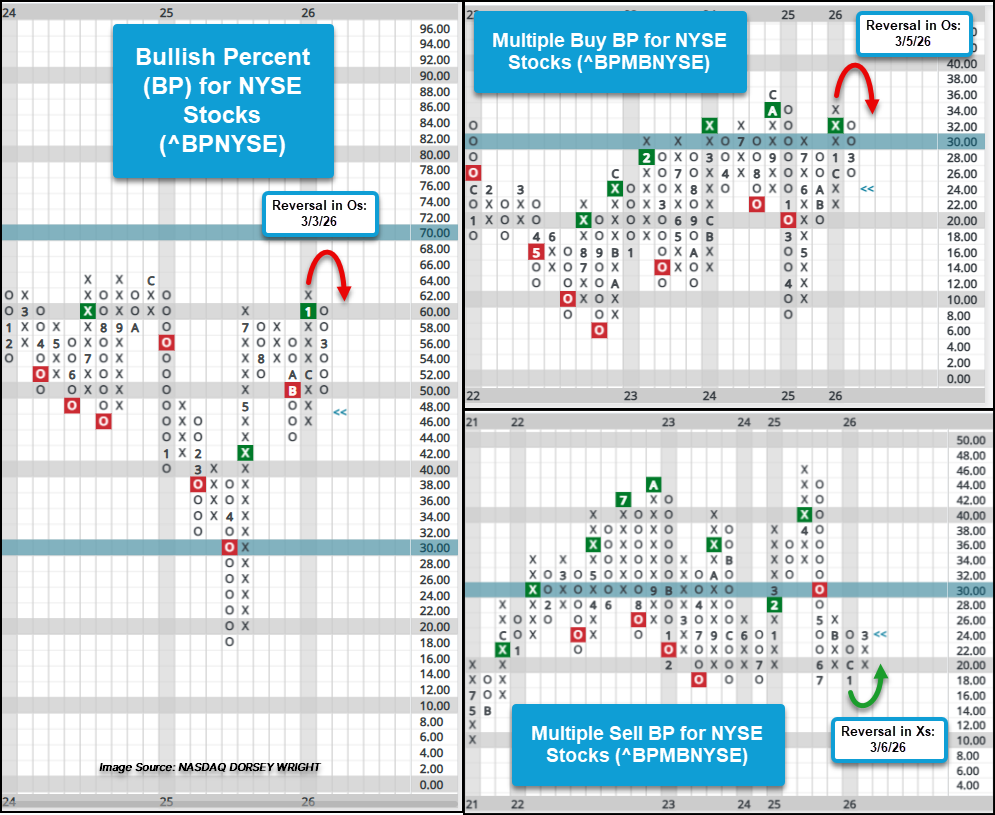
Likely the most notable indicator shift last week was the reversal down and move below 50% for the bullish percent for the NYSE (^BPNYSE). After reversing down from the January high mark of 62% to 54% following trading on Tuesday, March 3rd, Friday’s (3/6) trading brought the chart down to 50% with the actual indicator reading dipping below at 48.14%. This suggests that now less than half of the roughly 1800+ stocks maintain a point and figure buy signals.
Along with the bullish percent, which measures the percentage of stocks that have given a single point and figure buy signal, the multiple buy signal bullish percent for the NYSE (^BPMBNYSE) reversed into Os during last week’s trading. For those not familiar with the multiple buy indicators they measure the percentage of stocks that maintain two or more point and figure buy signals. The reversal down suggests that stocks that had even maintained a series of buy signals ended that string of buy signals with last week’s trading. Now less than 1 out of every 4 stocks that maintained consecutive buy signals continue to do so.
Last week’s trading brought about a reversal higher for the multiple buy signals bullish percent sibling indicator, the multiple sell signals BP for the NYSE. Rather than measuring the percentage of stocks maintaining two or more buy signals, the multiple sell signals BP measures the percentage of stocks that maintain two or more sell signals. The reversal higher to 24% on the chart and an actual reading of 25% suggests that 1 out of 4 stocks of the roughly 1800+ names within the NYSE universe maintain multiple sell signals.
The combination of all three aforementioned BPs seeing reversal highlights a notable shift in participation, impacting the intermediate-term outlook and noting a shift to a defensive posture.
While the longer-term positive trend indicator for the NYSE universe continues to maintain a column of Xs since mid-January at 62%, the reading for the indicator has fallen back to 54.48% as of Friday’s (3/6) close. This places the indicator within one box of reversing down into Os and suggests that along with seeing some stocks give consecutive sell signals, the downside action has been enough to shift trends to from positive to negative. Even with a potential reversal into Os in the offing, the long-term PT for the NYSE will maintain above the important 50% threshold. A move below 50% on the PTNYSE chart would indicate less than half of the stocks within the universe maintain a positive trend and would further a defensive posture for domestic equities.

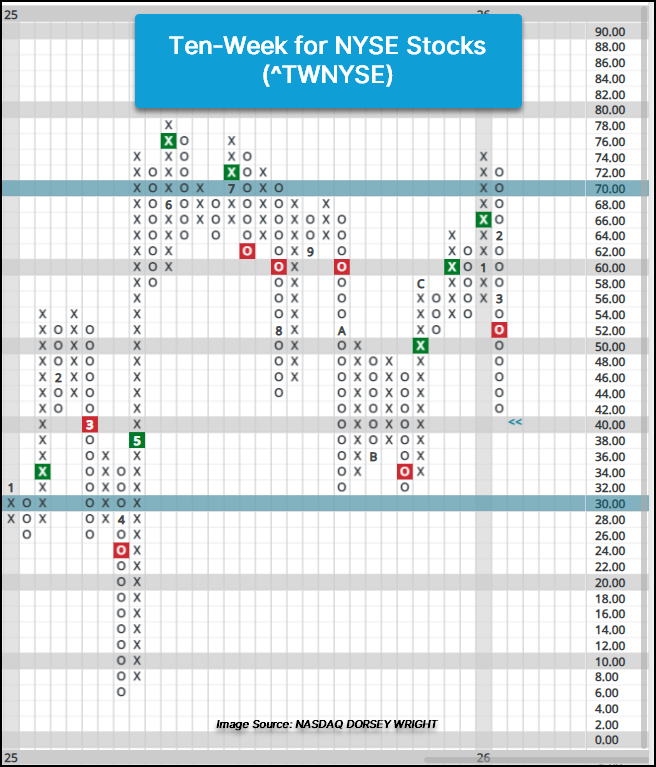
Though intermediate and long-term technical indicators have seen movement lower, they are all considered to be in the “middle of the playing field” and have not quite reached a low, or washed out, level, indicating a full defensive posture shift to equity exposure. Short-term indicators like the 10-week (^TWNYSE) and weekly distribution (^WDNYSE) have fallen to their lowest levels since November of last year. The 10-week’s (^TWNYSE) current chart reading of 42% as of Friday’s (3/6) suggests roughly four out of every 10 stocks maintain above their 50-day moving average, which is above the October and November 2025 chart lows at 32% and the April 2025 lows of 4% (last visit to “washed out” territory).
The weekly distribution indicator for the NYSE universe (^WDNYSE), which measures the average overbought/oversold reading, has fallen to oversold territory at -10%. This is well above the November and April 2025 chart lows of -28% and -78% oversold and helps provide context to how investors may approach U.S. equity exposure.
The recent downturn in the indicators provides a call to action to evaluate U.S. equity exposure, and should a position be seeing sell signals and violations of key support or long-term trendlines it may warrant lightening up on exposure or selling, depending on the level of technical deterioration. For positions that may not have witnessed the level of technical deterioration like those that have contributed to indicators moving lower, NDW users should look at the alerts system for either technical breakdown or price alerts for positions that may be closely monitored.

