Most Requested Symbols

The dollar has widespread implications for global markets, and when the greenback does move, its trends often last for a while, making its recent move extremely notable.
While the equal-weight has a good year, the cap-weight is roaring back with a vengeance.
Weekly Rundown Video – April 8, 2026
Weekly rundown with NDW analyst team covering all major asset classes.
Weekly rundown with NDW analyst team covering all major asset classes.
The dollar (DX/Y]) has widespread implications for global markets, and when the greenback does move, its trends often last for a while, making it worth monitoring for most serious investors. However, recent action has been an exception to the currency’s usual consistency. After completing its fifth consecutive sell signal, the dollar reversed higher, breaking a double top at $100.50 as the market experienced a flight to safety. Since then, tensions in Iran have subsided, leaving the greenback to move lower and return to a sell signal. The dollar has now repeatedly tested resistance in the $100 to $101.50 range, only to reverse lower each time over the last year. Interestingly, the dollar saw extremely consistent support around the $101 to $100 level during 2023 and 2024, which appears to now be serving as resistance as well. If the dollar is truly going to turn a new corner and rebound, it will have to push through significant resistance around those levels. Meanwhile, the currency is without support until $96, leaving the path of least resistance to the downside for the time being. That said, the dollar would also initiate a shakeout pattern if it reversed back into Xs.

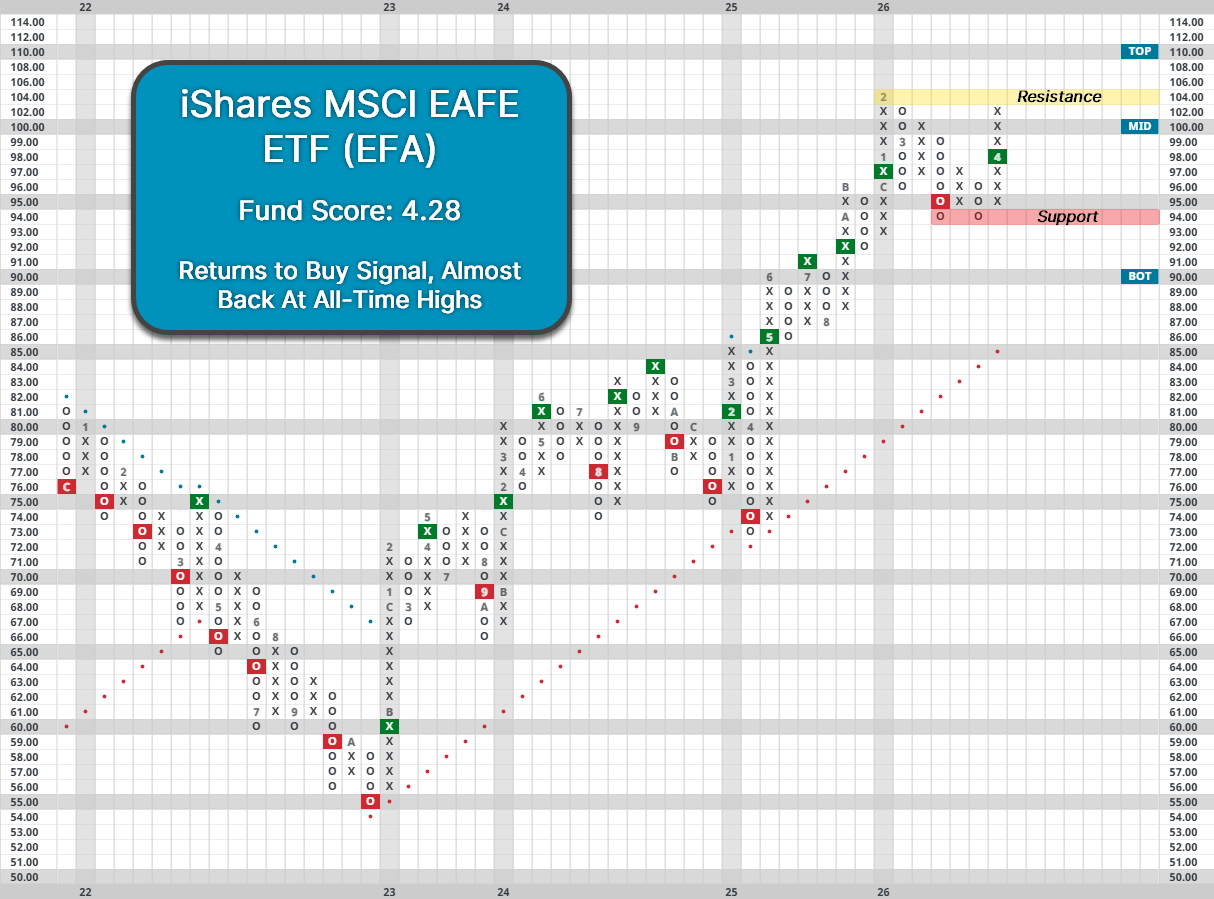
A decline in the dollar makes international equities and commodities worth more when converted into US dollars, so a falling dollar environment is relatively beneficial for the two asset classes. Conversely, a rising dollar serves as a headwind for international stocks and commodities, making domestic equities relatively more attractive in dollar terms. With the dollar back on the decline, international equities could continue to benefit, with the most international indices already reversing higher. The iShares MSCI EAFE ETF (EFA) previously moved to its first sell signal since last April, falling into correction territory. However, recent action has seen EFA move back to a buy signal while it’s one box away from matching previous all-time highs. EFA holds a solid fund score of 4.28, but that still lags 0.19 points behind the average fund score of the US Core Equity (S&P 500 Index funds) group.
Within international equities, emerging markets continue to demonstrate more relative strength than developed regions. The group saw even more downside than developed markets during the peak of the Iran conflict. The iShares MSCI Emerging Markets ETF (EEM) fell as much as 13.5%, entering correction territory as well. However, the group never moved to a sell signal and has since reversed sharply higher into a column of Xs. While developed markets have put on a solid performance over the last year and a half, it’s been emerging markets that have stolen the spotlight. EEM has gained 46% since the start of 2025, compared to 36% for EFA over that same period. Overall, emerging markets are a higher relative strength area, with EEM holding an extremely strong fund score of 5.47, which is a full point higher than the US Core Equity group.

With the global economy holding up while the dollar falls, international equities could put together a strong finish to 2026, especially if global conflict is resolved. The group continues to sit at the top of DALI ahead of domestic equities. Meanwhile, emerging markets should be a point of emphasis within its broader asset class given its relative strength.

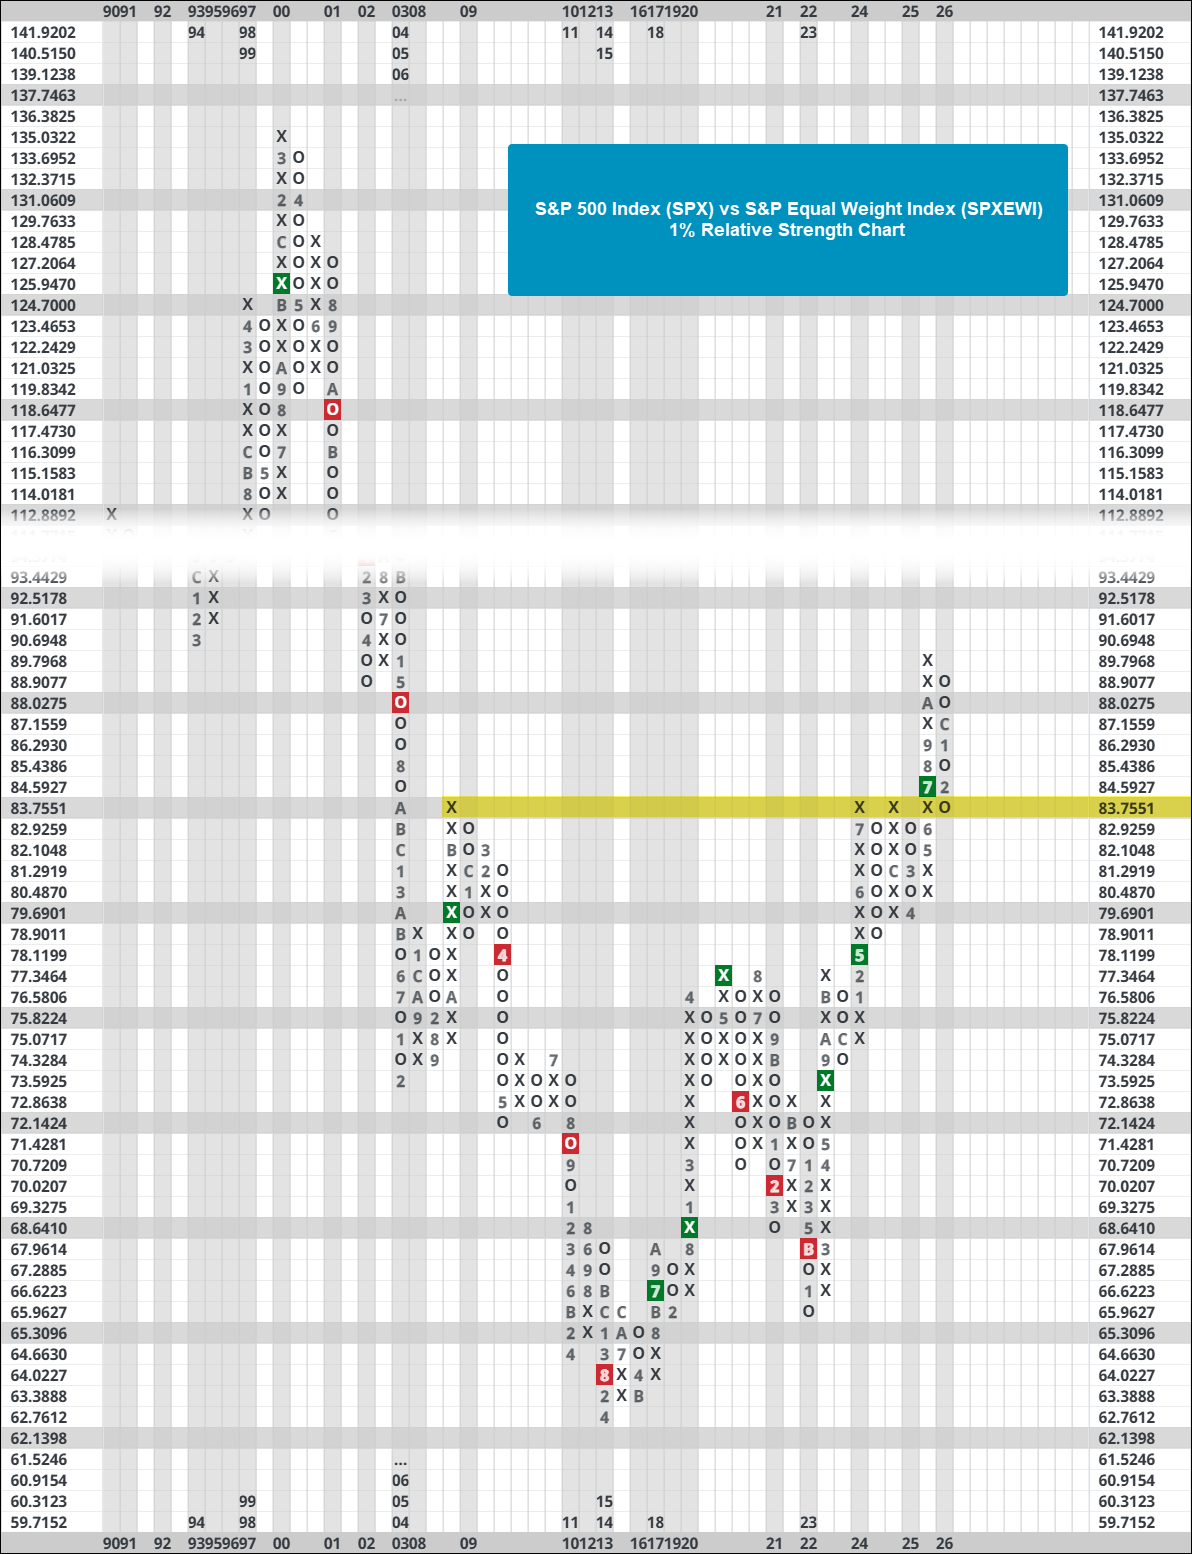
This year, despite the volatility, equal-weight market representatives have done well relative to their cap-weight counterparts. Since 2022, the S&P 500 Index (SPX) has been on an unrelenting onslaught over the S&P Equal Weighted Index (SPXEWI). Entering the year, SPX had outperformed SPXEWI by more than 40% over the last three years, a feat that was last done in the late 1990s. This three-year performance spread has fallen to just under 30% in April, which is still historically elevated. However, our data set is confined to the early 90s through today, a small sample size to make any assumptions about the mean reversion tendencies of the rolling three-year performance spread between SPX and SPXEWI. While we did see eventual market leadership from SPXEWI during the aughts after SPX first outperformed SPXEWI over a three-year period ending in early 1999, it still took over a year before cap-weight dominance truly subsided. It is certainly not out of the question that the recent outperformance from SPXEWI over SPX is a brief break in a long-term trend of relative strength for SPX.

There is plenty of supporting evidence that the recent strength in equal-weight has yet to challenge cap-weight. On the SPX vs SPXEWI 1% relative strength chart, it still trades on a buy signal, which favors SPX on a long-term basis. The relative strength chart is in a column of Os, but the SPX only needs to outperform the SPXEWI by 1% from current levels to reverse back into Xs. If that were to happen, the cap-weight would be back in the driver’s seat on both long-term and short-term time frames. Interestingly, the reversal into Os brought the RS chart back to a prior area of resistance that is seemingly acting as new support. While we don’t necessarily view support and resistance the same way for trend charts compared to relative strength charts, it’s not something to write off completely for RS charts. Another important note on the RS chart is that it is still over 60% off its March 2000 high. As mentioned earlier, we’re looking at a small sample size of total market history. Nonetheless, be aware that the trend of cap-weight strength has and can continue to march on.
Looking at a more focused picture of the largest market-cap stocks, the iShares Top 20 U.S. Stocks ETF (TOPT) initiated a shakeout pattern last week and is just a few boxes away from completing the pattern. For those unfamiliar with the shakeout pattern, it is a chart pattern where a security in a positive trend forms a double top at a high, then reverses to give a sell signal (shaking out the weak holders), and then resumes the uptrend with a fresh buy signal upon a break of the double top. Second, TOPT still has an acceptable fund score of 3.41 after falling from near-perfect status at the end of last year. TOPT is a newer fund that launched near the end of 2024 and could be a good representative to watch for emerging weakness or strength in the largest stocks in the market. Overall, it is still technically sound, as is SPX over SPXEWI on a long-term relative strength basis. While we have seen equal weight representatives pick up in 2026, they still have a long way to go before dismantling cap-weight from the top spot.

Average Level
13.68
| < - -100 | -100 - -80 | -80 - -60 | -60 - -40 | -40 - -20 | -20 - 0 | 0 - 20 | 20 - 40 | 40 - 60 | 60 - 80 | 80 - 100 | 100 - > |
|---|---|---|---|---|---|---|---|---|---|---|---|
|
Buy signalEEM
|
|||||||||||
|
Buy signalIJH
|
|||||||||||
|
Buy signalefa
|
|||||||||||
|
Buy signalSPY
|
|||||||||||
|
Buy signalfxe
|
|||||||||||
|
Buy signalicf
|
|||||||||||
|
Buy signalgld
|
Sell signaldia
|
Buy signalVOOG
|
|||||||||
|
Sell signalagg
|
Buy signalrsp
|
Sell signalQQQ
|
|||||||||
|
Buy signalshy
|
Sell signaldx/y
|
Buy signalVOOV
|
Buy signalONEQ
|
||||||||
|
Buy signaltlt
|
Sell signallqd
|
Buy signalhyg
|
Buy signaliwm
|
Buy signalGCC
|
|||||||
|
Sell signalief
|
Buy signaldvy
|
Sell signalXLG
|
Buy signalijr
|
Buy signalGSG
|
Sell signalUSO
|
||||||
| < - -100 | -100 - -80 | -80 - -60 | -60 - -40 | -40 - -20 | -20 - 0 | 0 - 20 | 20 - 40 | 40 - 60 | 60 - 80 | 80 - 100 | 100 - > |
| AGG | iShares US Core Bond ETF |
| USO | United States Oil Fund |
| DIA | SPDR Dow Jones Industrial Average ETF |
| DVY | iShares Dow Jones Select Dividend Index ETF |
| DX/Y | NYCE U.S.Dollar Index Spot |
| EFA | iShares MSCI EAFE ETF |
| FXE | Invesco CurrencyShares Euro Trust |
| GLD | SPDR Gold Trust |
| GSG | iShares S&P GSCI Commodity-Indexed Trust |
| HYG | iShares iBoxx $ High Yield Corporate Bond ETF |
| ICF | iShares Cohen & Steers Realty ETF |
| IEF | iShares Barclays 7-10 Yr. Tres. Bond ETF |
| LQD | iShares iBoxx $ Investment Grade Corp. Bond ETF |
| IJH | iShares S&P 400 MidCap Index Fund |
| ONEQ | Fidelity Nasdaq Composite Index Track |
| QQQ | Invesco QQQ Trust |
| RSP | Invesco S&P 500 Equal Weight ETF |
| IWM | iShares Russell 2000 Index ETF |
| SHY | iShares Barclays 1-3 Year Tres. Bond ETF |
| IJR | iShares S&P 600 SmallCap Index Fund |
| SPY | SPDR S&P 500 Index ETF Trust |
| TLT | iShares Barclays 20+ Year Treasury Bond ETF |
| GCC | WisdomTree Continuous Commodity Index Fund |
| VOOG | Vanguard S&P 500 Growth ETF |
| VOOV | Vanguard S&P 500 Value ETF |
| EEM | iShares MSCI Emerging Markets ETF |
| XLG | Invesco S&P 500 Top 50 ETF |

| Symbol | Company | Sector | Current Price | Action Price | Target | Stop | Notes |
|---|---|---|---|---|---|---|---|
| CGON | CG Oncology, Inc. | Biomedics/Genetics | $67.68 | hi 50s - low 60s | 80 | 50 | 5 for 5'er, 18 of 162 in BIOM sector matrix, bullish catapult, good R-R, Earn. 5/7 |
| CNX | CNX Resources Corp | Oil | $39.29 | hi 30s - mid 40s | 71 | 33 | 5 TA rating, top 50% of OIL sector matrix, LT RS buy and pos trend, consec buy signals, Earn. 4/30 |
| INVA | Innoviva, Inc | Drugs | $23.95 | lo-mid 20s | 32.50 | 18.50 | 5 TA rating, top half of drugs sector RS matrix, LT pos trend, LT RS buy, buy-on-pullback, Earn. 5/6 |
| GSK | GlaxoSmithKline Plc. (United Kingdom) ADR | Drugs | $58.94 | hi 40s - mid 50s | 67 | 42 | 5 TA rating, top 25% of DRUG sector matrix, LT pos trend, yield > 3%, buy-on-pullback, Earn. 4/29 |
| ADI | Analog Devices, Inc. | Semiconductors | $350.01 | 310s - 330s | 380 | 268 | 4 for 5'er, top half of favored SEMI sector matrix, LT pos market RS, return to buy signal |
| CSCO | Cisco Systems, Inc. | Computers | $82.35 | Upper 70s to lower 80s | 96 | 70 | 5 for 5'er; top quintile of Computers matrix; Pos. Trend since Sept. '24; Bull Triangle on 3/25. |
| CAT | Caterpillar, Inc. | Machinery and Tools | $791.73 | 680s - 720s | 848 | 592 | 5 for 5'er, top 10% in favored MACH sector matrix, LT pos peer & mkt RS, buy on pullback, Earn. 4/30 |
| DBD | Diebold Nixdorf Inc | Finance | $85.40 | low-to-mid 70s | 99 | 63 | 5 for 5'er, #3 of 77 in FINA sector matrix, LT pos peer RS, bearish signal reversal, R-R>2.0, Earn. 4/30/b> |
| NI | Nisource, Inc. | Gas Utilities | $47.19 | mid-hi 40s | 78 | 38 | 5 TA rating, LT pos trend, LT mkt RS buy, consec buy signals, Earn. 5/6 |
| FHI | Federated Hermes Inc | Wall Street | $56.30 | 54-hi 50s | 91 | 46 | 5 TA rating, top 25% of WALL sector RS matrix, LT pos trend and mkt RS buy, consec buy signals, good R-R, Earn. 4/30 |
| CRS | Carpenter Technology Corporation | Steel/Iron | $443.67 | hi 370s - low 400s | 500 | 348 | 5 for 5'er, top third of STEE sector matrix, LT pos peer & mkt RS, spread quintuple top, buy on pullback, Earn. 4/29 |
| COST | Costco Wholesale Corporation | Retailing | $980.85 | 944-1050s | 1296 | 832 | 4 TA rating, top 33% of retail sector matrix, LT mkt RS buy, LT pos trend, consec buy signals |
| ATRO | Astronics Corp | Aerospace Airline | $74.33 | hi 60s - mid 70s | 90 | 59 | 5 for 5'er, top 20% of AERO sector matrix, bearish signal reversal to spread triple top |
| BURL | Burlington Stores, Inc. | Retailing | $332.39 | mid 320s to 340s | 400 | 284 | 5 for 5'er; top quintile of Retail matrix; Multi-Yr High on 4/9; R-R > 4. |
| AMG | Affiliated Managers Group | Wall Street | $291.10 | 270s - 280s | 356 | 232 | 5 for 5'er, top third of WALL sector matrix, LT pos peer RS, spread triple top, Earn. 5/7 |
| ATI | ATI Inc. | Aerospace Airline | $163.78 | 150s - mid 160s | 192 | 134 | 5 for 5'er, top 10% of favored AERO sector matrix, LT pos peer & mkt RS, bullish catapult, Earn. 4/30 |
| DRS | Leonardo DRS, Inc. | Aerospace Airline | $47.43 | mid-hi 40s | 66 | 37 | 4 TA rating, top 25% of aerospace/airline sector matrix, consec buy signals, LT pos trend, Earn. 5/5 |
| Symbol | Company | Sector | Current Price | Action Price | Target | Stop | Notes |
|---|---|---|---|---|---|---|---|
| CPRT | Copart Incorporated | Autos and Parts | $33.25 | hi 30s | 28 | 42 | 1 TA rating, bottom 50% of AUTO sector matrix, NT and mkt RS sell last month, consec sell signals |
| Symbol | Company | Sector | Current Price | Action Price | Target | Stop | Notes |
|---|---|---|---|---|---|---|---|
| WBS | Webster Financial Corporation | Banks | $72.06 | hi 60s - low 70s | 91 | 58 | Removed for earnings (4/28) |
| FFIV | F5 Inc. | Internet | $298.07 | 280s - 290s | 344 | 256 | Removed for earnings (4/28) |
| ARCB | ArcBest Corp. | Transports/Non Air | $108.48 | low-to-mid 90s | 113 | 87 | Removed for earnings (4/28). Raise stop to $87 |
| Comment | |||||||
|---|---|---|---|---|---|---|---|
|
|
|||||||
DRS Leonardo DRS, Inc. ($47.46) R - Aerospace Airline - DRS has a 4 for 5 TA rating and sits in the top third of the favored aerospace airline sector RS matrix. We have seen DRS maintain a positive trend since 2023 and sit on an RS buy signal against the market since 2025. The stock pushed higher last week to notch a second consecutive buy signal, highlighting the near-term improvement. Exposure may be considered in the mid-high $40s. Our initial stop will be positioned at $37, which would violate multiple support levels. The bullish price objective of $66 will serve as our price target. Note that earnings are expected on 5/5.
| 25 | 26 | ||||||||||||||||||||||||||||
| 49.00 | X | X | 49.00 | ||||||||||||||||||||||||||
| 48.00 | X | O | X | O | X | 48.00 | |||||||||||||||||||||||
| 47.00 | 7 | O | X | O | X | X | 47.00 | ||||||||||||||||||||||
| 46.00 | X | X | O | X | O | X | O | 4 | 46.00 | ||||||||||||||||||||
| 45.00 | X | O | X | O | O | X | 3 | O | X | 45.00 | |||||||||||||||||||
| 44.00 | 6 | O | X | O | 9 | O | X | O | X | 44.00 | |||||||||||||||||||
| 43.00 | X | O | O | X | O | X | X | O | Mid | 43.00 | |||||||||||||||||||
| 42.00 | X | O | X | A | X | O | X | 42.00 | |||||||||||||||||||||
| 41.00 | X | 8 | O | X | O | X | 41.00 | ||||||||||||||||||||||
| 40.00 | X | O | X | 2 | X | 40.00 | |||||||||||||||||||||||
| 39.00 | X | O | X | O | X | 39.00 | |||||||||||||||||||||||
| 38.00 | 5 | O | X | O | 38.00 | ||||||||||||||||||||||||
| 37.00 | X | C | X | X | O | X | 37.00 | ||||||||||||||||||||||
| 36.00 | X | O | X | O | X | O | X | O | 1 | 36.00 | |||||||||||||||||||
| 35.00 | X | O | X | O | 1 | O | X | X | B | X | • | 35.00 | |||||||||||||||||
| 34.00 | B | O | O | X | 2 | X | O | X | O | X | • | 34.00 | |||||||||||||||||
| 33.00 | X | O | X | O | X | O | X | O | • | Bot | 33.00 | ||||||||||||||||||
| 32.00 | X | O | O | X | 3 | O | X | • | 32.00 | ||||||||||||||||||||
| 31.00 | X | O | X | O | X | 4 | X | • | 31.00 | ||||||||||||||||||||
| 30.00 | X | O | X | O | X | O | X | • | 30.00 | ||||||||||||||||||||
| 29.00 | X | A | O | O | O | • | 29.00 | ||||||||||||||||||||||
| 28.00 | O | X | O | X | • | 28.00 | |||||||||||||||||||||||
| 27.00 | O | X | O | X | • | 27.00 | |||||||||||||||||||||||
| 26.00 | 8 | X | 9 | • | 26.00 | ||||||||||||||||||||||||
| 25.00 | O | X | • | 25.00 | |||||||||||||||||||||||||
| 24.00 | O | X | • | 24.00 | |||||||||||||||||||||||||
| 23.00 | O | • | 23.00 | ||||||||||||||||||||||||||
| 25 | 26 |
| CG The Carlyle Group LP ($51.01) - Wall Street - CG shares moved higher today to break a double top at $51 to mark its second consecutive buy signal and the completion of a bullish catapult. This 2 for 5'er has been in a negative trend since February but on an RS buy signal versus the market since December 2023. CG shares are trading near the middle of their ten-week trading band. From here, support is offered at $47 and $46. |
| EBAY eBay Inc. ($100.56) - Retailing - EBAY broke a double top at $99 for a second buy signal as shares rallied to match the all-time chart highs at $100. The stock shifted back up to a 5 for 5'er after seeing the market RS chart shift back into a column of Xs during last week's trading. Okay to consider here on the breakout or on a pullback to the upper $90s. Initial support lies at $95, while the bullish support line sits at $89. |
| H Hyatt Hotels Corp. ($163.99) - Leisure - H broke a double top at $162 for a second buy signal in April. The stock moved up to a 5 for 5'er after shifting the trend back to positive during last week's trading, and H currently ranks within the top half of the Leisure sector matrix. Okay to consider here on the breakout. Note reistance in the lower $170s and the stock's all-time chart high at $180. Initial support lies at $150, while the bullish support line sits at $142. |
| MSFT Microsoft Corporation ($392.67) - Software - MSFT rose Tuesday to break a double top at $388 before reaching $392 intraday. This stock still has a 2 for 5 TA rating and sits in a clearly defined negative trend. However, MSFT has now ended a streak of four consecutive sell signals with this upside action. The technical picture remains weak but is showing near-term improvement. Initial support can be seen at $368 with further support seen at $360. Further overhead resistance is seen at $408 and $416. Note that earnings are expected on 4/29. |
| NFLX NetFlix Inc. ($106.07) - Media - NFLX has been slowly creeping back up towards all-time highs after withdrawing its bid for Warner Bros. The now 5/5'er has posted a string of three consecutive buy signal on its default chart, leaving support around $98 just below current levels. The stock has picked up substantial relative strength over the last few months after declining to increase its bid to keep up with (PARA)... and while overbought could be a name to add to on pullbacks for those looking for more risk within their portfolio. |
| WDC Western Digital Corporation ($365.32) - Computers - WDC rose Tuesday to break a double top at $352 before notching a new all-time high at $364 intraday. This 5 for 5'er moved to a positive trend in May 2025 and has maintained a positive trend since 2023. The stock also sits in the top decile of the computers sector RS matrix. The weight of the technical evidence is favorable and continues to improve. However, note that WDC is nearing overbought territory. Initial support can be seen at $332 with further support not seen until $280. Note that earnings are expected on 4/30. |
| WSM Williams-Sonoma, Inc. ($193.53) - Retailing - WSM broke a double top at $196 to complete a bullish catapult. The stock shifted up to a 4 for 5'er after seeing the trend chart flip back to positive. Okay to consider here on the breakout. Note resistance at $200 and $220, the February all-time chart highs. Initial support lies at $186, while the bullish support line resides at $182. |
| XOM Exxon Mobil Corporation ($149.10) - Oil - XOM gave a second consecutive sell signal Tuesday when it broke a double bottom at $150 and continued lower to $148 where it now sits against support. The outlook for XOM remains positive as it is a 5 for 5'er that ranks in the top half of the oil sector matrix. However, below $146 XOM shows no further support on its chart until $112. |

| Name | Option Symbol | Action | Stop Loss |
|---|---|---|---|
| Altria Group Inc. - $65.67 | O: 26G65.00D17 | Buy the July 65.00 calls at 3.40 | 61.00 |
| Name | Option | Action |
|---|---|---|
| General Motors ( GM) | Sep. 75.00 Calls | Initiate an option stop loss of 8.00 (CP: 10.00) |
| eBay Inc. ( EBAY) | Jul. 95.00 Calls | Initiate an option stop loss of 8.35 (CP: 10.35) |
| Delta Air Lines Inc. ( DAL) | Jul. 67.50 Calls | Initiate an option stop loss of 6.25 (CP: 8.25) |
| Name | Option Symbol | Action | Stop Loss |
|---|---|---|---|
| Pinterest, Inc. Class A - $18.67 | O: 26T19.00D21 | Buy the August 19.00 puts at 2.69 | 21.00 |
| Name | Option | Action |
|---|---|---|
| T-Mobile US Inc. ( TMUS) | Jun. 210.00 Puts | Initiate an option stop loss of 20.60 (CP: 22.60) |
| SoFi Technologies Inc. ( SOFI) | Jul. 17.00 Puts | Stopped at 18.00 (CP: 17.92) |
| Name | Option Sym. | Call to Sell | Call Price | Investment for 500 Shares | Annual Called Rtn. | Annual Static Rtn. | Downside Protection |
|---|---|---|---|---|---|---|---|
| Target Corporation $ 117.88 | O: 26G120.00D17 | Jul. 120.00 | 7.95 | $ 56,376.90 | 20.84% | 22.99% | 5.59% |
| Name | Action |
|---|---|
| Palantir Technologies Inc. Class A ( PLTR) - 132.37 | Sell the July 150.00 Calls. |
| Alcoa Inc. ( AA) - 73.31 | Sell the July 75.00 Calls. |
| Dow, Inc. ( DOW) - 40.11 | Sell the May 40.00 Calls. |
| Frontline PLC ( FRO) - 34.84 | Sell the August 40.00 Calls. |
| Name | Covered Write |
|---|---|
|
|
|
Daily Equity & Market Analysis
LISTEN TO PODCAST
May 21, 2026
Loading, Please Wait...
