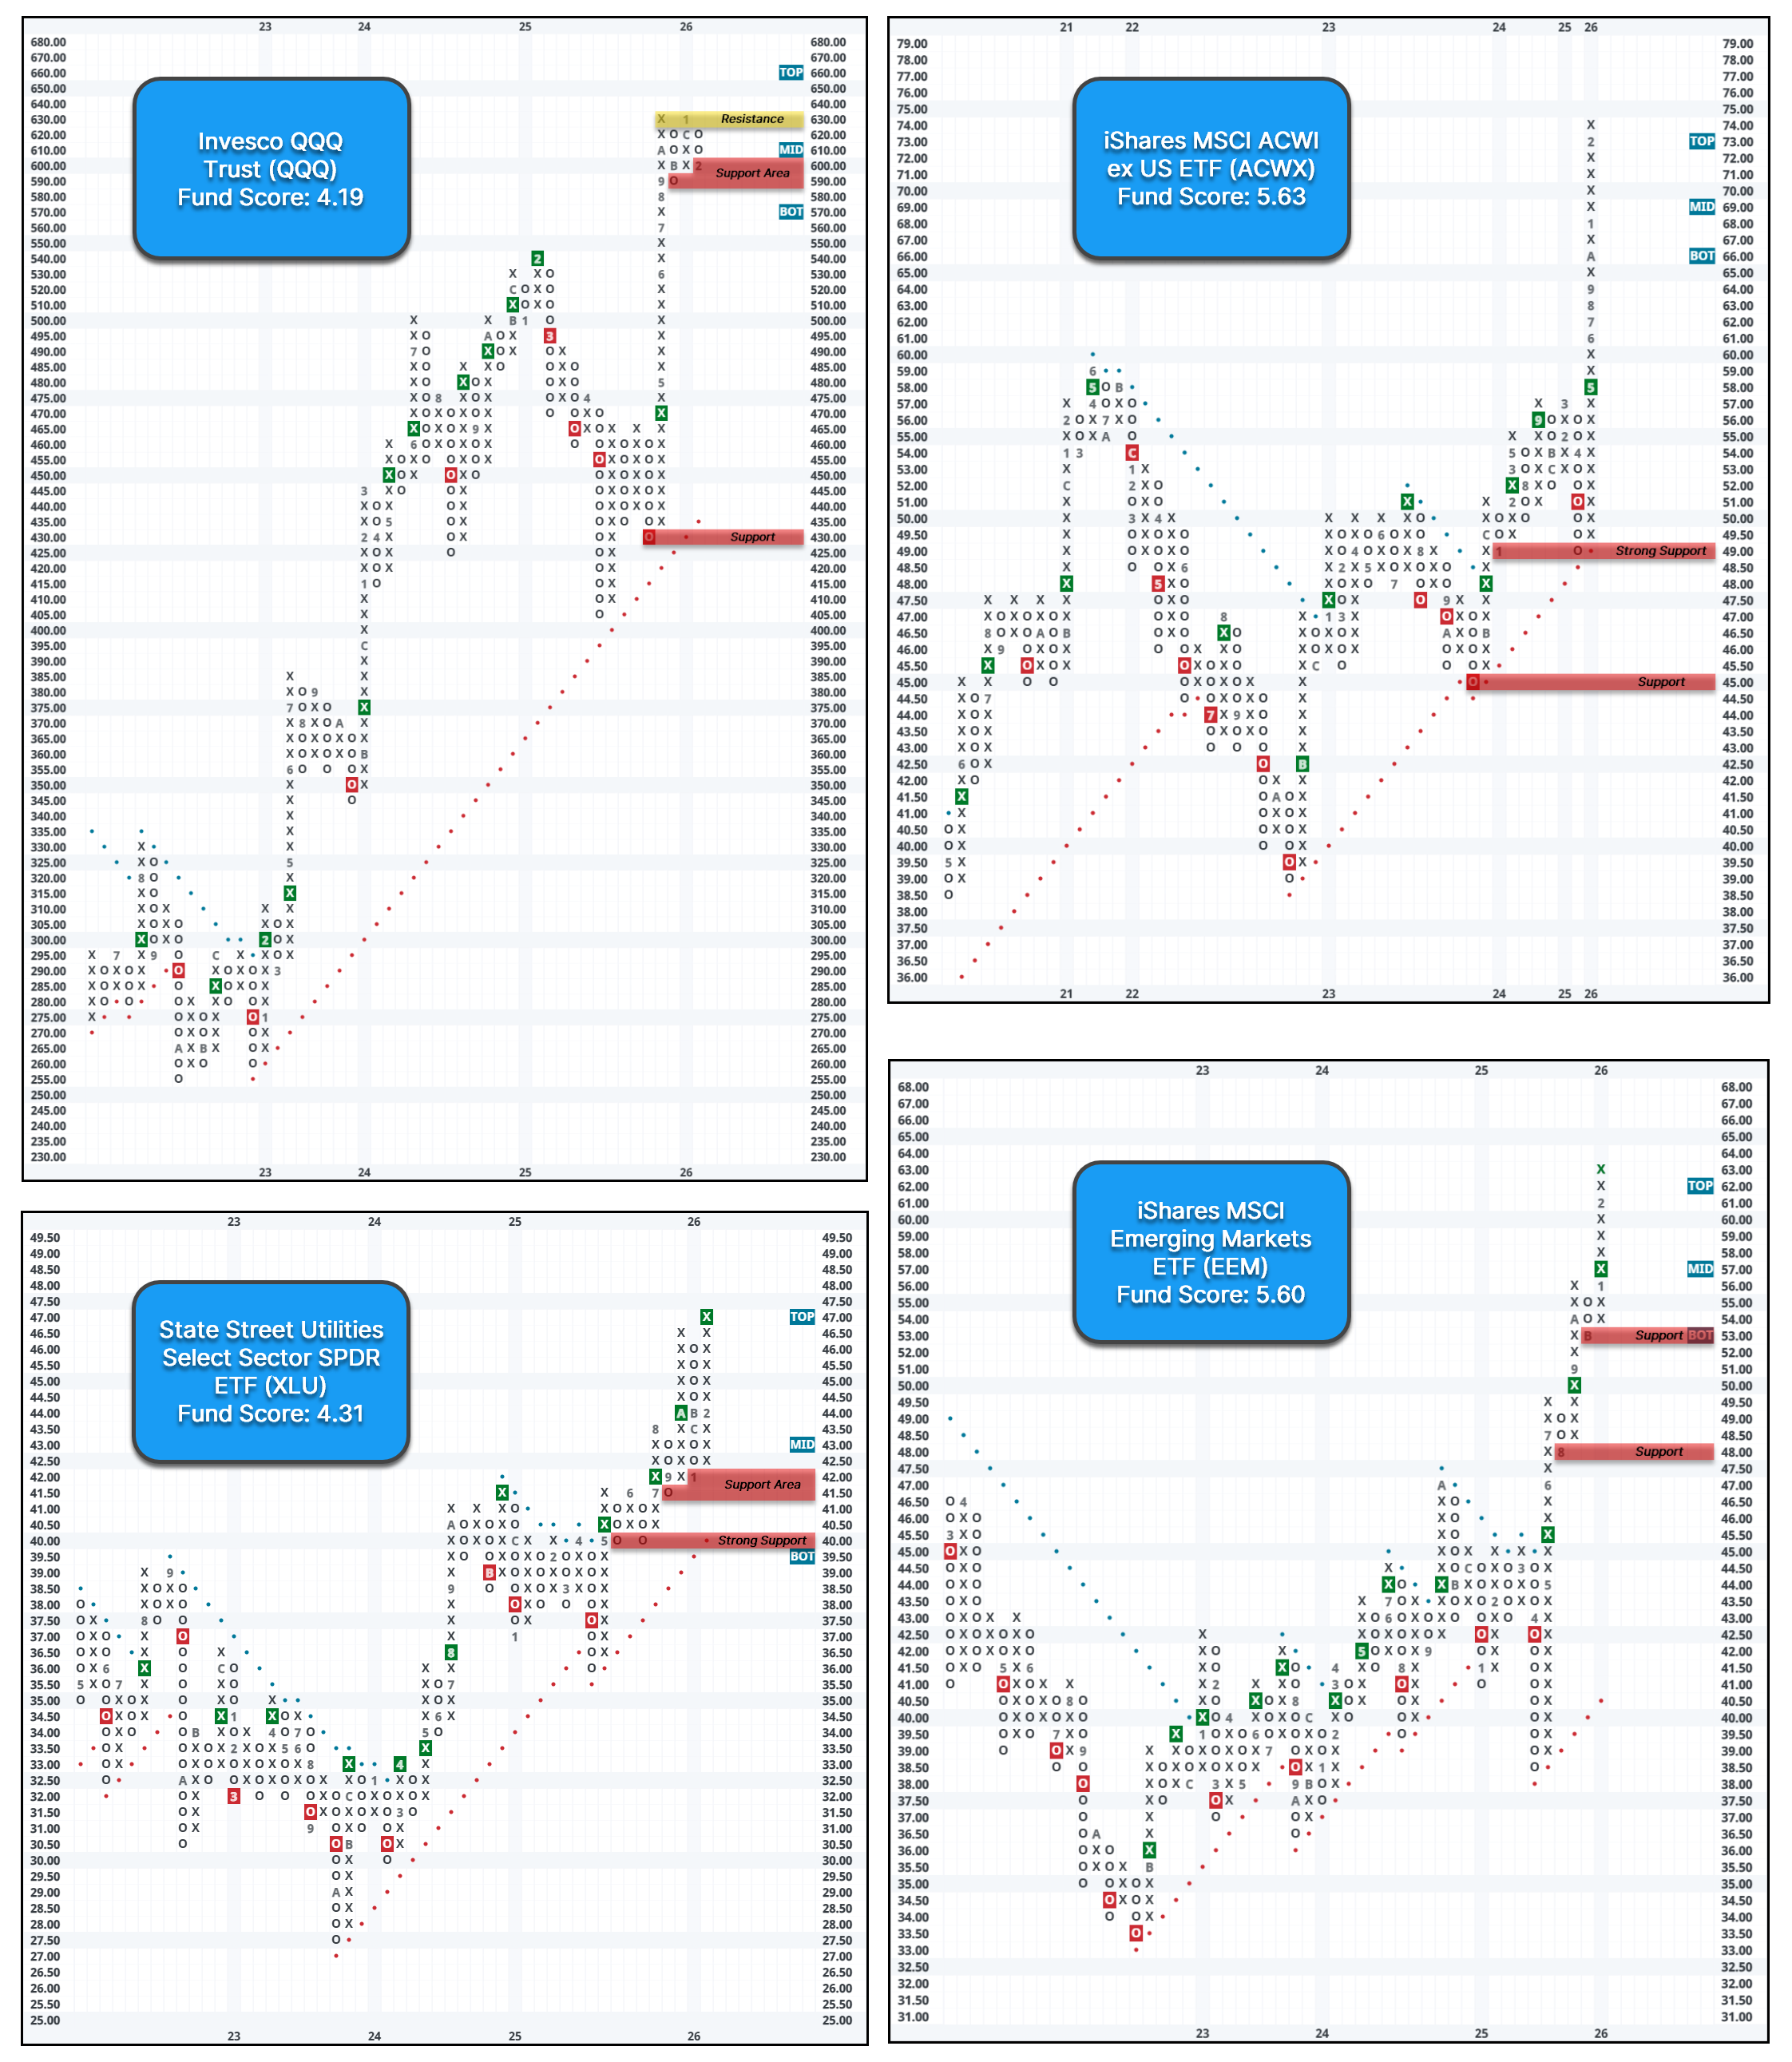
Most Requested Symbols

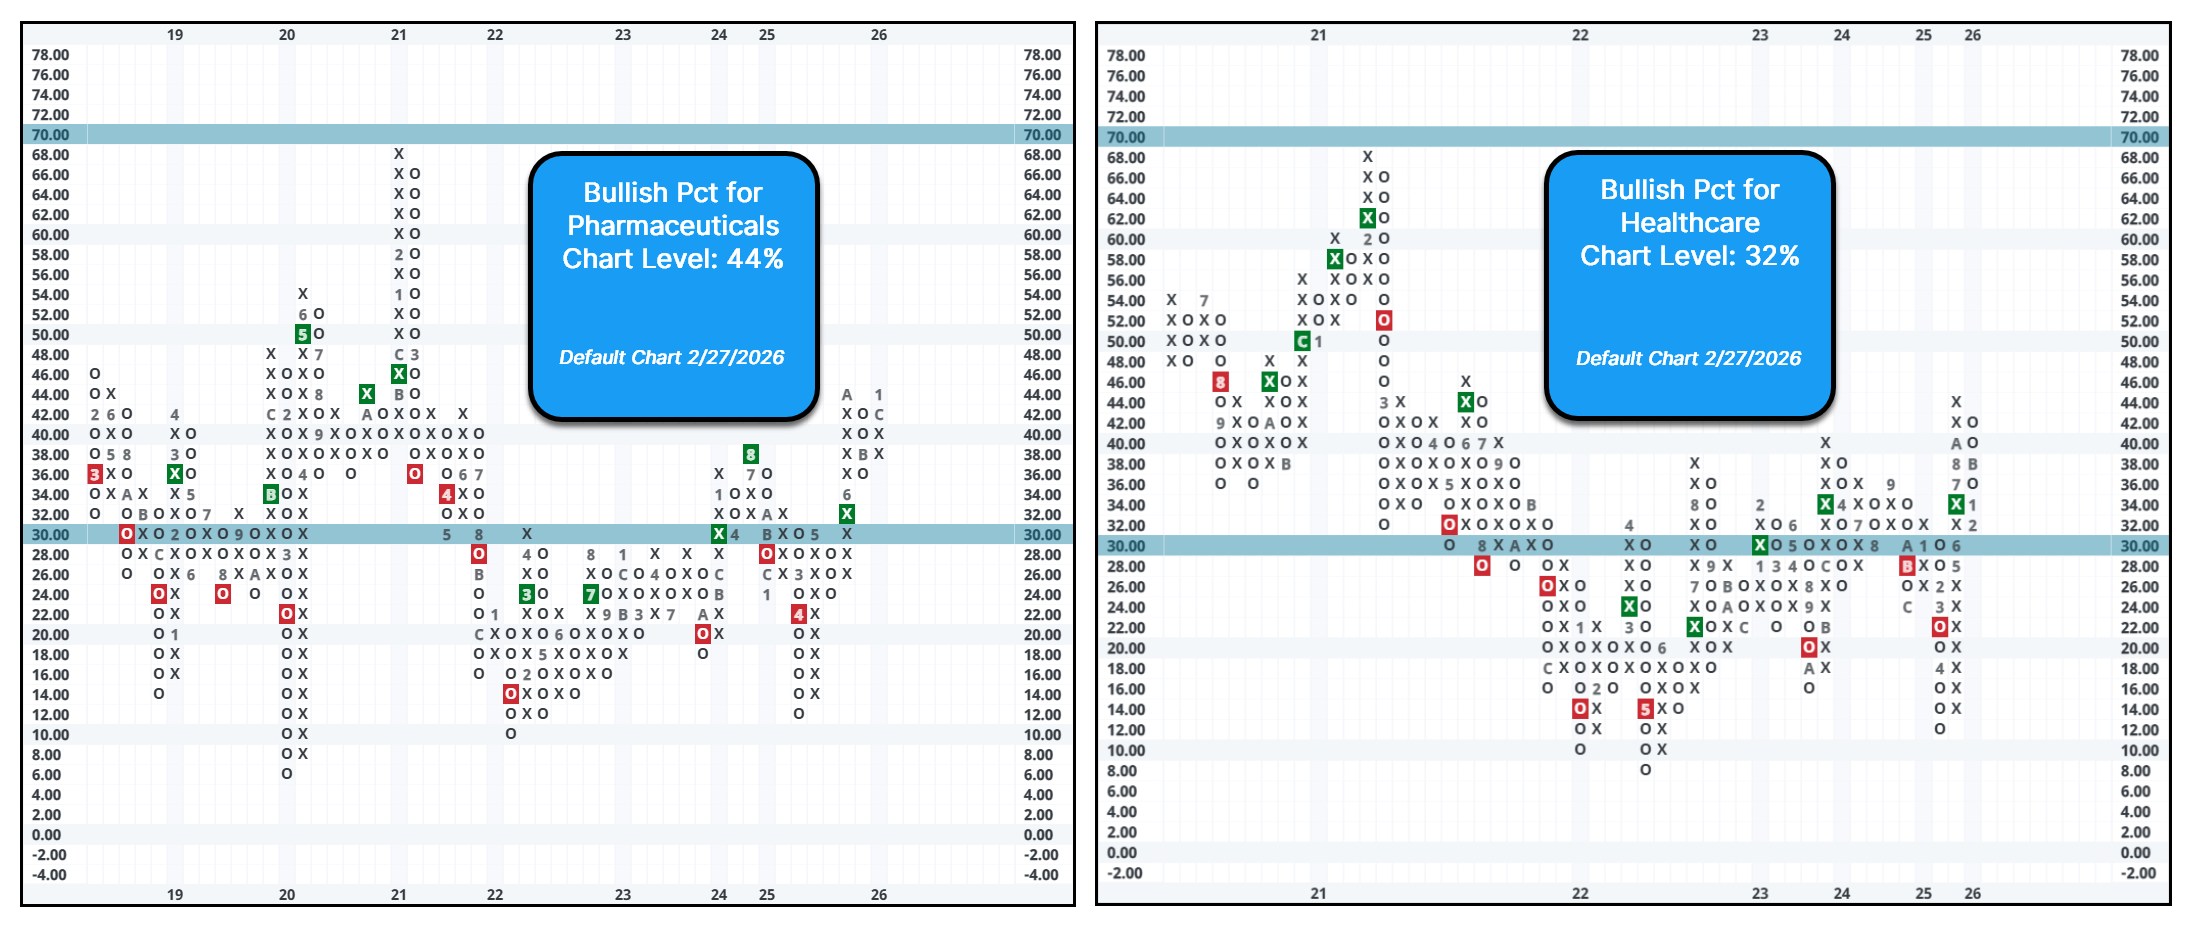
When evaluating sectors at a broad level, it’s often useful to break them down into sub‑groups to identify which underlying industries are truly driving performance. Although the healthcare sector is up slightly in 2026, the pharmaceuticals sub‑group has stood out as a clear area of strength.
With most of the S&P 500 (SPX) companies having released their 2025 Q4 earnings report, today we wanted to review how stocks behaved based on their technical rating.
Weekly Rundown Video – Feb 25, 2026
Weekly rundown with NDW analyst team covering all major asset classes.
Weekly rundown with NDW analyst team covering all major asset classes.
Beginners Series Webinar: Join us on Monday, March 2nd at 2 PM (ET) for our NDW Beginners Series Webinar. This week's topic is: Navigating the Models Page. Register Here
When evaluating sectors at a broad level, it’s often useful to break them down into sub‑groups to identify which underlying industries are truly driving performance. Although the healthcare sector is up slightly in 2026, the pharmaceuticals sub‑group has stood out as a clear area of strength. The pharmaceutical proxy IHE currently shows a fund score roughly 1.9 points higher than the broader healthcare benchmark XLV and has outperformed it by more than 4.5% year-to-date (YTD).
Going a step further, we can use the technical indicators report to sharpen our view of relative strength within each group. By examining the Bullish Percent Index—an intermediate‑term participation indicator that tracks the percentage of stocks in a universe trading on a PnF buy signal—we can quickly identify which group is exhibiting stronger intermediate-term strength. The bullish percent for healthcare (^BPECHEALTH) reversed into Os late last year and has continued to tick lower, now sitting at chart level of 32%, indicating that fewer than one‑third of the sector’s stocks remain on buy signals. In contrast, the pharmaceuticals bullish percent (BPECDRUGS) reversed into Xs at the end of last year and currently holds at chart level of 44%, roughly 12 percentage points higher than the broader healthcare sector’s bullish percent reading.
If you are looking to allocate into the pharmaceuticals sub-sector, you could consider the U.S. Pharmaceuticals ETF (IHE), which provides exposure to pharmaceutical manufacturers and holds notable weight in companies like Eli Lilly (LLY), Johnson & Johnson (JNJ), and Merck & Co (MRK). IHE maintains a strong fund score of 5.57, with a score direction of 2.87. The fund is coming off a strong 29% return in 2025 and is up 6% year-to-date near, over 5% more than the broader S&P 500 market. Additionally, the fund offers a yield of 1.7%. Given the normalization of the 10-week trading band and the weight of the evidence, long exposure can be made here. IHE trades near all-time high territory, with no current overhead resistance. Initial support at $82, with additional support at $73.

If you want to take a more active approach and invest in individual technically acceptable names in the pharmaceutical/drugs sector, you could consider buying Merck & Co., Inc. (MRK) on a pullback. The stock sits on three consecutive buy signals and is up over 65% from its 2025 low of 74$. The 5 for 5’er moved up from a 4 earlier in February, after returning to a buy signal against the market, and sits in the top quintile of the drugs sector matrix. Additionally, the stock offers a yield of 2.7%. The weekly OBOS indicates that the stock is in overbought territory, so wait for the 10-week trading band to normalize before considering. Initial strong support is at $97, with additional support at $94.


With a majority of the S&P 500 (SPX) companies having released their 2025 Q4 earnings report, today we wanted to review how stocks behaved based on their technical rating. For instance, did stocks with a high technical attribute (TA) rating beat fundamental analyst estimates more frequently than low TA stocks? Did high TA stocks behave better on their earnings date compared to low TA stocks? Were there more technical upgrades in certain sectors compared to others?
Before answering these questions, we should first give a brief overview of our ratings for those unfamiliar. Note that we will often use the terms technical attribute, attribute, and rating interchangeably. If you are a veteran, go ahead and skip to the “High Attributes vs Low Attributes on Estimates” section.
For those still reading, every stock on our system is assigned a rating that ranges from 0 to 5. Stocks with an attribute of 2 or below are considered technically weak and consequently, carry a sell rating. Stocks with a 3 rating are considered a hold, and those with a 4 or 5 attribute are given buy and strong buy ratings, respectively. Our studies show that high rated stocks, which carry a 3 technical attribute or better, have historically outperformed stocks with low technical attribute ratings. Academics attribute this success to the momentum factor. It is a weird phenomenon, but it is as simple as stocks that have gone up the most in the past tend to keep going up the most in the future.
By no means did we discover momentum — we merely provide an objective and quantifiable means to access the factor via our technical attributes. These ratings were not built with the intention of chasing near-term alpha nor should they be heavily relied upon for short-term trading; however, closely rated stocks tend to behave similarly in certain seasons — one of them being earnings season.
High Attributes vs Low Attributes on Estimates
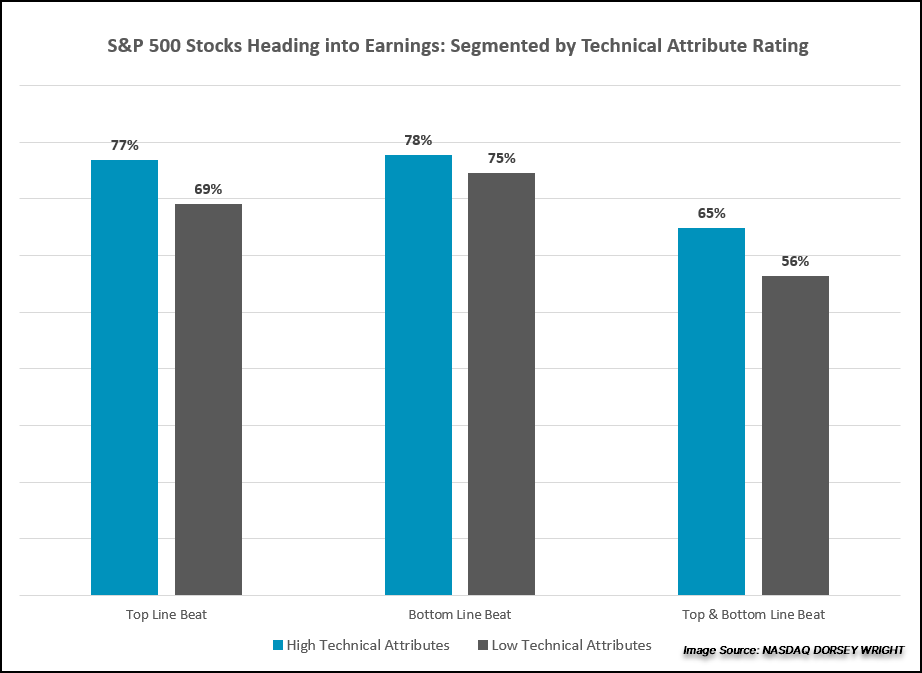
More stocks rated as a hold, buy, or strong buy (high technical attribute, 3+) heading into this earnings season beat fundamental analyst expectations compared to stocks rated as a sell (weak technical attribute, 2 or lower). In fact, 77% of high technical attribute stocks beat top line mean fundamental analyst estimates sourced by FactSet and 78% beat bottom line estimates. Conversely, just 69% of low attribute stocks beat top line estimates and 75% beat bottom line estimates.
The overall percentages/trends for Q4 2025 were lower compared to the prior two quarters of 2025. The notable change came from the decrease in beat rates from high technical names quarter over quarter. Top line beats for high attribute names fell from 83% (Q3) to 77% and bottom line beats dropped from 85% (Q3) to 78%, bringing the overall percentage of top and bottom line beats down from 73% (Q3) to 65%. Meanwhile, lower technical attribute names were roughly in line quarter over quarter. The decrease in overall beat rates across the board has returned closer to historic norms, suggesting at a minimum a change in investor expectations from Q3 to Q4. While there are various reasons for the shift, some of which will be touched on in the sector coverage below, uncertainty around tariffs, interest rate expectations, and the geopolitical landscape continue to be notable themes among companies seeing shifts in technical strength.
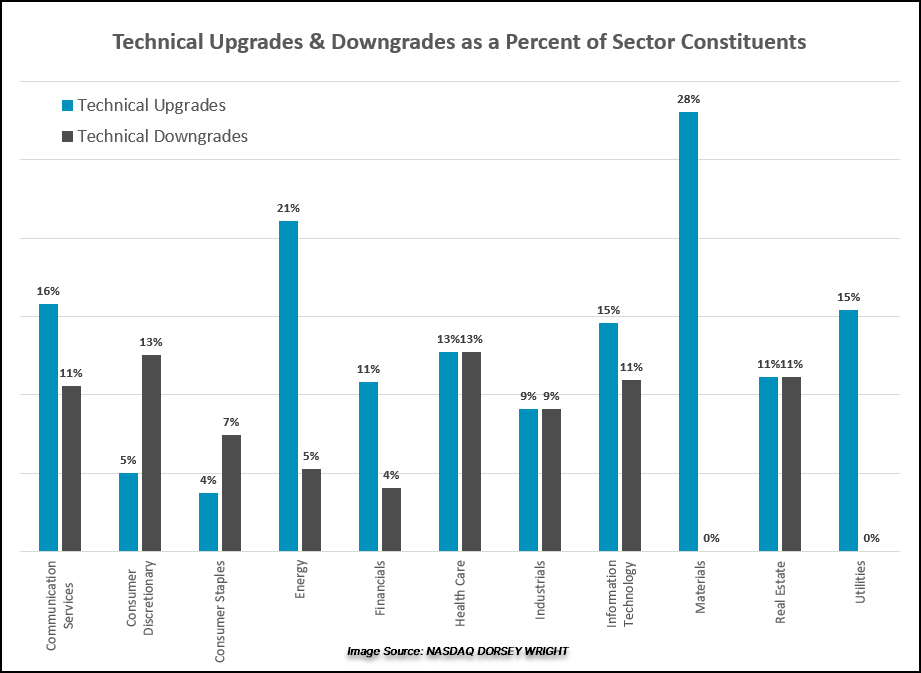
Technical Upgrades and Downgrades
Earnings season still brings surprises, often in the form of big share price reactions. After a large share price reaction, our technical attribute ratings can adjust — we call these changes in rating technical upgrades and technical downgrades. By our definition, a technical upgrade is when a stock gains an attribute — so a 1-rated stock moving up to a 2 would classify, just as a 4-attribute stock moving up to a 5 would classify. A technical downgrade is the opposite, so it counts whenever a stock loses an attribute rating.
It is important to recognize that just because a stock received a technical upgrade, it is not instantly a high attribute stock worth buying. Recall that a stock that was a 0 and became a 1 is classified as a technical upgrade. Also, note that the chart below does not show maintained ratings. So, a 5-attribute stock that had a positive earnings surprise is nowhere to be seen, just like a 0-attribute stock that may have experienced further downside. Nonetheless, interesting trends emerged. We pulled data as of February 26th, 2026.
Sector Highlights:
| Symbol | Name | Price | Yield | PnF Trend | RS Signal | RS Col. | Fund Score | 200 Day MA | Weekly Mom |
|---|---|---|---|---|---|---|---|---|---|
| DIA | State Street SPDR Dow Jones Industrial Average ETF Trust | 494.86 | 1.41 | Positive | Sell | X | 4.04 | 461.71 | - 3W |
| EEM | iShares MSCI Emerging Markets ETF | 62.71 | 2.05 | Positive | Buy | X | 5.57 | 52.72 | + 9W |
| EFA | iShares MSCI EAFE ETF | 105.57 | 3.22 | Positive | Sell | X | 4.52 | 93.73 | + 10W |
| IJH | iShares S&P MidCap 400 Index Fund | 72.07 | 1.30 | Positive | Buy | O | 4.34 | 65.19 | + 13W |
| IJR | iShares S&P SmallCap 600 Index Fund | 131.39 | 1.36 | Positive | Sell | O | 3.27 | 117.70 | - 2W |
| QQQ | Invesco QQQ Trust | 609.24 | 0.45 | Positive | Buy | O | 3.99 | 586.16 | - 9W |
| RSP | Invesco S&P 500 Equal Weight ETF | 204.73 | 1.58 | Positive | Sell | O | 3.21 | 188.61 | + 13W |
| SPY | State Street SPDR S&P 500 ETF Trust | 689.30 | 1.05 | Positive | Buy | X | 4.79 | 653.67 | - 9W |
| XLG | Invesco S&P 500 Top 50 ETF | 57.49 | 0.64 | Positive | Buy | O | 3.72 | 55.89 | - 9W |

Average Level
44.11
| < - -100 | -100 - -80 | -80 - -60 | -60 - -40 | -40 - -20 | -20 - 0 | 0 - 20 | 20 - 40 | 40 - 60 | 60 - 80 | 80 - 100 | 100 - > |
|---|---|---|---|---|---|---|---|---|---|---|---|
|
Buy signaluso
|
|||||||||||
|
Buy signalVOOV
|
|||||||||||
|
Buy signalhyg
|
Buy signalijr
|
Buy signaltlt
|
Buy signalagg
|
||||||||
|
Buy signalXLG
|
Buy signalfxe
|
Sell signallqd
|
Buy signalrsp
|
Sell signalief
|
|||||||
|
Sell signalVOOG
|
Buy signalQQQ
|
Buy signalSPY
|
Buy signaliwm
|
Buy signalshy
|
Sell signalGLD
|
Buy signaldvy
|
Buy signalEEM
|
||||
|
Sell signalONEQ
|
Sell signaldx/y
|
Buy signaldia
|
Buy signalgcc
|
Buy signalIJH
|
Buy signalgsg
|
Buy signalicf
|
Buy signalefa
|
||||
| < - -100 | -100 - -80 | -80 - -60 | -60 - -40 | -40 - -20 | -20 - 0 | 0 - 20 | 20 - 40 | 40 - 60 | 60 - 80 | 80 - 100 | 100 - > |
| AGG | iShares US Core Bond ETF |
| USO | United States Oil Fund |
| DIA | SPDR Dow Jones Industrial Average ETF |
| DVY | iShares Dow Jones Select Dividend Index ETF |
| DX/Y | NYCE U.S.Dollar Index Spot |
| EFA | iShares MSCI EAFE ETF |
| FXE | Invesco CurrencyShares Euro Trust |
| GLD | SPDR Gold Trust |
| GSG | iShares S&P GSCI Commodity-Indexed Trust |
| HYG | iShares iBoxx $ High Yield Corporate Bond ETF |
| ICF | iShares Cohen & Steers Realty ETF |
| IEF | iShares Barclays 7-10 Yr. Tres. Bond ETF |
| LQD | iShares iBoxx $ Investment Grade Corp. Bond ETF |
| IJH | iShares S&P 400 MidCap Index Fund |
| ONEQ | Fidelity Nasdaq Composite Index Track |
| QQQ | Invesco QQQ Trust |
| RSP | Invesco S&P 500 Equal Weight ETF |
| IWM | iShares Russell 2000 Index ETF |
| SHY | iShares Barclays 1-3 Year Tres. Bond ETF |
| IJR | iShares S&P 600 SmallCap Index Fund |
| SPY | SPDR S&P 500 Index ETF Trust |
| TLT | iShares Barclays 20+ Year Treasury Bond ETF |
| GCC | WisdomTree Continuous Commodity Index Fund |
| VOOG | Vanguard S&P 500 Growth ETF |
| VOOV | Vanguard S&P 500 Value ETF |
| EEM | iShares MSCI Emerging Markets ETF |
| XLG | Invesco S&P 500 Top 50 ETF |
| Symbol | Company | Sector | Current Price | Action Price | Target | Stop | Notes |
|---|---|---|---|---|---|---|---|
| PHM | PulteGroup, Inc. | Building | $135.66 | hi 120s - mid 130s | 168 | 110 | 4 for 5'er, top half of BUIL sector matrix, LT pos peer & mkt RS, bullish catapult |
| JBL | Jabil Circuit, Inc. | Electronics | $271.91 | mid 240s- lo 270s | 352 | 204 | 4 TA rating, top 50% of ELEC sector matrix, LT RS buy, buy-on-pullback, Earn. 3/19 |
| ABBV | AbbVie Inc. | Drugs | $224.69 | 210s - low 230s | 284 | 188 | 5 for 5'er, favored DRUG sector, LT pos peer & mkt RS, breakout from consec sell signals, 2.9% yield |
| AB | AllianceBernstein Holding LP | Wall Street | $39.64 | low 40s | 64 | 32 | 3 TA rating, LT mkt RS buy, LT pos trend, top 50% of WALL sector matrix, consec buy signals, buy-on-pullback, yield > 8% |
| BYD | Boyd Gaming Corp | Gaming | $87.71 | 82 - 88 | 98 | 72 | 4 for 5'er, top 20% of GAME sector matrix, LT pos peer RS, triple top, pos trend flip, buy on pullback |
| PKG | Packaging Corp of America | Forest Prods/Paper | $231.83 | hi 200s - mid 230s | 358 | 184 | 4 TA rating, top 20% of FORE sector RS matrix, LT RS buy, buy-on-pullback |
| CPA | Copa Holdings SA | Aerospace Airline | $148.03 | 140s | 166 | 124 | 4 for 5'er, top half of favored AERO sector matrix, LT pos mkt RS, bullish catapult, 4.8% yield |
| ZWS | Zurn Elkay Water Solutions Corp. | Machinery and Tools | $50.96 | hi 40s - lo 50s | 95 | 42 | 5 TA rating, LT pos trend, LT mkt RS buy, consec buy signals, buy-on-pullback |
| CACI | CACI International Inc. | Computers | $597.16 | 570s - 600s | 672 | 528 | 5 for 5'er, top 25% of COMP sector matrix, LT pos mkt RS, triple top breakout |
| Symbol | Company | Sector | Current Price | Action Price | Target | Stop | Notes |
|---|
| Symbol | Company | Sector | Current Price | Action Price | Target | Stop | Notes |
|---|---|---|---|---|---|---|---|
| GS | Goldman Sachs Group, Inc. | Wall Street | $929.00 | mid-800s - mid-900s | 1416 | 736 | GS has fallen to a sell signal. OK to hold here. Maintain $736 stop. |
| CBOE | CBOE Global Markets Inc. | Wall Street | $292.30 | lo 260s - mid 280s | 332 | 228 | CBOE has moved into heavily overbought territory. OK to hold here. Raise stop to $252. |
| SN | SharkNinja, Inc. | Household Goods | $126.88 | 120s - low 130s | 183 | 108 | SN has fallen to a sell signal. OK to hold here. Maintain $108 stop. |
| Comment | |||||||
|---|---|---|---|---|---|---|---|
|
|
|||||||
CACI CACI International Inc. R ($595.96) - Computers - CACI is a 5 for 5'er that ranks in the top quartile of the computers sector matrix and has been on a market RS buy signal for more than a decade. After giving two consecutive sell signals and successfully testing its bullish support line, CACI returned to a buy signal this week with a triple top break at $600. Long exposure may be added in the $570s to $600s and we will set our initial stop $528, which would take out multiple levels of support on CACI's default chart. We will use the bullish price objective, $672, as our target price. Note that as if CACI continues higher in the current column of Xs, its bullish price objective will rise.
| 26 | |||||||||||||||||||||||||||||
| 680.00 | X | 680.00 | |||||||||||||||||||||||||||
| 672.00 | X | O | 672.00 | ||||||||||||||||||||||||||
| 664.00 | X | O | 664.00 | ||||||||||||||||||||||||||
| 656.00 | X | O | 656.00 | ||||||||||||||||||||||||||
| 648.00 | X | O | X | 648.00 | |||||||||||||||||||||||||
| 640.00 | X | O | X | O | 640.00 | ||||||||||||||||||||||||
| 632.00 | X | X | O | X | O | X | 632.00 | ||||||||||||||||||||||
| 624.00 | X | O | X | X | O | O | X | O | 624.00 | ||||||||||||||||||||
| 616.00 | X | X | O | X | O | X | O | X | O | 616.00 | |||||||||||||||||||
| 608.00 | X | O | X | C | X | O | X | X | 2 | X | O | 608.00 | |||||||||||||||||
| 600.00 | X | O | X | O | X | O | X | O | X | O | X | O | X | 600.00 | |||||||||||||||
| 592.00 | X | X | O | O | O | X | O | X | O | O | X | X | X | Mid | 592.00 | ||||||||||||||
| 584.00 | X | O | X | O | X | O | O | X | O | X | O | X | 584.00 | ||||||||||||||||
| 576.00 | X | O | X | O | X | O | X | O | X | O | X | 576.00 | |||||||||||||||||
| 568.00 | X | O | X | O | X | O | X | O | • | O | • | 568.00 | |||||||||||||||||
| 560.00 | X | O | X | O | 1 | O | X | • | • | 560.00 | |||||||||||||||||||
| 552.00 | X | B | O | X | O | • | 552.00 | ||||||||||||||||||||||
| 544.00 | X | O | X | • | 544.00 | ||||||||||||||||||||||||
| 536.00 | X | X | O | • | 536.00 | ||||||||||||||||||||||||
| 528.00 | X | O | X | • | 528.00 | ||||||||||||||||||||||||
| 520.00 | X | O | X | • | 520.00 | ||||||||||||||||||||||||
| 512.00 | X | O | X | • | 512.00 | ||||||||||||||||||||||||
| 504.00 | X | A | O | • | 504.00 | ||||||||||||||||||||||||
| 496.00 | O | X | O | X | • | 496.00 | |||||||||||||||||||||||
| 488.00 | O | X | O | X | • | 488.00 | |||||||||||||||||||||||
| 480.00 | O | X | O | X | • | Bot | 480.00 | ||||||||||||||||||||||
| 472.00 | 9 | X | O | • | 472.00 | ||||||||||||||||||||||||
| 464.00 | O | X | • | 464.00 | |||||||||||||||||||||||||
| 456.00 | O | • | 456.00 | ||||||||||||||||||||||||||
| 26 |

| ALGT Allegiant Travel Company ($101.80) - Aerospace Airline - ALGT reversed into Os and broke a double bottom at $100 for a second sell signal since reaching a near-term peak at $118. The stock continues to maintain a 4 technical attribute rating and ranks within the top decile of the Aerospace Airline sector matrix. From here, prior resistance in the mid-$90s may be seen as near-term support, while additional may be found in the upper to mid $80s. |
| AXP American Express Company ($310.14) - Finance - AXP shares moved lower today to break a double bottom at $316 to mark its fourth consecutive sell signal. This 4 for 5'er has been in a positive trend since November 2023 and on an RS buy signal versus the market since February 2022. AXP shares are trading in heavily oversold territory below the bottom of their ten-week trading band. From here, support is offered at $292. |
| CL Colgate-Palmolive Company ($99.01) - Household Goods - Shares of CL have rallied sharply off their lows, moving up to a 3 for 5'er after flipping its trend back to positive and regaining near-term relative strength. Today's action saw it break a double top at $99 for its second consecutive buy signal. That said, the stock is still more of a hold, and it's trading in overbought territory above the top of its ten week trading band. From here, initial resistance lies at $100. |
| CRWV CoreWeave, Inc. Class A ($78.10) - Computers - CRWV moved to a sell signal Friday before dropping over 20% intraday to a low of $76. This moves the stock to a negative trend and brings it within one box of a reversal down into a column of Os against the market, signifying near-term relative weakness. The weight of the technical evidence is mixed but weakening for this highly volatile security. Further support can be seen at $74, while overhead resistance is not seen until $102. |
| DAL Delta Air Lines Inc. ($65.83) - Aerospace Airline - DAL broke a double bottom at $66 for a second sell signal since peaking at $76 earlier in February. This move will violate the bullish support line, which will drop the stock down to a 3 for 5'er trading in a negative trend. From here, support lies at $65, while additional can be found at $56. |
| DK Delek US Holdings, Inc. ($38.11) - Oil Service - DK returned to a buy signal Friday when it broke a double top at $37. Friday's move adds to an already positive technical outlook as DK is a favorable 4 for 5'er. From here, overhead resistance sits at $40, meanwhile, support sits at $33. |
| GM General Motors ($77.96) - Autos and Parts - GM reversed into Os and broke a double bottom at $78 for a third sell signal since reaching the all-time chart high at $87. The stock continues to maintain a 5 technical attribute rating and ranks within the top quintile of the Autos and Parts sector matrix. Support lies at current price levels, while additional may be found in the upper $60s. |
| GPOR Gulfport Energy Corp ($208.26) - Oil - GPOR returned to a buy signal Friday when it broke a double top at $208. Friday's move adds to a modestly positive technical picture as GPOR is a 3 for 5'er. From here, the next level of overhead resistance sits at $216. Meanwhile, support can be found at $190. |
| GS Goldman Sachs Group, Inc. ($858.06) - Wall Street - GS shares moved lower today to break a triple bottom at $864 to mark its first sell signal. This 5 for 5'er has been in a positive trend since May 2025 and on an RS buy signal versus the market since May 2024. GS shares are trading below the middle of their ten-week trading band. From here, support is offered at $760. |
| HSY The Hershey Company ($236.30) - Food Beverages/Soap - Shares of HSY have had a great past few months, and today's action saw it break a double top at $236 for its fifth consecutive buy signal. Hershey moved back to a positive trend at the end of last year and regained market relative strength earlier in February, bringing it up to buy territory as a 4 for 5'er. The stock is heavily overbought right now, so those looking to add should wait for pullback or consolidation. |
| ORLA Orla Mining Ltd. ($21.47) - Precious Metals - ORLA returned to a buy signal and reached a new all-time high Friday when it broke a double top at $21. Friday's move adds to an already positive technical picture as ORLA is a 5 for 5'er that ranks in the top quintile of the precious metals sector matrix. From here, the first level of support sits at $14.50. |
| SNPS Synopsys Inc ($414.00) - Software - SNPS fell Friday to break a quadruple bottom at $408. This 1 for 5'er moved to a negative trend last September and showed near-term relative weakness against the market earlier this month. The weight of the evidence is negative and weakening. Note that the stock is at support from earlier this month. Further support can be seen at $380. Overhead resistance may be seen initially at $448. |
| WFC Wells Fargo & Company ($80.61) - Banks - WFC shares moved lower today to break a double bottom at $82 to mark its third consecutive sell signal. This 3 for 5'er has been in a negative trend since February but on an RS buy signal versus the market since November 2024. WFC shares are trading near the bottom of their ten-week trading band in heavily oversold territory. From here, support is offered at $77 and $78. |
| Name | Option Symbol | Action | Stop Loss |
|---|---|---|---|
| Albemarle Corp - $178.67 | O: 26E180.00D15 | Buy the May 180.00 calls at 22.10 | 164.00 |
| Name | Option | Action |
|---|---|---|
|
|
||
| Name | Option Symbol | Action | Stop Loss |
|---|---|---|---|
| Shopify Inc - $119.85 | O: 26Q120.00D15 | Buy the May 120.00 puts at 14.05 | 128.00 |
| Name | Option | Action |
|---|---|---|
| MetLife, Inc. ( MET) | Apr. 77.50 Puts | Raise the option stop loss to 3.70 (CP: 5.70) |
| Dell Technologies Inc Class C ( DELL) | May. 115.00 Puts | Stopped at 130.00 (CP: 146.75) |
| Name | Option Sym. | Call to Sell | Call Price | Investment for 500 Shares | Annual Called Rtn. | Annual Static Rtn. | Downside Protection |
|---|---|---|---|---|---|---|---|
| Moderna, Inc. $ 51.71 | O: 26D55.00D17 | Apr. 55.00 | 5.25 | $ 23,858.20 | 105.53% | 72.96% | 8.92% |
| Name | Action |
|---|---|
| Intel Corporation ( INTC) - 45.46 | Sell the May 49.00 Calls. |
| The Gap, Inc. ( GAP) - 28.28 | Sell the March 29.00 Calls. |
| Target Corporation ( TGT) - 114.79 | Sell the May 115.00 Calls. |
| Delta Air Lines Inc. ( DAL) - 70.51 | Sell the April 70.00 Calls. |
| Freeport-McMoRan Inc. ( FCX) - 68.38 | Sell the June 65.00 Calls. |
| Carnival Corporation ( CCL) - 32.70 | Sell the April 33.00 Calls. |
| Kinross Gold Corporation ( KGC) - 36.76 | Sell the April 36.00 Calls. |
| Micron Technology, Inc. ( MU) - 415.56 | Sell the June 420.00 Calls. |
| Name | Covered Write |
|---|---|
| Enphase Energy Inc ( ENPH - 45.77 ) | April 50.00 covered write. |
Daily Equity & Market Analysis
LISTEN TO PODCAST
Apr 02, 2026
Loading, Please Wait...
