
When evaluating sectors at a broad level, it’s often useful to break them down into sub‑groups to identify which underlying industries are truly driving performance. Although the healthcare sector is up slightly in 2026, the pharmaceuticals sub‑group has stood out as a clear area of strength.
Beginners Series Webinar: Join us on Monday, March 2nd at 2 PM (ET) for our NDW Beginners Series Webinar. This week's topic is: Navigating the Models Page. Register Here
When evaluating sectors at a broad level, it’s often useful to break them down into sub‑groups to identify which underlying industries are truly driving performance. Although the healthcare sector is up slightly in 2026, the pharmaceuticals sub‑group has stood out as a clear area of strength. The pharmaceutical proxy IHE currently shows a fund score roughly 1.9 points higher than the broader healthcare benchmark XLV and has outperformed it by more than 4.5% year-to-date (YTD).
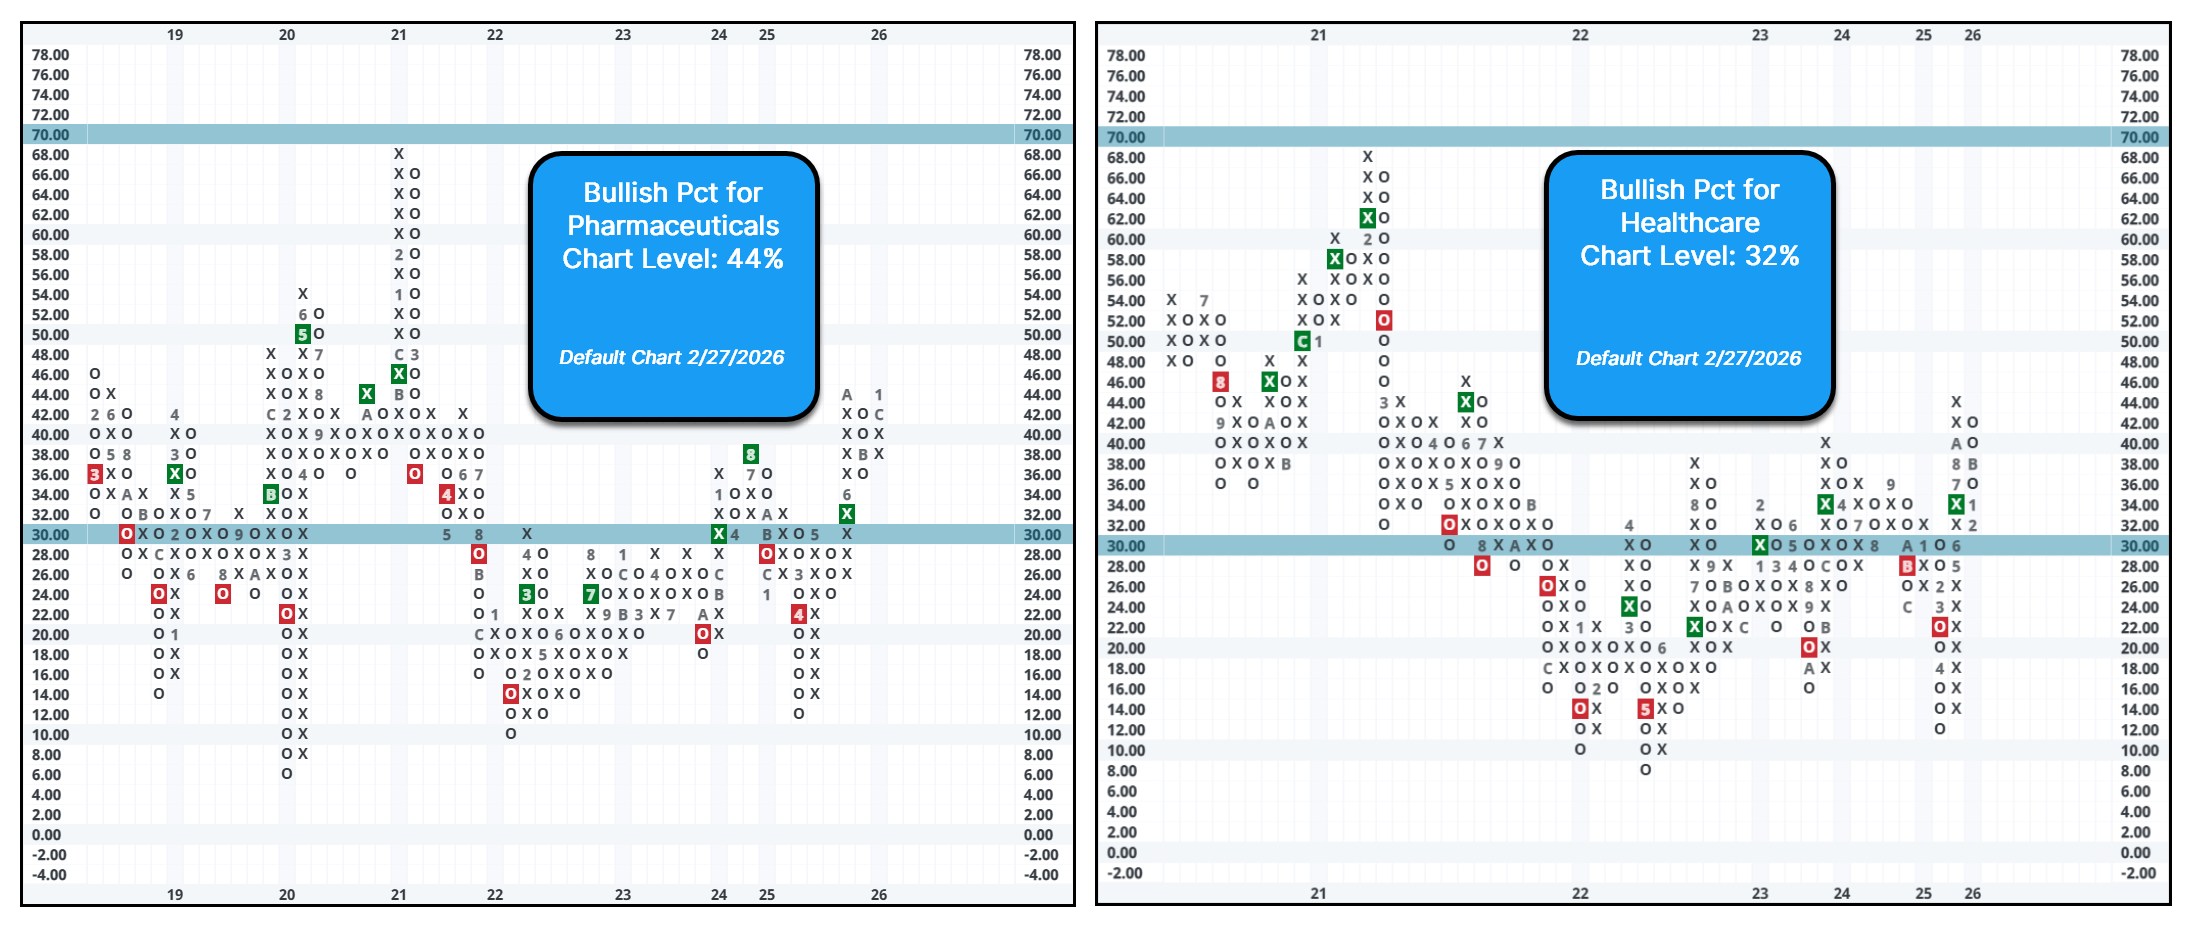
Going a step further, we can use the technical indicators report to sharpen our view of relative strength within each group. By examining the Bullish Percent Index—an intermediate‑term participation indicator that tracks the percentage of stocks in a universe trading on a PnF buy signal—we can quickly identify which group is exhibiting stronger intermediate-term strength. The bullish percent for healthcare (^BPECHEALTH) reversed into Os late last year and has continued to tick lower, now sitting at chart level of 32%, indicating that fewer than one‑third of the sector’s stocks remain on buy signals. In contrast, the pharmaceuticals bullish percent (BPECDRUGS) reversed into Xs at the end of last year and currently holds at chart level of 44%, roughly 12 percentage points higher than the broader healthcare sector’s bullish percent reading.
If you are looking to allocate into the pharmaceuticals sub-sector, you could consider the U.S. Pharmaceuticals ETF (IHE), which provides exposure to pharmaceutical manufacturers and holds notable weight in companies like Eli Lilly (LLY), Johnson & Johnson (JNJ), and Merck & Co (MRK). IHE maintains a strong fund score of 5.57, with a score direction of 2.87. The fund is coming off a strong 29% return in 2025 and is up 6% year-to-date near, over 5% more than the broader S&P 500 market. Additionally, the fund offers a yield of 1.7%. Given the normalization of the 10-week trading band and the weight of the evidence, long exposure can be made here. IHE trades near all-time high territory, with no current overhead resistance. Initial support at $82, with additional support at $73.

If you want to take a more active approach and invest in individual technically acceptable names in the pharmaceutical/drugs sector, you could consider buying Merck & Co., Inc. (MRK) on a pullback. The stock sits on three consecutive buy signals and is up over 65% from its 2025 low of 74$. The 5 for 5’er moved up from a 4 earlier in February, after returning to a buy signal against the market, and sits in the top quintile of the drugs sector matrix. Additionally, the stock offers a yield of 2.7%. The weekly OBOS indicates that the stock is in overbought territory, so wait for the 10-week trading band to normalize before considering. Initial strong support is at $97, with additional support at $94.

