With most of the S&P 500 (SPX) companies having released their 2025 Q4 earnings report, today we wanted to review how stocks behaved based on their technical rating.
With a majority of the S&P 500 (SPX) companies having released their 2025 Q4 earnings report, today we wanted to review how stocks behaved based on their technical rating. For instance, did stocks with a high technical attribute (TA) rating beat fundamental analyst estimates more frequently than low TA stocks? Did high TA stocks behave better on their earnings date compared to low TA stocks? Were there more technical upgrades in certain sectors compared to others?
Before answering these questions, we should first give a brief overview of our ratings for those unfamiliar. Note that we will often use the terms technical attribute, attribute, and rating interchangeably. If you are a veteran, go ahead and skip to the “High Attributes vs Low Attributes on Estimates” section.
For those still reading, every stock on our system is assigned a rating that ranges from 0 to 5. Stocks with an attribute of 2 or below are considered technically weak and consequently, carry a sell rating. Stocks with a 3 rating are considered a hold, and those with a 4 or 5 attribute are given buy and strong buy ratings, respectively. Our studies show that high rated stocks, which carry a 3 technical attribute or better, have historically outperformed stocks with low technical attribute ratings. Academics attribute this success to the momentum factor. It is a weird phenomenon, but it is as simple as stocks that have gone up the most in the past tend to keep going up the most in the future.
By no means did we discover momentum — we merely provide an objective and quantifiable means to access the factor via our technical attributes. These ratings were not built with the intention of chasing near-term alpha nor should they be heavily relied upon for short-term trading; however, closely rated stocks tend to behave similarly in certain seasons — one of them being earnings season.
High Attributes vs Low Attributes on Estimates
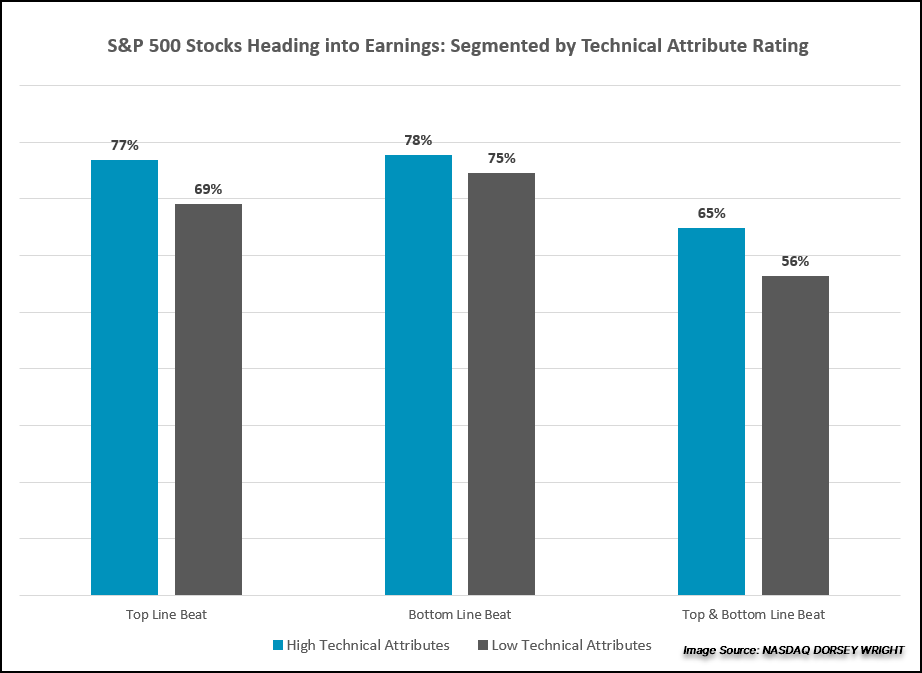
More stocks rated as a hold, buy, or strong buy (high technical attribute, 3+) heading into this earnings season beat fundamental analyst expectations compared to stocks rated as a sell (weak technical attribute, 2 or lower). In fact, 77% of high technical attribute stocks beat top line mean fundamental analyst estimates sourced by FactSet and 78% beat bottom line estimates. Conversely, just 69% of low attribute stocks beat top line estimates and 75% beat bottom line estimates.
The overall percentages/trends for Q4 2025 were lower compared to the prior two quarters of 2025. The notable change came from the decrease in beat rates from high technical names quarter over quarter. Top line beats for high attribute names fell from 83% (Q3) to 77% and bottom line beats dropped from 85% (Q3) to 78%, bringing the overall percentage of top and bottom line beats down from 73% (Q3) to 65%. Meanwhile, lower technical attribute names were roughly in line quarter over quarter. The decrease in overall beat rates across the board has returned closer to historic norms, suggesting at a minimum a change in investor expectations from Q3 to Q4. While there are various reasons for the shift, some of which will be touched on in the sector coverage below, uncertainty around tariffs, interest rate expectations, and the geopolitical landscape continue to be notable themes among companies seeing shifts in technical strength.
Technical Upgrades and Downgrades
Earnings season still brings surprises, often in the form of big share price reactions. After a large share price reaction, our technical attribute ratings can adjust — we call these changes in rating technical upgrades and technical downgrades. By our definition, a technical upgrade is when a stock gains an attribute — so a 1-rated stock moving up to a 2 would classify, just as a 4-attribute stock moving up to a 5 would classify. A technical downgrade is the opposite, so it counts whenever a stock loses an attribute rating.
It is important to recognize that just because a stock received a technical upgrade, it is not instantly a high attribute stock worth buying. Recall that a stock that was a 0 and became a 1 is classified as a technical upgrade. Also, note that the chart below does not show maintained ratings. So, a 5-attribute stock that had a positive earnings surprise is nowhere to be seen, just like a 0-attribute stock that may have experienced further downside. Nonetheless, interesting trends emerged. We pulled data as of February 26th, 2026.
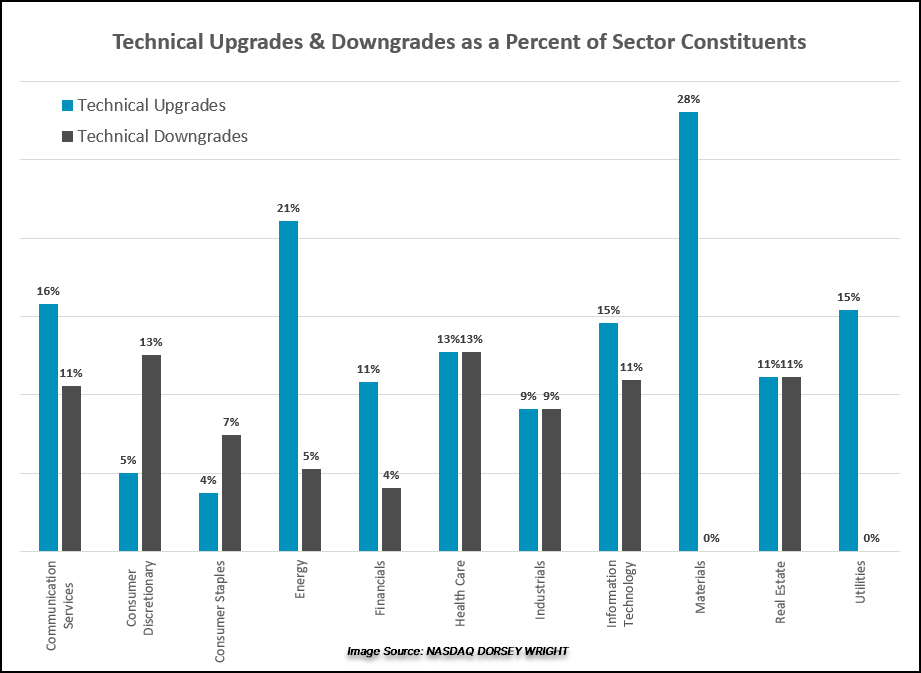
Sector Highlights:
- While this quarter witnessed a broader decrease in top and bottom line beats, Q4 saw a larger percentage of technical upgrades for most sectors. This a reversal from last quarter when sectors were seeing more technical downgrades, meaning companies within certain sectors repossessed their technical attributes following Q4 earnings after losing them during the Q3 cycle. Another theme for more technical upgrades comes from sectors that had been lower relative strength sectors in Q3 or the early part of 2025, but improved through Q4, witnessing stocks gain technical strength.
- Six out of eleven sectors saw more technical upgrades than downgrades, while an additional three saw the same percentage of technical upgrades and downgrades. Only two sectors (Consumer Discretionary and Staples) saw more technical downgrades than upgrades.
- Sectors with the highest number of technical upgrades were Materials, Energy, and Communication Services, followed closely by Technology and Utilities. Quarter over quarter, Materials and Energy saw technical upgrades increase by 24% and 16%, while Communication Services went form 0% upgrades in Q3 to 16% in Q4. Among the three sectors the most notable technical upgrades following earnings were Exxon Mobil (XOM), Smurfit Westrock (SW), and Meta Platforms (META).
- The stocks within the S&P 500 Index that witnessed the most notable technical downgrades were Advanced Micro Devices (AMD), Amazon.com (AMZN), and CBRE Group (CBRE). With each seeing drops from 4 technical attribute stocks down to 2 TA ratings after reporting earnings in the first half of February.