Most Requested Symbols

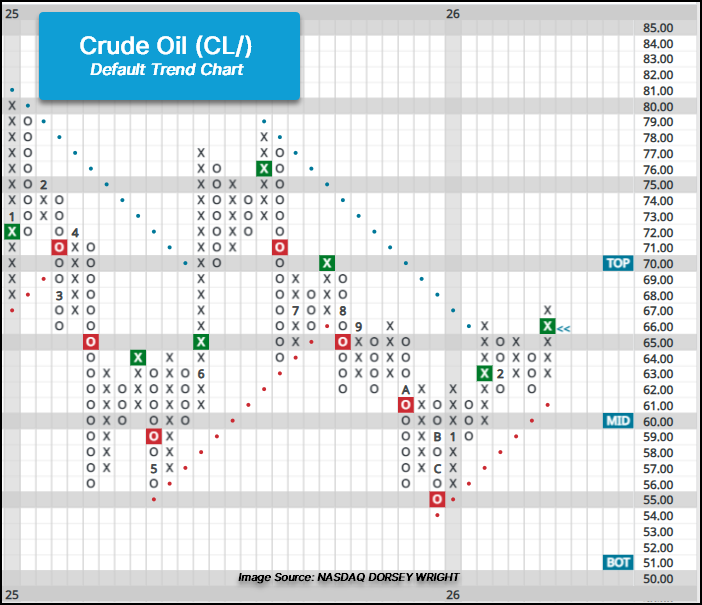
Crude Oil (CL/) clears notable resistance in the upper $60s.
While the count of “extreme” days has been relatively small, we have felt double the pain so far in 2026.
Weekly Rundown Video – Feb 18, 2026
Weekly rundown with NDW analyst team covering all major asset classes.
Weekly rundown with NDW analyst team covering all major asset classes.
U.S.- Iran nuclear talks and tensions between the two parties have increased crude oil (CL/) prices as the market assesses the potential supply risks associated if talks broke down and military escalation were to ensue. Price action last Thursday (2/19) brought about a second buy signal at $66 on the default point and figure chart for crude (CL/), while Friday’s trading saw prices move above $67, clearing resistance at $66 that has been in place since September 2025.
The recent rally within crude marks a continued rise above short- and long-term moving averages and the longest stretch of positive weekly momentum (nine weeks) since last summer, when prices rallied to the upper $70s before falling back into the upper $60s. While a constructive move seeing resistance at $66 cleared, investors now monitor resistance at $70 and the upper $70 to $80 range. Support has developed in the lower $60s with the bullish support line residing at $61.
The Invesco DB Oil Fund (DBO) also gave a second buy signal during last Thursday’s trading session with a double top at $14.25 on the fund’s default point and figure chart. Prior to recent developments, the trend chart moved back into a positive trend and the market RS chart of DBO against the S&P 500 Equal Weight Index (SPXEWI) reversed into Xs, favoring crude in the near term, in late January. The break last week improved the technical picture for DBO enough to bring the ETF’s fund score above 3.0 for the first time for more than one day since last summer. DBO similarly has resistance to contend with in the $14 range, while a move above $15 would mark a 52-week high.
While geopolitical tensions have brought about technical improvements for crude and related funds, investors monitor for the next potential catalyst to either push prices higher and further technical strength or deteriorate and see recent improvements wane.


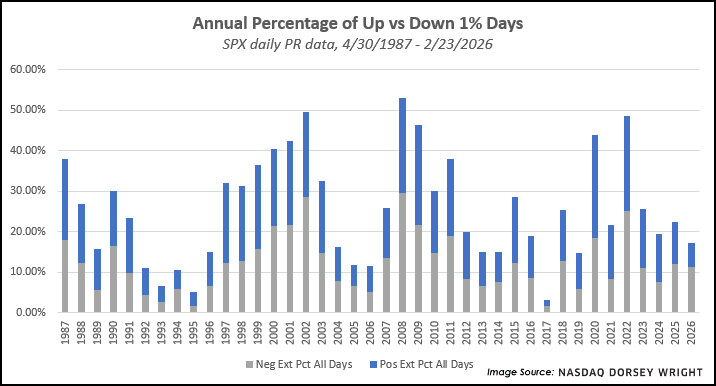
The broad market action has seemed worse than reality at this point in 2026. We have only seen six days when the S&P 500 Index gained or lost at least 1% in value. Out of those six days, four have been to the downside while only two have seen 1% gains. So, while the count of “extreme” days has been relatively small, we have felt double the pain.
Another way to look at volatility is through our SPX Volatility Study, which measures the percentage of extreme market days. It simply tracks all the days where SPX either gains or loses 1% in value, then looks at the percentage of those days relative to the total trading days in the year. In 2025, there were 56 days where the market has moved at least 1%, equating to about 22% of the annual trading days. That places us below the historical annual average of 26% of trading days. Most of the extreme days last year were to the downside (30 down days vs. 26 up days), which is especially rare in up market years. The last two years that saw more extreme movement lower than higher were 2022 and 2008. There were two months of outliers that saw significantly more extreme days, with 12 occurring in March and another 11 occurring in April. November also saw slightly higher than normal with six days. The more muted action over the remaining months led us closer to what is considered normal, even with a few sharp days included in the mix.

The first two months of 2026 have produced an extreme day in 17% of trading days, even further below the norm when compared to last year. Of course, there is a lot of time left in 2026 for tides to shift. At this point, having two thirds of the volatile days be to the downside would mark the largest spread between positive and negative extreme days dating back to the origin of our test in April 1987. We know that historically, the best and worst market days typically occur close together. When the market sees a large dip, demand often comes back into the picture. That has not happened in the handful of declines seen this year.
We saw similar action happen throughout the lost decade of the 2000s. From 2000 to 2008, the extreme losses exceeded the extreme gains in six of those nine years. A variety of factors were at work throughout that period, but the primary factor was the general underperformance of domestic equities. Other asset classes like international equities and commodities outperformed US stocks in most of those years. It is hard not to draw parallels between that period and the current period. International equities are coming off their best year against US stocks in over 30 years. We saw major outperformance from precious metals to start the year. Crude oil is breaking out, as discussed in today’s Point & Figure Pulse. We are very early in the year, but these trends are important to monitor.
Another point to watch is the expectation of increased volatility in March. On average, March shows the second highest count of extreme days of any month at 5.82 days, behind only October (6.74 days). That came to fruition last year as the tariff-induced volatility more than doubled the count of extreme days. Heading into March this year, tariffs are once again atop the headlines given the recent supreme court decision. While I seriously doubt anyone in the government is monitoring the count of extreme market days, the timing is ripe for volatility to pick up again. If this volatility does come to pass, keep a close eye on the consistency of rebounds after drawdowns, even if the magnitude of the rebound does not keep up with the drawdown itself.

Average Level
32.03
| < - -100 | -100 - -80 | -80 - -60 | -60 - -40 | -40 - -20 | -20 - 0 | 0 - 20 | 20 - 40 | 40 - 60 | 60 - 80 | 80 - 100 | 100 - > |
|---|---|---|---|---|---|---|---|---|---|---|---|
|
Buy signaluso
|
|||||||||||
|
Buy signalijr
|
Buy signalrsp
|
Sell signalief
|
|||||||||
|
Sell signalONEQ
|
Buy signalSPY
|
Buy signalfxe
|
Buy signalgcc
|
Sell signallqd
|
Buy signalagg
|
Buy signalGLD
|
|||||
|
Sell signalVOOG
|
Buy signaldia
|
Buy signaliwm
|
Buy signalVOOV
|
Buy signalshy
|
Buy signalgsg
|
Buy signalEEM
|
|||||
|
Buy signalXLG
|
Buy signalQQQ
|
Sell signaldx/y
|
Buy signalhyg
|
Buy signalIJH
|
Buy signaltlt
|
Buy signaldvy
|
Buy signalicf
|
Buy signalefa
|
|||
| < - -100 | -100 - -80 | -80 - -60 | -60 - -40 | -40 - -20 | -20 - 0 | 0 - 20 | 20 - 40 | 40 - 60 | 60 - 80 | 80 - 100 | 100 - > |
| AGG | iShares US Core Bond ETF |
| USO | United States Oil Fund |
| DIA | SPDR Dow Jones Industrial Average ETF |
| DVY | iShares Dow Jones Select Dividend Index ETF |
| DX/Y | NYCE U.S.Dollar Index Spot |
| EFA | iShares MSCI EAFE ETF |
| FXE | Invesco CurrencyShares Euro Trust |
| GLD | SPDR Gold Trust |
| GSG | iShares S&P GSCI Commodity-Indexed Trust |
| HYG | iShares iBoxx $ High Yield Corporate Bond ETF |
| ICF | iShares Cohen & Steers Realty ETF |
| IEF | iShares Barclays 7-10 Yr. Tres. Bond ETF |
| LQD | iShares iBoxx $ Investment Grade Corp. Bond ETF |
| IJH | iShares S&P 400 MidCap Index Fund |
| ONEQ | Fidelity Nasdaq Composite Index Track |
| QQQ | Invesco QQQ Trust |
| RSP | Invesco S&P 500 Equal Weight ETF |
| IWM | iShares Russell 2000 Index ETF |
| SHY | iShares Barclays 1-3 Year Tres. Bond ETF |
| IJR | iShares S&P 600 SmallCap Index Fund |
| SPY | SPDR S&P 500 Index ETF Trust |
| TLT | iShares Barclays 20+ Year Treasury Bond ETF |
| GCC | WisdomTree Continuous Commodity Index Fund |
| VOOG | Vanguard S&P 500 Growth ETF |
| VOOV | Vanguard S&P 500 Value ETF |
| EEM | iShares MSCI Emerging Markets ETF |
| XLG | Invesco S&P 500 Top 50 ETF |

| Symbol | Company | Sector | Current Price | Action Price | Target | Stop | Notes |
|---|---|---|---|---|---|---|---|
| GS | Goldman Sachs Group, Inc. | Wall Street | $892.31 | mid-800s - mid-900s | 1416 | 736 | 5 TA rating, top 10% of WALL sector matrix, LT RS buy, LT pos trend, buy-on-pullback |
| PHM | PulteGroup, Inc. | Building | $140.21 | hi 120s - mid 130s | 168 | 110 | 4 for 5'er, top half of BUIL sector matrix, LT pos peer & mkt RS, bullish catapult |
| CBOE | CBOE Global Markets Inc. | Wall Street | $290.11 | lo 260s - mid 280s | 332 | 228 | 5 TA rating, top 25% of WALL sector matrix, LT RS buy, LT pos trend, buy-on-pullback |
| JBL | Jabil Circuit, Inc. | Electronics | $261.28 | mid 240s- lo 270s | 352 | 204 | 4 TA rating, top 50% of ELEC sector matrix, LT RS buy, buy-on-pullback, Earn. 3/19 |
| ABBV | AbbVie Inc. | Drugs | $229.48 | 210s - low 230s | 284 | 188 | 5 for 5'er, favored DRUG sector, LT pos peer & mkt RS, breakout from consec sell signals, 2.9% yield |
| AB | AllianceBernstein Holding LP | Wall Street | $38.41 | low 40s | 64 | 32 | 4 TA rating, LT mkt RS buy, LT pos trend, top 50% of WALL sector matrix, consec buy signals, buy-on-pullback, yield > 8% |
| SN | SharkNinja, Inc. | Household Goods | $124.04 | 120s - low 130s | 183 | 108 | 4 for 5'er, 3rd of 28 in HOUS sector matrix, multiple buy signals, buy on pullback, R-R>2.0 |
| BYD | Boyd Gaming Corp | Gaming | $83.62 | 82 - 88 | 98 | 72 | 4 for 5'er, top 20% of GAME sector matrix, LT pos peer RS, triple top, pos trend flip, buy on pullback |
| PKG | Packaging Corp of America | Forest Prods/Paper | $225.55 | hi 200s - mid 230s | 358 | 184 | 4 TA rating, top 20% of FORE sector RS matrix, LT RS buy, buy-on-pullback |
| Symbol | Company | Sector | Current Price | Action Price | Target | Stop | Notes |
|---|
| Symbol | Company | Sector | Current Price | Action Price | Target | Stop | Notes |
|---|---|---|---|---|---|---|---|
| EWBC | East West Bancorp, Inc. | Banks | $116.10 | 92 | Moved to a sell signal. Current exposure may maintain the $92 stop. |
| Comment | |||||||
|---|---|---|---|---|---|---|---|
|
|
|||||||
PKG Packaging Corp of America ($228.84) R - Forest Prods/Paper - PKG has a 4 for 5 TA rating and sits in the top quintile of the favored forest products/paper RS matrix. The stock moved to a positive trend in December and has maintained an RS buy signal since mid-2024. The recent price action saw PKG match its all-time high before pulling back from that extended position to the middle of its trading band. This offers a more opportune entry point for potential long investors. Exposure can be considered in the upper $200s to mid-$230s. Our initial stop will be positioned at $184, which would violate multiple support levels and move the stock to a negative trend. The bullish price objective of $358 will serve as our price target.
| 26 | |||||||||||||||||||||||||||||
| 248.00 | X | Top | 248.00 | ||||||||||||||||||||||||||
| 244.00 | X | O | 244.00 | ||||||||||||||||||||||||||
| 240.00 | X | O | 240.00 | ||||||||||||||||||||||||||
| 236.00 | X | O | 236.00 | ||||||||||||||||||||||||||
| 232.00 | 2 | O | 232.00 | ||||||||||||||||||||||||||
| 228.00 | X | O | 228.00 | ||||||||||||||||||||||||||
| 224.00 | • | X | O | 224.00 | |||||||||||||||||||||||||
| 220.00 | • | 9 | • | X | O | Mid | 220.00 | ||||||||||||||||||||||
| 216.00 | • | X | O | • | X | 216.00 | |||||||||||||||||||||||
| 212.00 | • | X | X | O | X | • | 1 | 212.00 | |||||||||||||||||||||
| 208.00 | • | X | O | X | A | X | O | • | • | X | 208.00 | ||||||||||||||||||
| 204.00 | • | X | O | X | O | X | O | X | • | X | • | • | X | 204.00 | |||||||||||||||
| 200.00 | • | X | O | X | X | O | O | B | O | X | O | X | • | X | 200.00 | ||||||||||||||
| 198.00 | • | X | X | O | X | O | X | • | O | X | O | X | O | X | O | X | 198.00 | ||||||||||||
| 196.00 | • | 6 | O | X | O | X | O | X | • | O | X | O | X | C | X | O | X | • | 196.00 | ||||||||||
| 194.00 | X | O | X | O | X | O | • | O | O | X | O | X | O | • | 194.00 | ||||||||||||||
| 192.00 | X | X | X | X | O | 7 | 8 | X | • | O | O | • | • | Bot | 192.00 | ||||||||||||||
| 190.00 | X | X | O | X | O | X | O | X | O | X | O | • | • | 190.00 | |||||||||||||||
| 188.00 | X | O | X | O | X | O | X | O | X | O | X | • | 188.00 | ||||||||||||||||
| 186.00 | X | O | X | O | X | O | X | O | O | • | 186.00 | ||||||||||||||||||
| 184.00 | X | O | X | O | X | O | X | • | • | 184.00 | |||||||||||||||||||
| 182.00 | X | O | X | O | X | O | X | • | 182.00 | ||||||||||||||||||||
| 180.00 | X | O | O | • | 5 | • | 180.00 | ||||||||||||||||||||||
| 178.00 | X | • | • | • | 178.00 | ||||||||||||||||||||||||
| 176.00 | X | • | 176.00 | ||||||||||||||||||||||||||
| 26 |
| B Barrick Mining Corporation ($50.07) - Precious Metals - After giving two consecutive sell signals B returned to a buy signal Tuesday with a double top break at $50. Tuesday's move adds evidence to an already positive outlook as B is a 4 for 5'er that ranks in the top half of the precious metals sector matrix. From here, the next level of overhead resistance sits at $54, B's multi-year high. |
| EXEL Exelixis, Inc. ($45.05) - Biomedics/Genetics - EXEL inched higher to complete a double top break at $45. The 5 for 5'er ranks in the top half of the biomedics/genetics sector matrix. Long exposure can be made here given the weight of the evidence. Strong support can be seen at $41, with additional support at $36. Resistance can be seen between $46-$47. |
| GEV GE Vernova Inc. ($874.69) - Utilities/Electricity - GEV broke a double top at $848 for a fourth buy signal since the end of January as shares rallied to $864, marking a new all-time chart high. The stock has been a 5 for 5'er since December 2025 and currently ranks within the top decile of the Electric Utilities sector matrix. This breakout places the stock in overbought territory, so those seeking to initiate expsoure are best served by looking for a pullback to the lower $800s before considering. Initial support lies at $792, while additional can be found at $720. |
| KDP Keurig Dr Pepper Inc. ($30.93) - Food Beverages/Soap - Shares of KDP broke a double top at $31 for its first buy signal since 2024. However, the stock is now trading in heavily overbought territory near the top of its ten week trading band. Additionally, the 1 for 5'er continues to lack relative strength versus the market and its peers, keeping it in sell territory for the time being. From here, resistance lies at $36 then $38. |
| TER Teradyne, Inc. ($329.09) - Semiconductors - TER moved higher Tuesday to break a triple top at $328 before reaching a new all-time high at $332 intraday. This 5 for 5'er is already up over 65% so far in 2026, and is now in a heavily overbought position. The weight of the technical evidence is favorable, however, those looking to add exposure may be best served waiting for a pullback or normalization in the trading band. Initial support can be seen from $312 to $300, with further support seen down at $264. |
| WLK Westlake Corp. ($104.51) - Chemicals - WLK was up more than 12% following its earnings release on Tuesday and returned to a buy signal when it broke a triple top at $102; WLK continued higher to $106, marking a new 52-week high. The return to a buy signal adds to a moderately positive technical picture as WLK is a 3 for 5'er that ranks in the top third of the chemicals sector matrix. From here, support can be found at $92. |

| Name | Option Symbol | Action | Stop Loss |
|---|---|---|---|
| Apple Inc. - $271.70 | O: 26D270.00D17 | Buy the April 270.00 calls at 12.75 | 252.00 |
| Name | Option | Action |
|---|---|---|
| Monster Beverage Corp. ( MNST) | Mar. 77.50 Calls | Raise the option stop loss to 6.30 (CP: 8.30) |
| RTX Corp. ( RTX) | May. 200.00 Calls | Stopped at 13.25 (CP: 11.25) |
| Citigroup, Inc. ( C) | May. 120.00 Calls | Stopped at 108.00 (CP: 109.43) |
| Name | Option Symbol | Action | Stop Loss |
|---|---|---|---|
| ARM Holdings PLC ADR - $128.11 | O: 26P130.00D17 | Buy the April 130.00 puts at 11.00 | 142.00 |
| Name | Option | Action |
|---|---|---|
| Airbnb, Inc. Class A ( ABNB) | Apr. 130.00 Puts | Stopped at 8.35 (CP: 8.30) |
| Name | Option Sym. | Call to Sell | Call Price | Investment for 500 Shares | Annual Called Rtn. | Annual Static Rtn. | Downside Protection |
|---|---|---|---|---|---|---|---|
| Southwest Airlines Co. $ 50.90 | O: 26D52.50D17 | Apr. 52.50 | 2.60 | $ 24,276.10 | 49.76% | 29.89% | 4.08% |
| Name | Action |
|---|---|
| Alcoa Inc. ( AA) - 59.81 | Sell the March 60.00 Calls. |
| Intel Corporation ( INTC) - 43.63 | Sell the May 49.00 Calls. |
| The Gap, Inc. ( GAP) - 27.04 | Sell the March 29.00 Calls. |
| Enphase Energy Inc ( ENPH) - 47.40 | Sell the April 50.00 Calls. |
| Target Corporation ( TGT) - 113.34 | Sell the May 115.00 Calls. |
| Delta Air Lines Inc. ( DAL) - 66.88 | Sell the April 70.00 Calls. |
| nVent Electric plc ( NVT) - 114.93 | Sell the April 115.00 Calls. |
| Freeport-McMoRan Inc. ( FCX) - 65.55 | Sell the June 65.00 Calls. |
| Carnival Corporation ( CCL) - 30.42 | Sell the April 33.00 Calls. |
| Ford Motor Company ( F) - 13.64 | Sell the May 14.00 Calls. |
| Name | Covered Write |
|---|---|
|
|
|
Daily Equity & Market Analysis
LISTEN TO PODCAST
Apr 02, 2026
Loading, Please Wait...
