
While the count of “extreme” days has been relatively small, we have felt double the pain so far in 2026.
The broad market action has seemed worse than reality at this point in 2026. We have only seen six days when the S&P 500 Index gained or lost at least 1% in value. Out of those six days, four have been to the downside while only two have seen 1% gains. So, while the count of “extreme” days has been relatively small, we have felt double the pain.
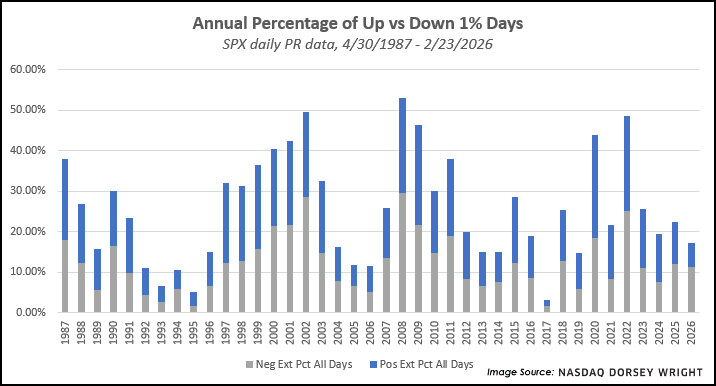
Another way to look at volatility is through our SPX Volatility Study, which measures the percentage of extreme market days. It simply tracks all the days where SPX either gains or loses 1% in value, then looks at the percentage of those days relative to the total trading days in the year. In 2025, there were 56 days where the market has moved at least 1%, equating to about 22% of the annual trading days. That places us below the historical annual average of 26% of trading days. Most of the extreme days last year were to the downside (30 down days vs. 26 up days), which is especially rare in up market years. The last two years that saw more extreme movement lower than higher were 2022 and 2008. There were two months of outliers that saw significantly more extreme days, with 12 occurring in March and another 11 occurring in April. November also saw slightly higher than normal with six days. The more muted action over the remaining months led us closer to what is considered normal, even with a few sharp days included in the mix.

The first two months of 2026 have produced an extreme day in 17% of trading days, even further below the norm when compared to last year. Of course, there is a lot of time left in 2026 for tides to shift. At this point, having two thirds of the volatile days be to the downside would mark the largest spread between positive and negative extreme days dating back to the origin of our test in April 1987. We know that historically, the best and worst market days typically occur close together. When the market sees a large dip, demand often comes back into the picture. That has not happened in the handful of declines seen this year.
We saw similar action happen throughout the lost decade of the 2000s. From 2000 to 2008, the extreme losses exceeded the extreme gains in six of those nine years. A variety of factors were at work throughout that period, but the primary factor was the general underperformance of domestic equities. Other asset classes like international equities and commodities outperformed US stocks in most of those years. It is hard not to draw parallels between that period and the current period. International equities are coming off their best year against US stocks in over 30 years. We saw major outperformance from precious metals to start the year. Crude oil is breaking out, as discussed in today’s Point & Figure Pulse. We are very early in the year, but these trends are important to monitor.
Another point to watch is the expectation of increased volatility in March. On average, March shows the second highest count of extreme days of any month at 5.82 days, behind only October (6.74 days). That came to fruition last year as the tariff-induced volatility more than doubled the count of extreme days. Heading into March this year, tariffs are once again atop the headlines given the recent supreme court decision. While I seriously doubt anyone in the government is monitoring the count of extreme market days, the timing is ripe for volatility to pick up again. If this volatility does come to pass, keep a close eye on the consistency of rebounds after drawdowns, even if the magnitude of the rebound does not keep up with the drawdown itself.

