
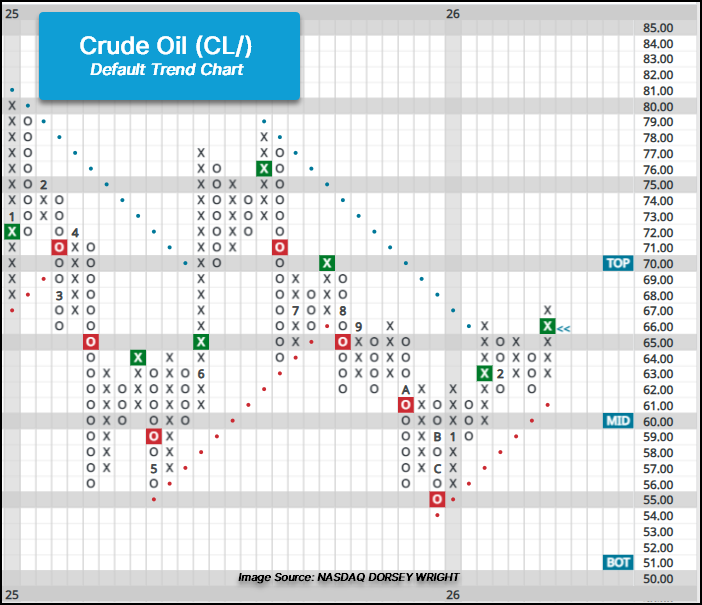
Crude Oil (CL/) clears notable resistance in the upper $60s.
U.S.- Iran nuclear talks and tensions between the two parties have increased crude oil (CL/) prices as the market assesses the potential supply risks associated if talks broke down and military escalation were to ensue. Price action last Thursday (2/19) brought about a second buy signal at $66 on the default point and figure chart for crude (CL/), while Friday’s trading saw prices move above $67, clearing resistance at $66 that has been in place since September 2025.
The recent rally within crude marks a continued rise above short- and long-term moving averages and the longest stretch of positive weekly momentum (nine weeks) since last summer, when prices rallied to the upper $70s before falling back into the upper $60s. While a constructive move seeing resistance at $66 cleared, investors now monitor resistance at $70 and the upper $70 to $80 range. Support has developed in the lower $60s with the bullish support line residing at $61.
The Invesco DB Oil Fund (DBO) also gave a second buy signal during last Thursday’s trading session with a double top at $14.25 on the fund’s default point and figure chart. Prior to recent developments, the trend chart moved back into a positive trend and the market RS chart of DBO against the S&P 500 Equal Weight Index (SPXEWI) reversed into Xs, favoring crude in the near term, in late January. The break last week improved the technical picture for DBO enough to bring the ETF’s fund score above 3.0 for the first time for more than one day since last summer. DBO similarly has resistance to contend with in the $14 range, while a move above $15 would mark a 52-week high.
While geopolitical tensions have brought about technical improvements for crude and related funds, investors monitor for the next potential catalyst to either push prices higher and further technical strength or deteriorate and see recent improvements wane.

