Most Requested Symbols

With the start of a new seasonal market cycle, we examine how the weak and strong "seasons" have historically affected sector returns.
The curve has an average reading of -3.39%.
Today's featured stock is D.R. Horton Inc (DHI).
AMAT, AMR, BLBD, CAVA, DECK, FRPT, LNW, MU, and NFLX
Call: D.R. Horton (DHI); Put: Block Inc (SQ); Covered Write: Comerica Inc (CMA).
NDW Morning Update Video - May 7, 2024
NDW Morning Update Video – May 7, 2024.
Click here to download MP3
Unlike equities, energy commodities moved lower last week. For example, crude oil (CL/) printed a second consecutive Point & Figure sell signal and fell back into a negative trend for the first time since November last year. This negates the uptrend we saw first develop in January of this year.
Although food and energy prices are excluded from core inflation readings, rising crude oil prices have been an outsized risk to reaccelerating inflationary pressures. So, from one perspective, this technical breakdown could be a positive macro development.
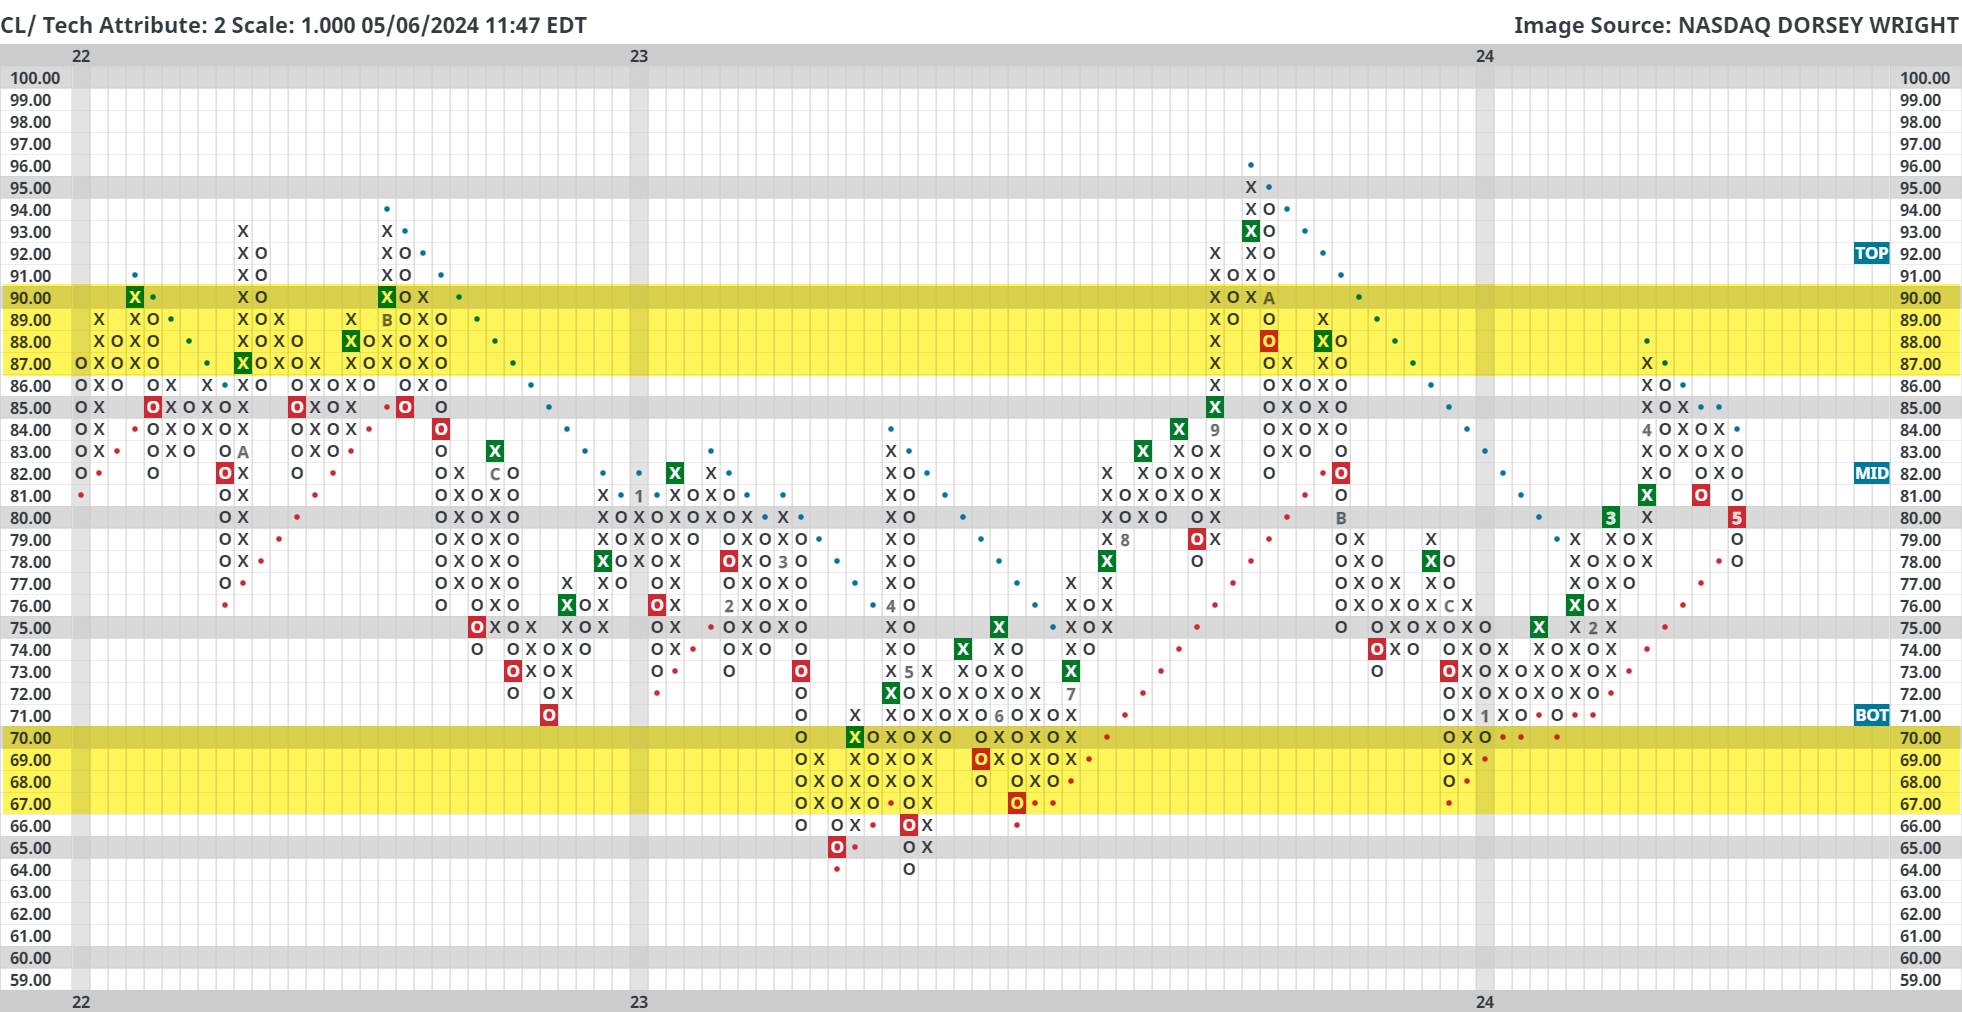
Although there is a clear technical breakdown on the Point & Figure chart above, there are two additional things worth pointing out today in relation to crude.
First, notice the wide trading range crude oil has been in for the past couple of years. Pullbacks have frequently come between $80 - $90 while upside bounces/short rallies have typically started in the mid $60s to low $70s. Crude currently trades in the upper $70 range so we are not in mean reversion territory at this time, but the potential for a turnaround could increase the closer we get to the highlighted bottom of the trading range.
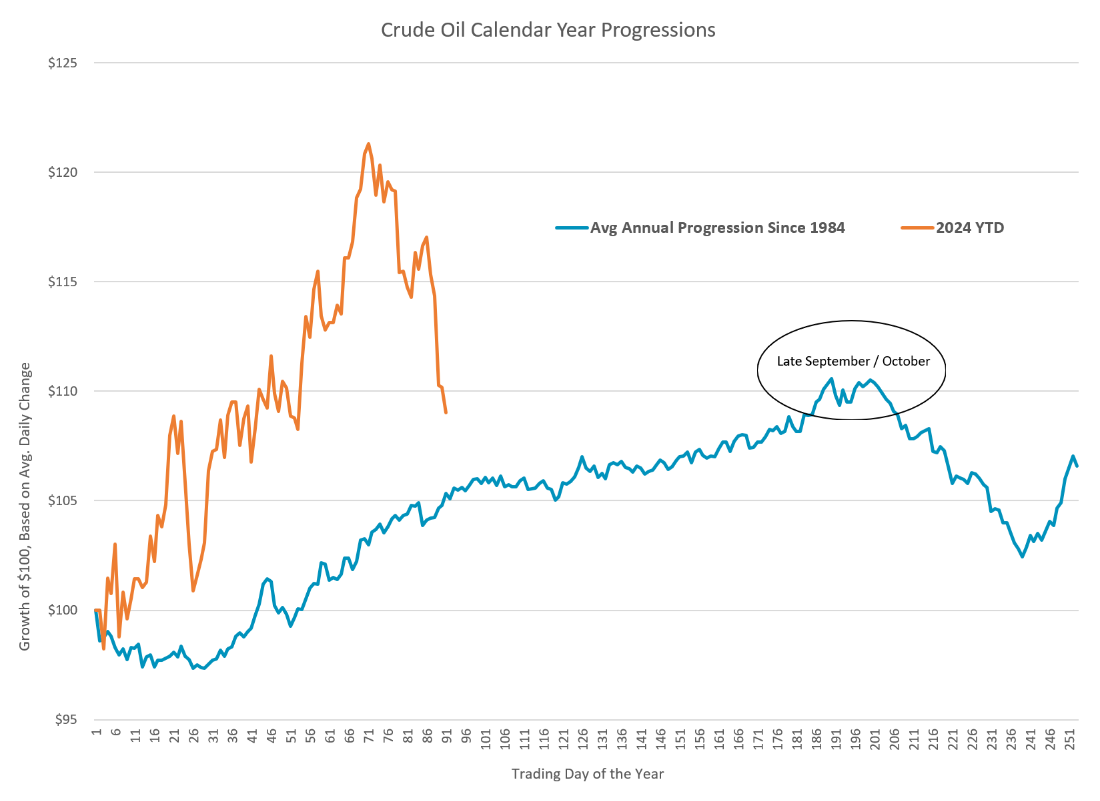
Second, remember that crude oil seasonality has historically been bullish until late September/early October. In other words, it would be unlikely that crude oil remains in a downtrend the rest of 2024 given that it has generally followed seasonal norms thus far.
Energy prices are certainly susceptible to geopolitical shocks, domestic political pressures, and of course OPEC+, so consider pairing these technical notes with other fundamental developments.

The beginning of May brings what is known as the “seasonally weak” six-month period for the market. Last week, we published articles around "market seasonality" and strategies to consider that leverage this historical bias. As we covered, the May to November period has typically provided worse returns over time than the six months from November through April. Even though that effect has been more muted in recent years, the long-term picture remains the same. We could hardly hope to explain this bias, much less the severity over time, but the "strong six months" of the year have accounted for almost all the Dow's average annual compounded return since 1950. As we covered last Thursday, the average return of the Dow during the seasonally strong six months has been better than 7%, while the "other" six months have produced an average return of less than one percent since 1950.
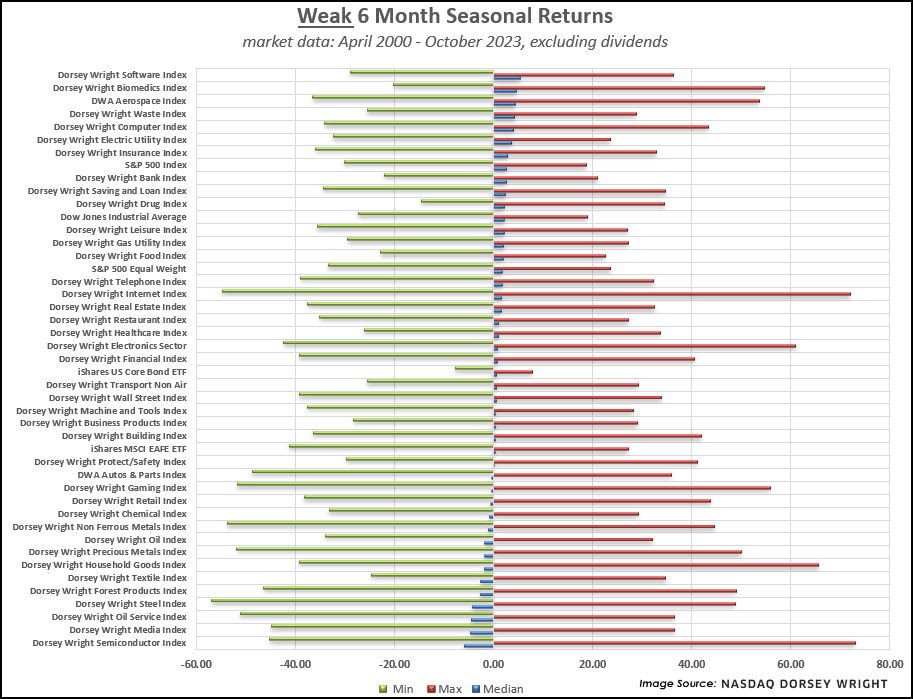
Those who have been following our research for any length of time know that sector rotation is a key aspect of many of our strategies. With the seasonal bias of the market in mind, we began to wonder how individual sectors might be affected by the seasonality phenomenon. While we don't have the same longevity in terms of data for sectors as we do for broad market indices, we have observed performance biases within the past 20+ years, which we illustrate below using the 40 DWA equal-weighted sector indices.
The graphics below utilize our inventory of 40 DWA equal-weighted sector indices, which have been "live" for the duration of our study period (most have been published since 1998), as well as a handful of benchmarks tracking equity and bond markets. The study includes market data from April 28, 2000, through April 30, 2024, tracking the returns of each index in the seasonal periods (the weak period spans May 1 through October 31, while strong periods span November 1 through April 30 of the following year). The results are displayed in graphs sorted by the "median" return of each index during each seasonal side of the study period, as well as the "min" and "max" returns during the respective periods. We’ve included each graphic along with key observations from each seasonal period.
Key Observations – Strong Season (November – April):

Key Observations – Weak Season (May – October):
Market seasonality is simply a historical performance bias that can be seen in examining performance over many years. Keep in mind that there have been several occasions when these trends have not played out. Considering that fact, we would certainly not advocate veering away from areas of market leadership simply because the calendar has changed. Tools like DALI and the Asset Class Group Scores provide us with a map of where the strength lies in the market now and until that picture changes, we will continue to rely on that guidance.
Average Level
-3.39
| < - -100 | -100 - -80 | -80 - -60 | -60 - -40 | -40 - -20 | -20 - 0 | 0 - 20 | 20 - 40 | 40 - 60 | 60 - 80 | 80 - 100 | 100 - > |
|---|---|---|---|---|---|---|---|---|---|---|---|
|
Sell signallqd
|
|||||||||||
|
Buy signalrsp
|
|||||||||||
|
Buy signalVOOV
|
|||||||||||
|
Sell signalfxe
|
Buy signalijr
|
||||||||||
|
Buy signaltlt
|
Buy signalgsg
|
Buy signalvoog
|
|||||||||
|
Buy signalUSO
|
Sell signaliwm
|
Buy signalhyg
|
|||||||||
|
Sell signalicf
|
Buy signaldia
|
Buy signaloneq
|
|||||||||
|
Buy signalief
|
Buy signalQQQ
|
Buy signalXLG
|
Buy signaldvy
|
||||||||
|
Buy signalshy
|
Buy signalIJH
|
Buy signalefa
|
Buy signalgcc
|
||||||||
|
Buy signalagg
|
Buy signalspy
|
Buy signaldx/y
|
Buy signalgld
|
Buy signaleem
|
|||||||
| < - -100 | -100 - -80 | -80 - -60 | -60 - -40 | -40 - -20 | -20 - 0 | 0 - 20 | 20 - 40 | 40 - 60 | 60 - 80 | 80 - 100 | 100 - > |
| AGG | iShares US Core Bond ETF |
| USO | United States Oil Fund |
| DIA | SPDR Dow Jones Industrial Average ETF |
| DVY | iShares Dow Jones Select Dividend Index ETF |
| DX/Y | NYCE U.S.Dollar Index Spot |
| EFA | iShares MSCI EAFE ETF |
| FXE | Invesco CurrencyShares Euro Trust |
| GLD | SPDR Gold Trust |
| GSG | iShares S&P GSCI Commodity-Indexed Trust |
| HYG | iShares iBoxx $ High Yield Corporate Bond ETF |
| ICF | iShares Cohen & Steers Realty ETF |
| IEF | iShares Barclays 7-10 Yr. Tres. Bond ETF |
| LQD | iShares iBoxx $ Investment Grade Corp. Bond ETF |
| IJH | iShares S&P 400 MidCap Index Fund |
| ONEQ | Fidelity Nasdaq Composite Index Track |
| QQQ | Invesco QQQ Trust |
| RSP | Invesco S&P 500 Equal Weight ETF |
| IWM | iShares Russell 2000 Index ETF |
| SHY | iShares Barclays 1-3 Year Tres. Bond ETF |
| IJR | iShares S&P 600 SmallCap Index Fund |
| SPY | SPDR S&P 500 Index ETF Trust |
| TLT | iShares Barclays 20+ Year Treasury Bond ETF |
| GCC | WisdomTree Continuous Commodity Index Fund |
| VOOG | Vanguard S&P 500 Growth ETF |
| VOOV | Vanguard S&P 500 Value ETF |
| EEM | iShares MSCI Emerging Markets ETF |
| XLG | Invesco S&P 500 Top 50 ETF |

| Symbol | Company | Sector | Current Price | Action Price | Target | Stop | Notes |
|---|---|---|---|---|---|---|---|
| KRG | Kite Realty Group Trust | Real Estate | $21.07 | 19 - 21 | 34.50 | 16 | 5 for 5'er, 11 of 113 in REAL sector matrix, LT pos mkt RS, spread quintuple top, 4.65% yield |
| OEC | Orion SA | Chemicals | $23.60 | 22 - 24 | 45.50 | 19 | 4 for 5'er, top third of CHEM sector matrix, LT pos mkt RS, spread quad top, R-R>5, Earn. 5/2 |
| CCEP | Coca-Cola Europacific Partners PLC | Food Beverages/Soap | $71.81 | 60s | 97 | 56 | 5 for 5'er, top 25% of FOOD sector matrix, spread quad top, R-R~3.0, 3% yield |
| CXT | Crane NXT Co. | Electronics | $61.52 | hi 50s - low 60s | 76 | 48 | Top half of MACH sector matrix, bullish catapult, Earn. 5/8 |
| MMC | Marsh & McLennan Companies, Inc. | Insurance | $199.27 | 190s - low 200s | 234 | 180 | 5 for 5'er, favored INSU sector, LT pos mkt RS, quad top breakout, 1.4% yield |
| BLMN | Bloomin' Brands Inc | Restaurants | $25.61 | hi 20s - low 30s | 41 | 24 | 5 for 5'er, #10 of 27 in REST sector matrix, LT pos mkt RS, quintuple top, R-R>2.0, 3.2% yield, Earn. 5/7 |
| HRB | H&R Block, Inc. | Business Products | $47.53 | mid 40s - lo 50s | 71 | 39 | 5 TA rating, top 33% of BUSI sector matrix, LT pos trend, LT pos. mkt. RS, buy-on-pullback, R-R > 2, Earn. 5/9 |
| RPM | RPM, Inc. | Chemicals | $109.22 | mid 100s - hi 110s | 159 | 91 | 5 TA rating, LT RS buy, consec. buy signals, top 50% of CHEM sector matrix, buy-on-pullback, R-R > 2 |
| GS | Goldman Sachs Group, Inc. | Wall Street | $438.18 | hi 380s - low 410s | 484 | 348 | 4 for 5'er, top half of WALL sector matrix, one box from mkt RS buy signal, quad top breakout, 2.75% yield |
| CI | CIGNA Group/The | Insurance | $341.50 | 332 - lo 360s | 428 | 288 | 5 TA rating, top half of INSU sector matrix, LT RS buy, buy-on-pullback |
| AVNT | Avient Corp | Chemicals | $44.16 | low 40s | 71 | 35 | 4 for 5'er, top half of favored CHEM sector matrix. LT pos mkt RS, spread triple top, R-R>4.0, 2.5% yield Earn. 5/7 |
| REVG | REV Group Inc | Autos and Parts | $23.25 | 19 - lo 20s | 33.50 | 17 | 5 TA rating, top decline of ATUO sector matrix, LT RS buy, R-R > 3 |
| BAH | Booz Allen Hamilton Holding | Business Products | $147.25 | 140s | 193 | 114 | 5 for 5'er, top 25% of favored BUSI sector matrix, LT pos peer RS, pullback from ATH, 1.5% yield, Earn. 5/24 |
| GBX | The Greenbrier Companies, Inc. | Transports/Non Air | $52.23 | hi 40s - low 50s | 87 | 43 | 5 for 5'er, top 20% of favored TRAN sector matrix, pullback from multi-year high, R-R>4.0, 2.3% yield |
| JPM | J.P. Morgan Chase & Co. | Banks | $190.51 | lo 180s - hi 190s | 258 | 148 | 5 TA rating, RS buy, top 10% of BANK sector matrix, consec. buy signals |
| WSM | Williams-Sonoma, Inc. | Retailing | $304.70 | 280s - 290s | 362 | 232 | 5 for 5'er, #2 of 84 in RETA sector matrix, multi buy signals, pullback from ATH, 1.6% yield, Earn. 5/21 |
| PSTG | Pure Storage | Semiconductors | $52.24 | $49 to $58 | $74 | $38 | 5 for 5'er, pos. trend since June 2023, ranks 3rd in Semiconductors sector matrix. Earnings 5/29. |
| ORCL | Oracle Corporation | Software | $115.80 | 110s - low 120s | 150 | 99 | 4 for 5'er, top half of SOFT sector matrix. LT pos mkt RS, spread triple top, pullback from ATH, 1.4% yield |
| AMP | Ameriprise Financial | Finance | $418.95 | 390s - 410s | 532 | 368 | 5 for 5'er, top half of FINA sector matrix, LT pos peer & mkt RS, triple top, pullback from ATH, 1.4% yield |
| LIN | Linde Plc | Chemicals | $423.60 | hi 410s - lo 460s | 572 | 360 | 5 TA rating, consec. buy signals, LT RS buy, buy-on-pullback |
| OMF | OneMain Holdings Inc. | Finance | $51.20 | hi 40s - low 50s | 81 | 43 | 5 for 5'er, top half of FINA sector matrix, LT pos mkt RS, multiple buy signals, R-R>3.0, 7.9% yield |
| KBR | KBR, Inc. | Aerospace Airline | $66.79 | mid-hi 60s | 92 | 54 | 4 TA rating, top half of AERO sector RS matrix, LT pos. mkt. RS, consec. buy signals, R-R > 2 |
| DHI | D.R. Horton, Inc. | Building | $148.48 | mid 140s - 150s | 178 | 134 | 5 for 5'er, favored BUIL sector, LT pos peer RS, bearish signal reversal |
| Symbol | Company | Sector | Current Price | Action Price | Target | Stop | Notes |
|---|---|---|---|---|---|---|---|
| MTCH | Match Group, Inc. | Internet | $31.93 | (mid 30s) | 26 | 40 | 0 for 5'er, bottom half of INET sector matrix, LT neg trend & RS, Earn. 5/7 |
| MRVL | Marvell Technology Inc. | Semiconductors | $68.51 | (70 - 65) | 51 | 77 | 2 for 5'er, middle of unfavored SEMI sector matrix, spread quad bottom |
| Comment | |||||||
|---|---|---|---|---|---|---|---|
|
|
|||||||
DHI D.R. Horton, Inc. R ($150.81) - Building - DHI is a5for 5'er that belongs to the favored building sector matrix and has been on a peer RS buy signal since 2009. After giving three consecutive sell signals, DHI found support at $140 for a third time this year and returned to a buy signal last week when it completed a bearish signal reversal at $150. Long exposure may be added in the mid $140s to $150s and we will set our initial stop at $134, the potential trend line violation on DHI's default chart. We will use the bullish price objective, $178, as our target price.
| 23 | 24 | |||||||||||||||||||||||||||||||||||||||||||||||||||
| 164.00 | X | 164.00 | ||||||||||||||||||||||||||||||||||||||||||||||||||
| 162.00 | X | O | 162.00 | |||||||||||||||||||||||||||||||||||||||||||||||||
| 160.00 | X | O | 160.00 | |||||||||||||||||||||||||||||||||||||||||||||||||
| 158.00 | X | 4 | 158.00 | |||||||||||||||||||||||||||||||||||||||||||||||||
| 156.00 | X | X | X | O | 156.00 | |||||||||||||||||||||||||||||||||||||||||||||||
| 154.00 | X | 1 | O | X | O | X | O | X | 154.00 | |||||||||||||||||||||||||||||||||||||||||||
| 152.00 | X | O | X | O | X | O | X | O | X | O | X | Mid | 152.00 | |||||||||||||||||||||||||||||||||||||||
| 150.00 | X | O | X | O | 3 | O | O | X | O | X | 150.00 | |||||||||||||||||||||||||||||||||||||||||
| 148.00 | X | O | O | X | X | X | O | X | O | X | 5 | 148.00 | ||||||||||||||||||||||||||||||||||||||||
| 146.00 | X | O | 2 | O | X | O | X | O | O | X | O | X | 146.00 | |||||||||||||||||||||||||||||||||||||||
| 144.00 | X | O | X | O | X | O | X | O | X | O | X | 144.00 | ||||||||||||||||||||||||||||||||||||||||
| 142.00 | X | O | X | O | O | X | O | O | X | 142.00 | ||||||||||||||||||||||||||||||||||||||||||
| 140.00 | X | O | O | O | 140.00 | |||||||||||||||||||||||||||||||||||||||||||||||
| 138.00 | X | 138.00 | ||||||||||||||||||||||||||||||||||||||||||||||||||
| 136.00 | X | 136.00 | ||||||||||||||||||||||||||||||||||||||||||||||||||
| 134.00 | • | X | • | 134.00 | ||||||||||||||||||||||||||||||||||||||||||||||||
| 132.00 | X | • | C | • | 132.00 | |||||||||||||||||||||||||||||||||||||||||||||||
| 130.00 | X | O | • | X | • | 130.00 | ||||||||||||||||||||||||||||||||||||||||||||||
| 128.00 | X | O | X | • | X | • | Bot | 128.00 | ||||||||||||||||||||||||||||||||||||||||||||
| 126.00 | X | O | X | O | • | X | • | 126.00 | ||||||||||||||||||||||||||||||||||||||||||||
| 124.00 | X | X | 8 | X | O | • | X | • | 124.00 | |||||||||||||||||||||||||||||||||||||||||||
| 122.00 | X | O | X | O | O | • | X | • | 122.00 | |||||||||||||||||||||||||||||||||||||||||||
| 120.00 | X | O | X | O | X | • | X | • | 120.00 | |||||||||||||||||||||||||||||||||||||||||||
| 118.00 | X | 7 | X | O | X | O | X | • | 118.00 | |||||||||||||||||||||||||||||||||||||||||||
| 116.00 | X | O | O | X | O | X | • | 116.00 | ||||||||||||||||||||||||||||||||||||||||||||
| 114.00 | X | O | 9 | X | • | 114.00 | ||||||||||||||||||||||||||||||||||||||||||||||
| 112.00 | 5 | 6 | O | X | • | 112.00 | ||||||||||||||||||||||||||||||||||||||||||||||
| 110.00 | X | O | X | O | X | • | 110.00 | |||||||||||||||||||||||||||||||||||||||||||||
| 108.00 | X | O | X | O | X | B | • | 108.00 | ||||||||||||||||||||||||||||||||||||||||||||
| 106.00 | X | O | • | A | X | O | X | • | 106.00 | |||||||||||||||||||||||||||||||||||||||||||
| 104.00 | X | X | • | O | X | O | X | • | 104.00 | |||||||||||||||||||||||||||||||||||||||||||
| 102.00 | X | O | X | • | O | O | • | 102.00 | ||||||||||||||||||||||||||||||||||||||||||||
| 100.00 | X | O | X | X | • | • | 100.00 | |||||||||||||||||||||||||||||||||||||||||||||
| 99.00 | 2 | O | X | O | X | X | • | 99.00 | ||||||||||||||||||||||||||||||||||||||||||||
| 98.00 | X | X | O | X | O | X | O | 4 | X | • | 98.00 | |||||||||||||||||||||||||||||||||||||||||
| 97.00 | X | X | O | X | O | O | X | X | O | X | O | X | • | 97.00 | ||||||||||||||||||||||||||||||||||||||
| 96.00 | X | X | O | X | O | X | O | X | O | X | O | X | O | X | • | 96.00 | ||||||||||||||||||||||||||||||||||||
| 95.00 | X | O | X | O | X | O | O | X | O | X | O | O | • | 95.00 | ||||||||||||||||||||||||||||||||||||||
| 94.00 | X | O | X | O | X | O | X | O | X | • | 94.00 | |||||||||||||||||||||||||||||||||||||||||
| 93.00 | X | O | O | X | O | 3 | X | O | • | 93.00 | ||||||||||||||||||||||||||||||||||||||||||
| 92.00 | X | X | O | X | O | X | O | X | • | 92.00 | ||||||||||||||||||||||||||||||||||||||||||
| 91.00 | X | O | 1 | O | O | X | O | X | • | 91.00 | ||||||||||||||||||||||||||||||||||||||||||
| 90.00 | X | O | X | O | O | • | 90.00 | |||||||||||||||||||||||||||||||||||||||||||||
| 89.00 | X | O | X | • | 89.00 | |||||||||||||||||||||||||||||||||||||||||||||||
| 88.00 | X | O | X | • | 88.00 | |||||||||||||||||||||||||||||||||||||||||||||||
| 87.00 | X | O | X | • | 87.00 | |||||||||||||||||||||||||||||||||||||||||||||||
| 86.00 | X | O | X | • | 86.00 | |||||||||||||||||||||||||||||||||||||||||||||||
| 85.00 | X | O | • | 85.00 | ||||||||||||||||||||||||||||||||||||||||||||||||
| 84.00 | X | • | 84.00 | |||||||||||||||||||||||||||||||||||||||||||||||||
| 83.00 | • | 83.00 | ||||||||||||||||||||||||||||||||||||||||||||||||||
| 23 | 24 |
| AMAT Applied Materials, Inc. ($208.03) - Semiconductors - AMAT rose Monday to break a double top at $208. This 5 for 5'er moved to a positive trend in November 2023 and sits in the top quintile of the semiconductors sector RS matrix. The technical picture is positive and improving once again. Initial support can be seen at $194 with further support offered at $188. Potential overhead resistance may be seen at $212. Note that earnings are expected on 5/16. |
| AMR Alpha Metallurgical Resources Inc. ($301.20) - Oil - AMR was down more than 9% on Monday following its earnings release, the move took out multiple levels of support on the stock's default chart and violated its bullish support line. The negative trend change will drop an AMR to an unfavorable 2 for 5'er and it ranks in the bottom quintile of the oil sector matrix. From here, the next level of support sits at $292, AMR's 2024 low. |
| BLBD Blue Bird Corp. ($36.61) - Autos and Parts - BLBD reversed into Xs and broke a double top at $37 for a fourth consecutive buy signal since December 2023. The stock is a 5 for 5'er that has maintained a positive trend and positive near-term RS against the market and its peer group. Okay to consider here on the breakout. Initial support lies at $33, while additional can be found at $30. |
| CAVA CAVA Group, Inc. ($75.15) - Restaurants - CAVA broke a double top at $75 for a second buy signal as the stock rallied to a new high at $77. The stock is a 5 for 5'er that maintains positive short and long-term RS against the market and its peer group. Okay to consider in the low to mid-$70s. Initial support lies at $67, while additional can be found at $59. |
| DECK Deckers Outdoor Corporation ($861.31) - Textiles/Apparel - DECK broke a double top at $864 to return to a buy signal. The stock is a 5 for 5'er that ranks in the top quintile of the Textiles/Apparel sector matrix. Okay to consider here on the breakout. Initial support lies at $792, while additional lies in the $744 to $752 range. |
| FRPT Freshpet Inc ($119.95) - Food Beverages/Soap - FRPT shares rallied on a favorable earnings report. The stock has been a 5 for 5'er since December of last year and now trades at multiyear highs. Demand remains in control. Support is offered at around $104. |
| LNW Light & Wonder Inc. ($95.06) - Gaming - LNW broke a double top at $95 for a fifth consecutive buy signal since January. The stock is a 5 for 5'er that ranks 1st (out of 17) in the Gaming sector matrix. Okay to consider here on the breakout. Note that LNW's March rally high lies at $108. Initial support lies at $89, while additional can be found at $87. |
| MU Micron Technology, Inc. ($119.87) - Semiconductors - MU rose Monday to break a double top at $118 before reaching $120 intraday. This 5 for 5'er has maintained a positive trend since last August and sits in the top decile of the semiconductors sector RS matrix. The weight of the technical evidence is positive and continues to improve. Initial support can be seen at $110 with further support seen at $106. |
| NFLX NetFlix Inc. ($593.70) - Internet - NFLX moved back to a buy signal today. Bulls should be encouraged by the move, as this perfect 5/5'er now offers a tight range of support nearby from $544-$552. All time highs from earlier this year now sit in earshot, so interested parties could enter into positions here. |

| Name | Option Symbol | Action | Stop Loss |
|---|---|---|---|
| D.R. Horton, Inc. - $150.81 | O: 24H150.00D16 | Buy the August 150.00 calls at 11.40 | 138.00 |
| Name | Option | Action |
|---|---|---|
| The Walt Disney Company ( DIS) | Jul. 110.00 Calls | Initiate an option stop loss of 8.00 (CP: 10.00) |
| American International Group, Inc. ( AIG) | Jul. 72.50 Calls | Raise the option stop loss to 5.60 (CP: 7.60) |
| Ross Stores, Inc. ( ROST) | Jul. 130.00 Calls | Raise the option stop loss to 5.40 (CP: 7.40) |
| Name | Option Symbol | Action | Stop Loss |
|---|---|---|---|
| Block Inc - $72.17 | O: 24U72.50D20 | Buy the September 72.50 puts at 7.45 | 77.00 |
| Name | Option | Action |
|---|---|---|
| Dollar General Corp. ( DG) | Aug. 140.00 Puts | Raise the option stop loss to 9.05 (CP: 11.05) |
| Name | Option Sym. | Call to Sell | Call Price | Investment for 500 Shares | Annual Called Rtn. | Annual Static Rtn. | Downside Protection |
|---|---|---|---|---|---|---|---|
| Comerica Incorporated $ 53.07 | O: 24I55.00D20 | Sep. 55.00 | 3.70 | $ 25,292.05 | 20.43% | 16.46% | 5.82% |
| Name | Action |
|---|---|
| Lyft Inc Class A ( LYFT) - 17.20 | Sell the July 20.00 Calls. |
| DraftKings Inc Class A ( DKNG) - 41.82 | Sell the July 45.00 Calls. |
| Constellation Energy Corporation ( CEG) - 194.86 | Sell the August 195.00 Calls. |
| United Airlines Holdings Inc. ( UAL) - 51.65 | Sell the August 55.00 Calls. |
| Airbnb, Inc. Class A ( ABNB) - 159.71 | Sell the September 170.00 Calls. |
| Palantir Technologies Inc. Class A ( PLTR) - 23.33 | Sell the August 23.00 Calls. |
| Micron Technology, Inc. ( MU) - 114.70 | Sell the August 115.00 Calls. |
| Name | Covered Write |
|---|---|
| Freeport-McMoRan Inc. ( FCX - 50.45 ) | August 50.00 covered write. |
| Hewlett Packard Enterprise Company ( HPE - 16.86 ) | August 17.00 covered write. |
Daily Equity & Market Analysis
Loading, Please Wait...
