Most Requested Symbols

With the start of May, we have also officially moved into the “seasonally weak” half of the year, which lasts from May through October. We are all familiar with the saying "sell in May and go away," which proposes that portfolio growth would do just as well if all holdings were sold as they would be if invested in the market from May through October.
The curve has an average reading of -29.14%.
Today's featured stock is KBR, Inc. (KBR).
DASH, EIX, FORM, MPWR, MUSA, NRG, ONTO, and UTZ
Call: Ross Stores (ROST); Put: RTX Corp. (RTX); Covered Write: Freeport-McMoRan (FCX)
NDW Morning Update Video - May 3, 2024
NDW Morning Update Video – May 3, 2024.
Click here to download MP3
|
Beginners Series Webinar: Join us on Friday, May 3rd at 2 PM (ET) for our NDW Beginners Series Webinar. This week's topic is: Idea Generation with Stocks and Funds Register Here |
If you take a trip to Richmond, stop in the NDW office. While you're there, take a look inside the fridge. While each analyst has his respective favorite drink of choice- the one thing you will notice is that there is no shortage of caffeine to be had. From the 300 mg Bang Energy to perhaps the more health-conscious V8 energy drink (with a measly 80 mg of caffeine,) we always have plenty in stock. For clients, it can be easy to “buy what you know,” like owning shares of their favorite supermarket, apparel, or yes, even energy drink. If your client liked Monster MNST over the last 15 years, that wasn’t such a bad strategy. Since May 1st, 2009 MNST is up nearly 1,500%- more than tripling SPX's performance over the same time frame.
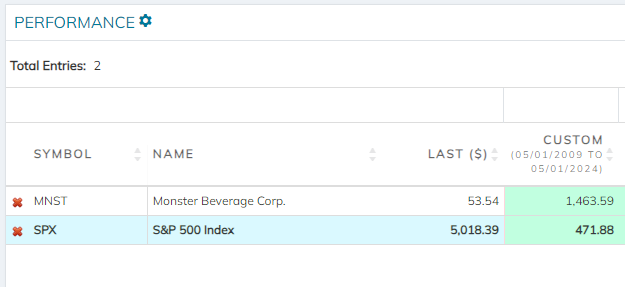
With caffeine being such a mainstay in many clients' lives, this week’s negative trend change for MNST brings a nice opportunity to cover this ‘Buy What You Know” idea with an NDW lens. To the dismay of some in the office who enjoy a Monster energy drink from time to time, the negative trend break leaves MNST at its worst technical attribute rating in roughly 2 years, suggesting the stock could be having some caffeine withdrawals in the near-term. While it does remain technically actionable by our standards, 2024’s decline leaves much to be desired for the name. Yesterday’s WYA talked about the lackluster results for the other side of everyone’s caffeine addiction- SBUX, as it cited weak demand across the globe. For those of you at home keeping track of the “buy what you know” tally- chalk the caffeine crew up for a mid-afternoon crash.
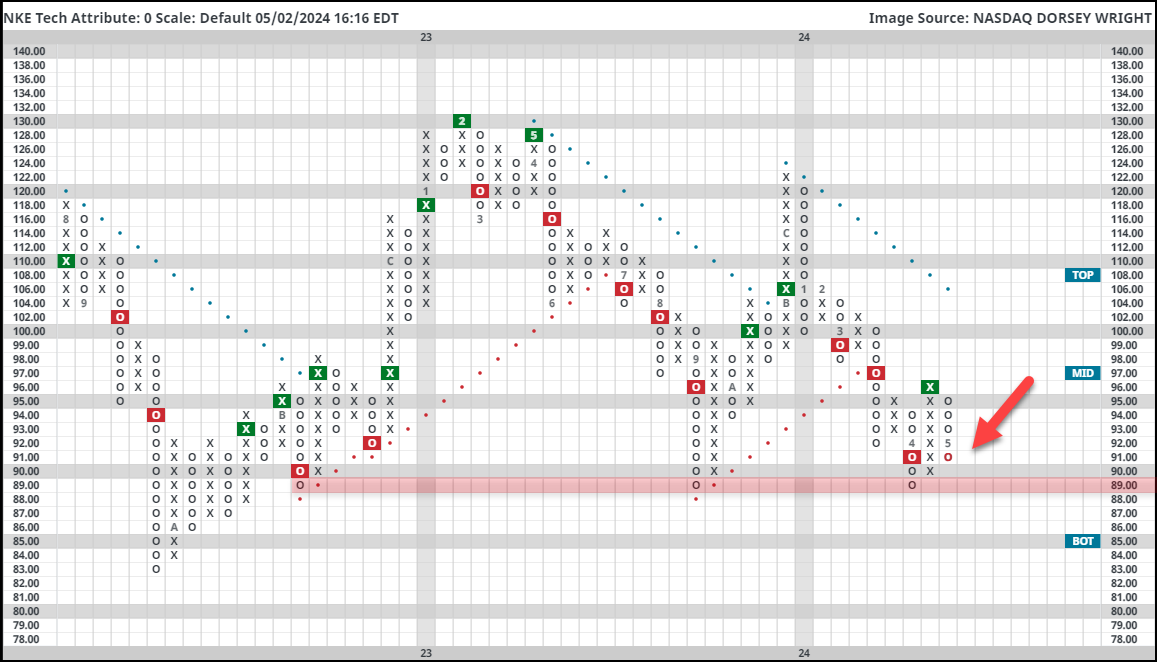
Nike has failed to motivate investors to ‘Just Do It” so far in 2024, as this 0/5’er has fallen nearly 17% through April. The stocks ranks poorly within the Apparel Sector Matrix as it looks to hold off an attack of significant lows around $89. The path of least resistance looks to be lower for now… so perhaps pull out your Nike Shoes and run away from the name. LULU is in a similar position, falling over 30% in 2024. Clearly, investors may “know” these brands, but it doesn’t seem as if they are buying their products… or their stock… quite as much as they used to.
Consumer spending has been the backbone for the economy over the last few years. But even as low cost options like MCD cite a more cost-conscious customer, it goes without saying that the “quality” brands our clients enjoy (typically consumer discretionary firms) face a changing consumer profile. Of course, buying “what you know” is completely subjective- that being not everyone likes caffeine or finds themselves taking part in the growing “athleisure” movement with NKE or LULU. While the exact economics behind a changing consumer are outside the scope of today’s piece, it does beg the question: How can I help my client “Buy What They Know” while ensuring price sits on our side? Technical Attribute Scores give you a quick and easy way to do just that. A use case entails a client calling and asking your opinion on their favorite brand for their portfolio. A quick look at the NDW score (sticking to strong stocks with a 4 or 5 TA score) gives you an opinion on the technical side of things, helping shield your client from names they might know… but are better suited for their closet rather than their portfolio.

With the start of May, we have also officially moved into the “seasonally weak” half of the year, which lasts from May through October. We are all familiar with the saying "sell in May and go away," which proposes that portfolio growth would do just as well if all holdings were sold as they would be if invested in the market from May through October. Typically, conjecture doesn’t mature into an adage without basis and market seasonality is just such an example as it has shown an impressive trend in terms of magnitude, consistency, and longevity. We’ve discussed seasonality many times over the years and as we switch between seasonally biased periods, we wanted to revisit the subject today.
The end of trading on Tuesday, April 30 brought the end of the seasonally strong period, which began with the close of the market on Tuesday, October 31, 2023. Over this period, the Dow Jones Industrial Average (.DJIA) returned 14.41%, which is almost double the historical average return during the seasonally strong period.
Years ago, we began using the Stock Trader's Almanac, a reference tool published by Yale Hirsch that has been a fantastic source of information on the stock market ever since. In fact, we always order several copies for the office each year (if you would like a copy, you can visit www.stocktradersalmanac.com). The premise of the "Market Seasonality" study is that historically speaking, the market performs far better during the November to May period than it does from May to November. On its own, that isn't a particularly profound statement, however, when we examine the magnitude of this effect over the years, its significance becomes clear. Consider this: if you had invested $10,000 in the Dow Jones on April 30 and sold it on October 31 each year since 1950, your cumulative return would be only about $13,497. Meanwhile, the same $10,000, invested only during the seasonally strong six months of the year, would now be worth just almost $1.4 million. Put another way, almost all the growth of the Dow since 1950 has effectively occurred during the "good" six months of the year.
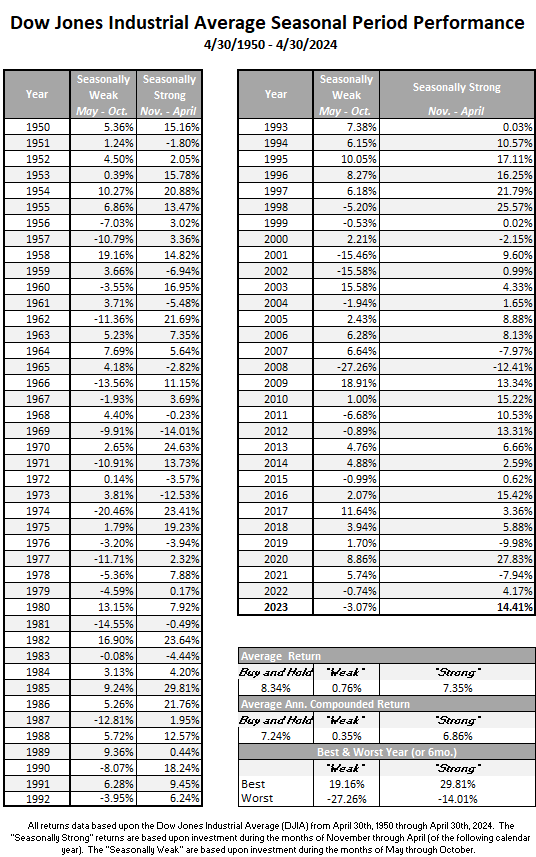
In the graph below, we have reproduced the US Market Seasonality strategy that was first published in the Stock Trader's Almanac beginning in 1950 based upon the Dow Jones Industrial Average. The purple line reflects the seasonally weak period, while the green line shows the seasonally strong six months. You will note that a theoretical $10,000 initial investment in 1950 is barely on the positive side when invested only from May through November. On the other hand, an identical $10,000 initial investment grew to $1,363,575 with an average annualized return of 7.35% if invested only from November through May each year.

*All returns data is based upon the Dow Jones Industrial Average (DJIA) from April 30, 1950 through Aprill 30, 2024. The "Seasonally Strong" returns are based upon investment during the months of November through April (of the following year). The "Seasonally Weak" are based upon investment during the months of May through October. Performance of the switching strategy is the result of back-testing. Back-tested performance results have certain limitations. Such results do not represent the impact of material economic and market factors might have on an investment advisor’s decision-making process if the advisor were actually managing client money. Back-testing performance also differs from actual performance because it is achieved through retroactive application of a model investment methodology designed with the benefit of hindsight. The performance numbers above are pure price returns, not inclusive of dividends or all potential transaction costs. Investors cannot invest directly in an Index. Past performance is not indicative of future results. Potential for profits is accompanied by possibility of loss.
Market Seasonality Notes
We acknowledge that this study is not a sophisticated tool for risk management, but it is interesting and does expose biases within the market. As mentioned above, we are coming off a seasonally “strong” period in the market which saw the Dow post a gain of more than 14%, well above the average strong period return of 7.35%. Currently, US equities are on strong footing, as they lead the DALI asset class rankings, followed by international equities and commodities. Meanwhile, technology remains atop the sector rankings. So, although we are now entering what has been the traditionally weak period for the market, this does not guarantee that these trends will reverse to produce a weak equity market over the next six months. It does, however, provide an opportunity to consider seasonal strategies that can position portfolios to take advantage of these historical biases. We will discuss a few such strategies in this report over the next few days.
Check out this week's Group Score Overview (4:09)
As we touched on in Tuesday’s Were You Aware, utilities have been a surprisingly strong sector in the market this year. The recent strength has sent the utilities group’s average score above 3.0 for the first time since October 2022. The ascent in score started last year in October when the utilities group hit an all-time score low in October 2023 of 0.88. On top of coming off of an all-time score low, utilities have a score direction of 2.14, one of its highest as of Wednesday's close. The positive technical developments come alongside some potential long-term fundamental tailwinds. While most conversations around AI have been about revolutionizing work and productivity, its energy requirements are less discussed. Some analyses project AI servers could use between 85 to 134 terawatt hours annually by 2027 for a middle-ground estimate. This would account for about 0.5% of the world’s current electricity use, about as much as Argentina or Sweden uses in an entire year (NYT). Overall, some positive technical and fundamental developments appear to be showing up in the utilities sector.

Looking at some price action, the Utilities Select Sector SPDR Fund (XLU) is trading on two consecutive buy signals for the first time since early 2022. The fund also returned to a positive trend in April after holding a negative trend since September 2022 and reversed back into a column of Xs on its relative strength chart versus the market yesterday. Some headwinds may appear in the short term since recent action has put XLU into heavily overbought territory. Nonetheless, XLU has made enough technical improvements to consider, especially for those looking for equity income. XLU has a yield of 3.26%. There is a good amount of resistance nearby, ranging from $69 to $73. On the bright side, support isn’t too far away ranging from $60 to $63.


Average Level
-29.14
| < - -100 | -100 - -80 | -80 - -60 | -60 - -40 | -40 - -20 | -20 - 0 | 0 - 20 | 20 - 40 | 40 - 60 | 60 - 80 | 80 - 100 | 100 - > |
|---|---|---|---|---|---|---|---|---|---|---|---|
|
Buy signaloneq
|
|||||||||||
|
Buy signalspy
|
|||||||||||
|
Buy signalrsp
|
|||||||||||
|
Sell signaliwm
|
|||||||||||
|
Buy signalshy
|
Buy signalvoog
|
||||||||||
|
Sell signalief
|
Buy signalVOOV
|
||||||||||
|
Sell signalagg
|
Sell signalfxe
|
Buy signalXLG
|
|||||||||
|
Sell signaltlt
|
Buy signaldia
|
Buy signalIJH
|
|||||||||
|
Sell signallqd
|
Buy signalQQQ
|
Buy signalefa
|
Buy signalUSO
|
Buy signaldvy
|
Buy signaldx/y
|
||||||
|
Sell signalicf
|
Buy signalhyg
|
Buy signalijr
|
Buy signalgsg
|
Buy signaleem
|
Buy signalgcc
|
Buy signalgld
|
|||||
| < - -100 | -100 - -80 | -80 - -60 | -60 - -40 | -40 - -20 | -20 - 0 | 0 - 20 | 20 - 40 | 40 - 60 | 60 - 80 | 80 - 100 | 100 - > |
| AGG | iShares US Core Bond ETF |
| USO | United States Oil Fund |
| DIA | SPDR Dow Jones Industrial Average ETF |
| DVY | iShares Dow Jones Select Dividend Index ETF |
| DX/Y | NYCE U.S.Dollar Index Spot |
| EFA | iShares MSCI EAFE ETF |
| FXE | Invesco CurrencyShares Euro Trust |
| GLD | SPDR Gold Trust |
| GSG | iShares S&P GSCI Commodity-Indexed Trust |
| HYG | iShares iBoxx $ High Yield Corporate Bond ETF |
| ICF | iShares Cohen & Steers Realty ETF |
| IEF | iShares Barclays 7-10 Yr. Tres. Bond ETF |
| LQD | iShares iBoxx $ Investment Grade Corp. Bond ETF |
| IJH | iShares S&P 400 MidCap Index Fund |
| ONEQ | Fidelity Nasdaq Composite Index Track |
| QQQ | Invesco QQQ Trust |
| RSP | Invesco S&P 500 Equal Weight ETF |
| IWM | iShares Russell 2000 Index ETF |
| SHY | iShares Barclays 1-3 Year Tres. Bond ETF |
| IJR | iShares S&P 600 SmallCap Index Fund |
| SPY | SPDR S&P 500 Index ETF Trust |
| TLT | iShares Barclays 20+ Year Treasury Bond ETF |
| GCC | WisdomTree Continuous Commodity Index Fund |
| VOOG | Vanguard S&P 500 Growth ETF |
| VOOV | Vanguard S&P 500 Value ETF |
| EEM | iShares MSCI Emerging Markets ETF |
| XLG | Invesco S&P 500 Top 50 ETF |
| Symbol | Company | Sector | Current Price | Action Price | Target | Stop | Notes |
|---|---|---|---|---|---|---|---|
| KRG | Kite Realty Group Trust | Real Estate | $21.42 | 19 - 21 | 34.50 | 16 | 5 for 5'er, 11 of 113 in REAL sector matrix, LT pos mkt RS, spread quintuple top, 4.65% yield |
| OEC | Orion SA | Chemicals | $23.61 | 22 - 24 | 45.50 | 19 | 4 for 5'er, top third of CHEM sector matrix, LT pos mkt RS, spread quad top, R-R>5, Earn. 5/2 |
| CCEP | Coca-Cola Europacific Partners PLC | Food Beverages/Soap | $71.59 | 60s | 97 | 56 | 5 for 5'er, top 25% of FOOD sector matrix, spread quad top, R-R~3.0, 3% yield |
| CXT | Crane NXT Co. | Electronics | $59.62 | hi 50s - low 60s | 76 | 48 | Top half of MACH sector matrix, bullish catapult, Earn. 5/8 |
| MMC | Marsh & McLennan Companies, Inc. | Insurance | $199.77 | 190s - low 200s | 234 | 180 | 5 for 5'er, favored INSU sector, LT pos mkt RS, quad top breakout, 1.4% yield |
| BLMN | Bloomin' Brands Inc | Restaurants | $25.04 | hi 20s - low 30s | 41 | 24 | 5 for 5'er, #10 of 27 in REST sector matrix, LT pos mkt RS, quintuple top, R-R>2.0, 3.2% yield, Earn. 5/7 |
| HRB | H&R Block, Inc. | Business Products | $47.70 | mid 40s - lo 50s | 71 | 39 | 5 TA rating, top 33% of BUSI sector matrix, LT pos trend, LT pos. mkt. RS, buy-on-pullback, R-R > 2, Earn. 5/9 |
| RPM | RPM, Inc. | Chemicals | $107.43 | mid 100s - hi 110s | 159 | 91 | 5 TA rating, LT RS buy, consec. buy signals, top 50% of CHEM sector matrix, buy-on-pullback, R-R > 2 |
| GS | Goldman Sachs Group, Inc. | Wall Street | $426.95 | hi 380s - low 410s | 484 | 348 | 4 for 5'er, top half of WALL sector matrix, one box from mkt RS buy signal, quad top breakout, 2.75% yield |
| CI | CIGNA Group/The | Insurance | $357.18 | 332 - lo 360s | 428 | 288 | 5 TA rating, top half of INSU sector matrix, LT RS buy, buy-on-pullback |
| AVNT | Avient Corp | Chemicals | $42.98 | low 40s | 71 | 35 | 4 for 5'er, top half of favored CHEM sector matrix. LT pos mkt RS, spread triple top, R-R>4.0, 2.5% yield Earn. 5/7 |
| REVG | REV Group Inc | Autos and Parts | $21.91 | 19 - lo 20s | 33.50 | 17 | 5 TA rating, top decline of ATUO sector matrix, LT RS buy, R-R > 3 |
| BAH | Booz Allen Hamilton Holding | Business Products | $147.33 | 140s | 193 | 114 | 5 for 5'er, top 25% of favored BUSI sector matrix, LT pos peer RS, pullback from ATH, 1.5% yield, Earn. 5/24 |
| GBX | The Greenbrier Companies, Inc. | Transports/Non Air | $49.55 | hi 40s - low 50s | 87 | 43 | 5 for 5'er, top 20% of favored TRAN sector matrix, pullback from multi-year high, R-R>4.0, 2.3% yield |
| JPM | J.P. Morgan Chase & Co. | Banks | $191.86 | lo 180s - hi 190s | 258 | 148 | 5 TA rating, RS buy, top 10% of BANK sector matrix, consec. buy signals |
| WSM | Williams-Sonoma, Inc. | Retailing | $283.61 | 280s - 290s | 362 | 232 | 5 for 5'er, #2 of 84 in RETA sector matrix, multi buy signals, pullback from ATH, 1.6% yield, Earn. 5/21 |
| PSTG | Pure Storage | Semiconductors | $50.13 | $49 to $58 | $74 | $38 | 5 for 5'er, pos. trend since June 2023, ranks 3rd in Semiconductors sector matrix. Earnings 5/29. |
| ORCL | Oracle Corporation | Software | $114.63 | 110s - low 120s | 150 | 99 | 4 for 5'er, top half of SOFT sector matrix. LT pos mkt RS, spread triple top, pullback from ATH, 1.4% yield |
| AMP | Ameriprise Financial | Finance | $413.44 | 390s - 410s | 532 | 368 | 5 for 5'er, top half of FINA sector matrix, LT pos peer & mkt RS, triple top, pullback from ATH, 1.4% yield |
| LIN | Linde Plc | Chemicals | $442.03 | hi 410s - lo 460s | 572 | 360 | 5 TA rating, consec. buy signals, LT RS buy, buy-on-pullback |
| OMF | OneMain Holdings Inc. | Finance | $50.76 | hi 40s - low 50s | 81 | 43 | 5 for 5'er, top half of FINA sector matrix, LT pos mkt RS, multiple buy signals, R-R>3.0, 7.9% yield |
| KBR | KBR, Inc. | Aerospace Airline | $65.56 | mid-hi 60s | 92 | 54 | 4 TA rating, top half of AERO sector RS matrix, LT pos. mkt. RS, consec. buy signals, R-R > 2 |
| Symbol | Company | Sector | Current Price | Action Price | Target | Stop | Notes |
|---|---|---|---|---|---|---|---|
| MTCH | Match Group, Inc. | Internet | $31.15 | (mid 30s) | 26 | 40 | 0 for 5'er, bottom half of INET sector matrix, LT neg trend & RS, Earn. 5/7 |
| Comment | |||||||
|---|---|---|---|---|---|---|---|
|
|
|||||||
KBR KBR, Inc. ($66.24) R - Aerospace Airline - KBR has a 4 for 5 TA rating and sits in the top half of the aerospace airline sector RS matrix. The stock pushed higher this week after its earnings release to notch a second consecutive buy signal with a spread triple top break at $66, which also marked a new all-time high. We have seen KBR maintain an RS buy signal against the market since 2019 and it just reversed back up into a column of X's against the market Tuesday, confirming the positive weight of the evidence. Exposure may be considered on this breakout in the mid-to-upper $60s. Our initial stop will be set at $54, which would move the stock to a sell signal and negative trend. The bullish price objective of $92 will serve as our price target, offering a reward-to-risk ratio north of 2-to-1.
| 21 | 22 | 23 | 24 | |||||||||||||||||||||||||||||||||||||||||||||||||
| 66.00 | • | X | 66.00 | |||||||||||||||||||||||||||||||||||||||||||||||||
| 65.00 | X | • | 4 | X | 65.00 | |||||||||||||||||||||||||||||||||||||||||||||||
| 64.00 | X | O | • | X | O | X | 64.00 | |||||||||||||||||||||||||||||||||||||||||||||
| 63.00 | X | O | • | • | X | O | X | 63.00 | ||||||||||||||||||||||||||||||||||||||||||||
| 62.00 | X | 7 | 9 | X | • | X | O | 62.00 | ||||||||||||||||||||||||||||||||||||||||||||
| 61.00 | X | O | X | O | X | O | • | 3 | Mid | 61.00 | ||||||||||||||||||||||||||||||||||||||||||
| 60.00 | 6 | 8 | X | O | X | O | • | X | 60.00 | |||||||||||||||||||||||||||||||||||||||||||
| 59.00 | X | O | O | X | O | X | 59.00 | |||||||||||||||||||||||||||||||||||||||||||||
| 58.00 | X | 5 | A | X | O | X | 58.00 | |||||||||||||||||||||||||||||||||||||||||||||
| 57.00 | • | X | O | X | O | O | X | 57.00 | ||||||||||||||||||||||||||||||||||||||||||||
| 56.00 | X | 4 | X | • | X | O | 4 | B | 1 | X | 56.00 | |||||||||||||||||||||||||||||||||||||||||
| 55.00 | X | O | X | O | X | O | • | X | O | X | O | X | O | 2 | 55.00 | |||||||||||||||||||||||||||||||||||||
| 54.00 | X | O | X | O | X | O | • | • | • | • | X | 3 | X | • | O | C | O | X | • | Bot | 54.00 | |||||||||||||||||||||||||||||||
| 53.00 | X | O | X | O | O | X | • | X | • | C | X | • | X | O | X | • | O | X | O | X | • | 53.00 | ||||||||||||||||||||||||||||||
| 52.00 | X | O | O | X | X | O | X | O | • | X | O | X | O | 2 | O | X | • | O | X | O | • | 52.00 | ||||||||||||||||||||||||||||||
| 51.00 | 3 | O | 6 | O | X | O | X | O | • | B | O | X | O | X | O | • | O | X | • | 51.00 | ||||||||||||||||||||||||||||||||
| 50.00 | X | O | X | O | X | 8 | O | • | X | O | 1 | X | • | O | • | 50.00 | ||||||||||||||||||||||||||||||||||||
| 49.00 | X | X | O | X | O | 7 | O | X | • | X | O | X | • | • | 49.00 | |||||||||||||||||||||||||||||||||||||
| 48.00 | 1 | O | X | 5 | X | O | X | O | X | X | O | X | • | O | • | 48.00 | ||||||||||||||||||||||||||||||||||||
| 47.00 | X | X | O | X | O | X | O | X | 9 | X | O | X | O | X | • | • | 47.00 | |||||||||||||||||||||||||||||||||||
| 46.00 | X | O | X | O | X | O | X | O | X | O | X | O | X | O | • | 46.00 | ||||||||||||||||||||||||||||||||||||
| 45.00 | X | O | X | O | 2 | O | X | O | X | O | A | O | X | • | 45.00 | |||||||||||||||||||||||||||||||||||||
| 44.00 | X | X | O | X | O | X | O | O | O | X | O | • | 44.00 | |||||||||||||||||||||||||||||||||||||||
| 43.00 | X | O | X | C | X | O | X | O | X | • | 43.00 | |||||||||||||||||||||||||||||||||||||||||
| 42.00 | X | X | O | X | O | O | • | O | • | 42.00 | ||||||||||||||||||||||||||||||||||||||||||
| 41.00 | 5 | O | A | B | • | • | 41.00 | |||||||||||||||||||||||||||||||||||||||||||||
| 40.00 | X | O | 9 | X | • | 40.00 | ||||||||||||||||||||||||||||||||||||||||||||||
| 39.00 | 4 | 6 | X | O | X | • | 39.00 | |||||||||||||||||||||||||||||||||||||||||||||
| 38.00 | X | O | X | O | X | • | 38.00 | |||||||||||||||||||||||||||||||||||||||||||||
| 37.00 | X | O | O | • | 37.00 | |||||||||||||||||||||||||||||||||||||||||||||||
| 36.00 | X | • | 36.00 | |||||||||||||||||||||||||||||||||||||||||||||||||
| 35.00 | X | • | 35.00 | |||||||||||||||||||||||||||||||||||||||||||||||||
| 34.00 | X | X | • | 34.00 | ||||||||||||||||||||||||||||||||||||||||||||||||
| 33.00 | 3 | O | X | • | 33.00 | |||||||||||||||||||||||||||||||||||||||||||||||
| 32.00 | 1 | 2 | O | X | • | 32.00 | ||||||||||||||||||||||||||||||||||||||||||||||
| 31.00 | X | O | X | O | • | 31.00 | ||||||||||||||||||||||||||||||||||||||||||||||
| 30.00 | X | O | X | • | 30.00 | |||||||||||||||||||||||||||||||||||||||||||||||
| 29.00 | C | O | • | 29.00 | ||||||||||||||||||||||||||||||||||||||||||||||||
| 28.00 | X | • | 28.00 | |||||||||||||||||||||||||||||||||||||||||||||||||
| 27.00 | X | • | 27.00 | |||||||||||||||||||||||||||||||||||||||||||||||||
| 26.00 | X | • | 26.00 | |||||||||||||||||||||||||||||||||||||||||||||||||
| 25.00 | A | B | • | 25.00 | ||||||||||||||||||||||||||||||||||||||||||||||||
| 24.00 | X | O | X | • | 24.00 | |||||||||||||||||||||||||||||||||||||||||||||||
| 23.00 | X | O | X | • | 23.00 | |||||||||||||||||||||||||||||||||||||||||||||||
| 22.00 | O | • | 22.00 | |||||||||||||||||||||||||||||||||||||||||||||||||
| 21 | 22 | 23 | 24 |

| DASH DoorDash, Inc. Class A ($114.04) - Retailing - DASH broke a double bottom at $124 for a third consecutive sell signal since reaching a near-term peak at $142 on the chart. The stock ultimately fell to $110, matching a February pullback level. The stock remains a high attribute name, but long-term holders should monitor current support closely. Beyond $110, additional support lies at $104 and $102, the bullish support line. |
| EIX Edison International ($71.98) - Utilities/Electricity - EIX broke a triple top at $72 to complete a shakeout pattern and return the stock to a buy signal. The stock is a 3 for 5'er that ranks in the top quartile of the Electric Utilities sector matrix and is accompanied by a yield of roughly 4.4%. Okay to consider here on the breakout. Note the stock's all-time high from mid-2023 lies at $74. Initial support resides at $67, the bullish support line, while additional support lies at $64. |
| FORM FormFactor Inc. ($51.24) - Semiconductors - FORM pushed higher Thursday after releasing earnings to break a double top at $48 before reaching a new multi-year high at $51 intraday. This 16% intraday move also moved the stock back to an RS buy signal against the market, improving it to a 4 for 5 TA rating. The weight of the technical evidence is decidedly positive here and continues to improve. However, the stock is entering overbought territory. Initial support is seen at $41. |
| MPWR Monolithic Power Systems Inc. ($716.29) - Semiconductors - MPWR moved higher Tuesday after their earnings release to break a double top at $696 before reaching $720 intraday. This also moved the stock back to a positive trend, improving it to a 4 for 5 TA rating. The weight of the technical evidence is favorable here and continues to improve. Initial support can be seen at $648 with further support seen at $608, the current location of the bullish support line, and at $592. Further overhead resistance may be seen at $736 and $776. |
| MUSA Murphy USA Inc. ($396.54) - Oil - MUSA was down more than 3% on Thursday following its earnings release and fell to a sell signal when it broke a triple bottom at $384. The weight of the evidence remains positive, however, as MUSA is a 5 for 5'er that ranks 26th out 73 names int ethe oil sector matrix. From here, the next level of support on MUSA's chart sits at $352, more than 10% away from Thursday's close. |
| NRG NRG Energy, Inc. ($75.50) - Utilities/Electricity - NRG broke a double top at $75 to return to a buy signal. The stock is a 5 for 5'er that ranks 3rd (out of 51) in the Electric Utilities sector matrix and is accompanied by a yield of roughly 2.25%. Okay to continue to dollar cost average into exposure here on the breakout. Initial support lies at $70 on the default chart, while additional near-term support can be found in the 0.50 point per box chart in the mid to upper $60s. |
| ONTO Onto Innovation Inc. ($195.03) - Semiconductors - ONTO moved higher Thursday to complete a bullish catapult with a breakout at $194. This 5 for 5'er moved to a positive trend earlier this week and sits in the top quartile of the semiconductors sector RS matrix. This is a positive sign for the stock heading into its earnings release next week on 5/9. Initial support is now seen at $180 with further support seen at $172 and $168. Further overhead resistance may be found at the all-time chart high of $198 reached twice in March. |
| UTZ UTZ Brands Inc. ($19.55) - Food Beverages/Soap - UTZ shares were up over 7% on earnings. The stock was a 4 for 5'er heading into the report and now sits above a prior key area of resistance at around $19.50. The weight of the technical evidence remains positive here. |
| Name | Option Symbol | Action | Stop Loss |
|---|---|---|---|
| Ross Stores, Inc. - $127.68 | ROST2419G130 | Buy the July 130.00 calls at 5.50 | 120.00 |
| Name | Option | Action |
|---|---|---|
| American International Group, Inc. ( AIG) | Jul. 72.50 Calls | Initiate an option stop loss of 5.00 (CP: 7.00) |
| J.P. Morgan Chase & Co. ( JPM) | Aug. 180.00 Calls | Stopped at 16.50 (CP: 16.45) |
| Name | Option Symbol | Action | Stop Loss |
|---|---|---|---|
| RTX Corp. - $101.49 | RTX2416T100 | Buy the August 100.00 puts at 3.25 | 108.00 |
| Name | Option | Action |
|---|---|---|
| CVS Health Corp. ( CVS) | Jun. 75.00 Puts | Raise the option stop loss to 16.95 (CP: 18.95) |
| The AES Corporation ( AES) | Aug. 18.00 Puts | Stopped at 19.00 (CP: 18.84) |
| Dollar General Corp. ( DG) | Aug. 140.00 Puts | Initiate an option stop loss of 8.25 (CP: 10.25) |
| Name | Option Sym. | Call to Sell | Call Price | Investment for 500 Shares | Annual Called Rtn. | Annual Static Rtn. | Downside Protection |
|---|---|---|---|---|---|---|---|
| Freeport-McMoRan Inc. $ 49.91 | FCX2416H50 | Aug. 50.00 | 3.45 | $ 22,926.15 | 27.48% | 21.99% | 6.00% |
| Name | Action |
|---|---|
| Lyft Inc Class A ( LYFT) - 15.86 | Sell the July 20.00 Calls. |
| DraftKings Inc Class A ( DKNG) - 41.82 | Sell the July 45.00 Calls. |
| Constellation Energy Corporation ( CEG) - 184.46 | Sell the August 195.00 Calls. |
| United Airlines Holdings Inc. ( UAL) - 50.67 | Sell the August 55.00 Calls. |
| Airbnb, Inc. Class A ( ABNB) - 156.16 | Sell the September 170.00 Calls. |
| Palantir Technologies Inc. Class A ( PLTR) - 22.12 | Sell the August 23.00 Calls. |
| Micron Technology, Inc. ( MU) - 109.70 | Sell the August 115.00 Calls. |
| Name | Covered Write |
|---|---|
| Lennar Corporation ( LEN - 152.47 ) | August 155.00 covered write. |
Daily Equity & Market Analysis
Loading, Please Wait...
