
With the start of a new seasonal market cycle, we examine how the weak and strong "seasons" have historically affected sector returns.
The beginning of May brings what is known as the “seasonally weak” six-month period for the market. Last week, we published articles around "market seasonality" and strategies to consider that leverage this historical bias. As we covered, the May to November period has typically provided worse returns over time than the six months from November through April. Even though that effect has been more muted in recent years, the long-term picture remains the same. We could hardly hope to explain this bias, much less the severity over time, but the "strong six months" of the year have accounted for almost all the Dow's average annual compounded return since 1950. As we covered last Thursday, the average return of the Dow during the seasonally strong six months has been better than 7%, while the "other" six months have produced an average return of less than one percent since 1950.
Those who have been following our research for any length of time know that sector rotation is a key aspect of many of our strategies. With the seasonal bias of the market in mind, we began to wonder how individual sectors might be affected by the seasonality phenomenon. While we don't have the same longevity in terms of data for sectors as we do for broad market indices, we have observed performance biases within the past 20+ years, which we illustrate below using the 40 DWA equal-weighted sector indices.
The graphics below utilize our inventory of 40 DWA equal-weighted sector indices, which have been "live" for the duration of our study period (most have been published since 1998), as well as a handful of benchmarks tracking equity and bond markets. The study includes market data from April 28, 2000, through April 30, 2024, tracking the returns of each index in the seasonal periods (the weak period spans May 1 through October 31, while strong periods span November 1 through April 30 of the following year). The results are displayed in graphs sorted by the "median" return of each index during each seasonal side of the study period, as well as the "min" and "max" returns during the respective periods. We’ve included each graphic along with key observations from each seasonal period.
Key Observations – Strong Season (November – April):
- All 40 sectors and each benchmark ended the last six months in the black. That coincides with all representatives also showing positive median returns during the “strong” seasonal period.
- The S&P 500 Index SPX rose over 20% in the last six months. Fifteen sectors bested the return of the S&P 500, which is lower than average based on median returns.
- The Dorsey Wright Building Index DWABUIL posted the highest return at a 43% gain. This sector also shows the second-highest median return during the “strong” seasonal period.
- All but five NDW sector indices were up double-digits during the seasonally strong period, compared to only 14 sectors showing a double-digit median return during the same annual period.
- The worst-performing sector index over the past six months was the Dorsey Wright Oil Service Index DWAOILS, which returned just over 4%. Oil Service and Oil stocks tend to underperform the S&P 500 during the “strong” period.

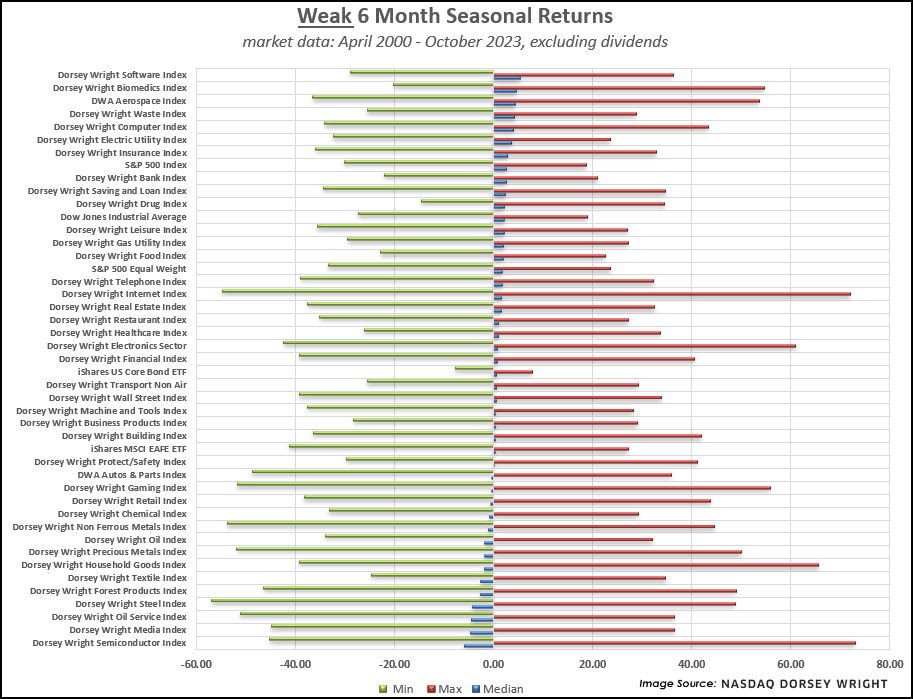
Key Observations – Weak Season (May – October):
- Performance is typically much more muted for all sectors during the “weak” seasonal period, with no representatives showing double-digit median returns.
- The Dorsey Wright Software Sector DWASOFT shows the best median returns of all the representatives during the seasonally weak period. Last year, this sector was one of only nine representatives to post a gain during the “weak” season, rising 2.5% over that span. Software stocks have generally underperformed other technology-focused areas in recent months, making it an interesting area to monitor moving forward.
- The Dorsey Wright Semiconductor Sector DWASEMI shows the lowest median returns of all the representatives during the “weak” season. This area has been one of the market leaders throughout much of the past year but has begun to show signs of weakness over the past month. This seasonality study suggests we could be in store for further turbulence in the space over the next six months.
Market seasonality is simply a historical performance bias that can be seen in examining performance over many years. Keep in mind that there have been several occasions when these trends have not played out. Considering that fact, we would certainly not advocate veering away from areas of market leadership simply because the calendar has changed. Tools like DALI and the Asset Class Group Scores provide us with a map of where the strength lies in the market now and until that picture changes, we will continue to rely on that guidance.
