Most Requested Symbols

Broad small-cap representatives have been stagnate over the past few weeks, but we have seen some major differences in the underlying sector action within the space.
The curve has an average reading of 38.83%.
Today's featured stock is Arista Networks (ANET).
ANDE, IBM, PLAY
Call: Airbnb Inc (ABNB); Put: The Boeing Company (BA); Covered Write: Ally Financial (ALLY).
NDW Morning Update Video - March 26, 2024
NDW Morning Update Video – March 26, 2024.
Click here to download MP3
Chicago RS Institute: Register to join us in person for a 3-hour educational symposium on relative strength investing. This event is for financial advisors and will offer 3 hours of CFP/CIMA credit.
When: April 23, 2024, 8 AM CT - 11 AM CT
Where: 1 South Wacker Drive, Chicago, IL, 60606
Who: Speakers include...
John Lewis, CMT, Senior Portfolio Manager; Andy Hyer, CFP, CIMA, CMT, Client Portfolio Manager; Ian Saunders, Senior Research Analyst
Cost: Free! Breakfast will also be provided.
Registration is limited to the first 75 advisors, so be sure to act fast!
As noted in a recent Alternative Assets Update, crude oil prices (CL/) tend to ride a seasonal tailwind this time of year. Year-to-date (YTD, through 3/22) crude is up 13% yet in the past 30-days alone the commodity has rallied over 4%.
Energy equities have certainly benefitted from the crude gains. For instance, the Energy Select Sector SPDR Fund (XLE) is now the second best performing of the major 11 SPDR funds YTD (up 10.21%), trailing communication services (XLC) by about 2%. Although, XLE now fights with multiyear resistance.
Said area of resistance is highlighted on the Point & Figure chart below. Note that XLE peaked in June 2022 at $93, in November 2022 at $94, in January 2023 at $93, and in September 2023 at $93. XLE currently charts at $93...again.
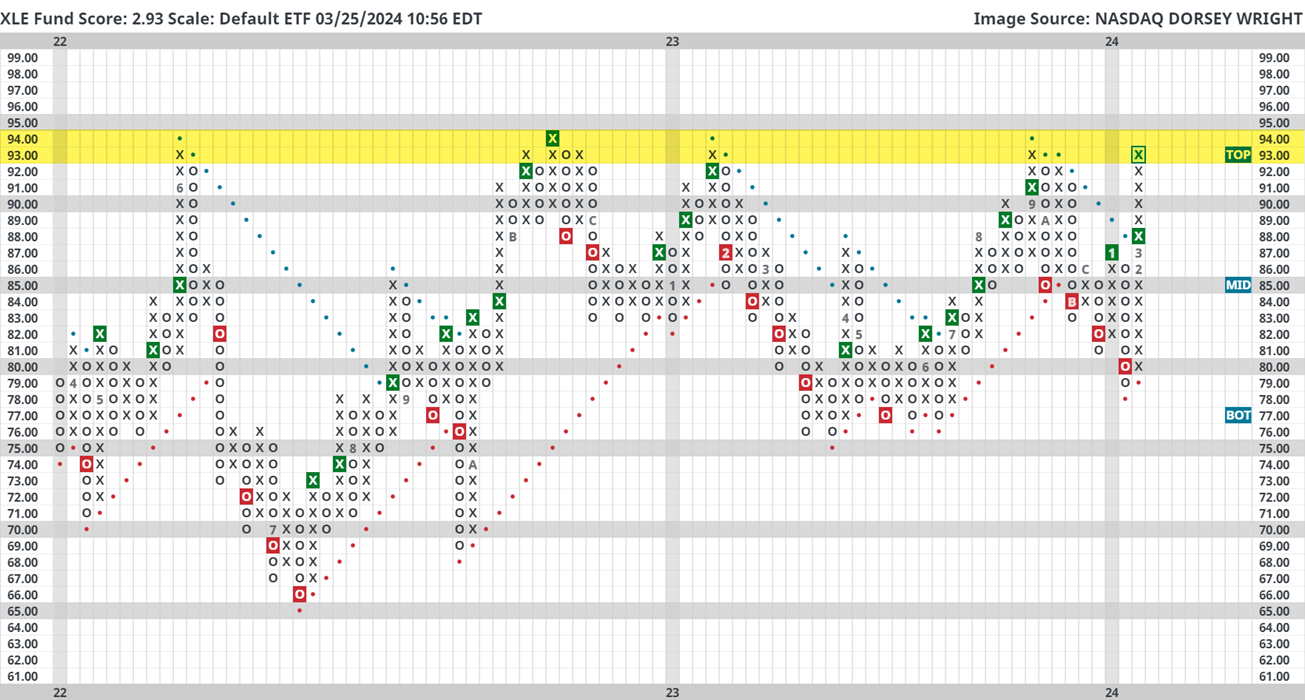
Despite the big area of resistance nearby, April seasonality could give it the final push needed to breakout to fresh highs…and with a 2.93 fund score XLE could use all the help available.
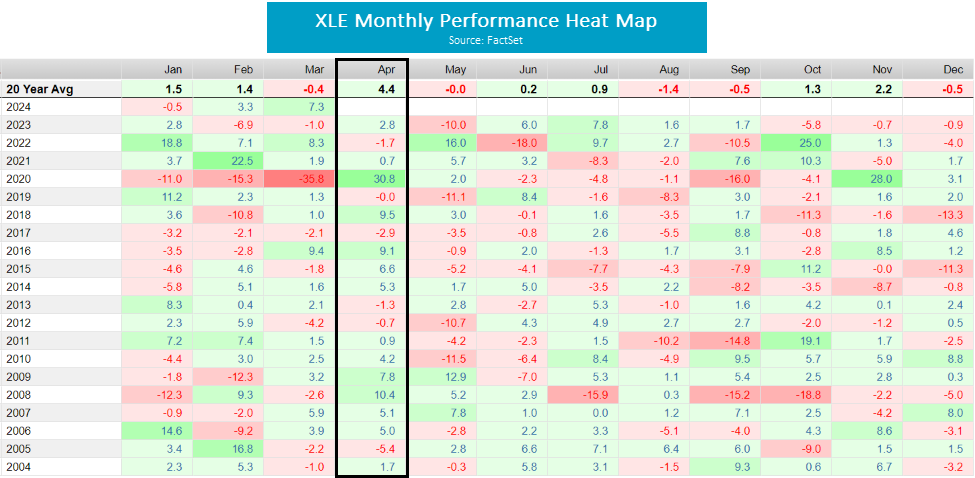
The table below shows the absolute performance of XLE every month for the past two decades. Notice that April has historically been the best month (even without the 30% gain in 2020). Furthermore, not only has April produced the best average return, it also has been positive 60% of the time which is tied with September for the highest hit rate. In the past ten years, XLE has posted a gain 70% of the time.
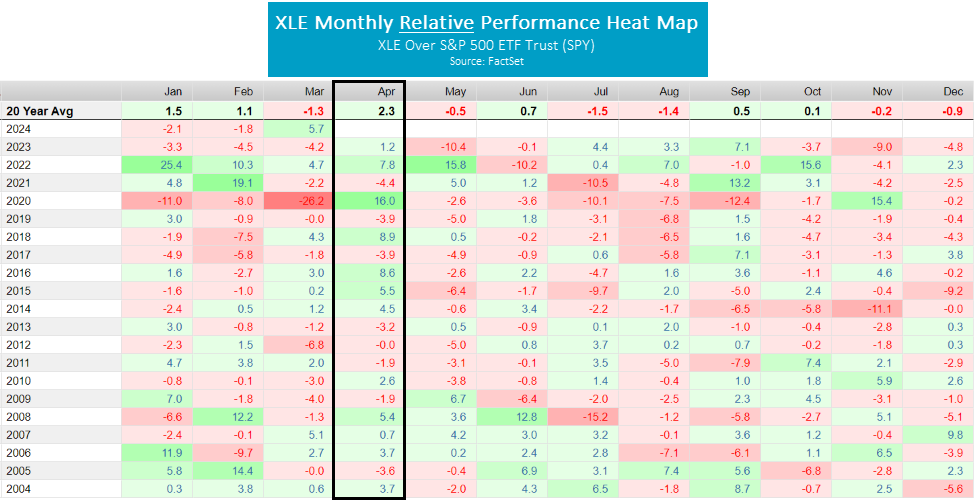
In addition to the strong magnitude of returns and positive hit rate, XLE has also tended to outperform the S&P 500 (SPY) in April. The table below displays the relative performance of XLE and SPY, so the positive/green numbers mean XLE outperformed SPY for the month while the negative/red numbers mean XLE underperformed SPY for the month. All this said, look out for energy.
Fun Fact: Of the major 11 SPDR sector funds, XLE has been the second-best performing fund in the second quarter (Q2) since 1999.

The battle between large-cap and small-cap stocks has been very lopsided over the past few years. The iShares Russell 2000 ETF IWM, the typical broad small-cap representative, has risen by just under 20% over the trailing year, far lower than the 33% rise of the S&P 500 Index over the same timeframe (through 3/22/24). While the level of improvement from small-caps has not been to the same magnitude that we have seen in large-caps, the recent market action has seen consistent appreciation from IWM. The fund moved back to a positive trend last November, is trading on three consecutive buy signals, and reached its highest level since March 2022 earlier this month at $210. Even though this is notable movement, we have seen several prior periods of near-term strength over the past two years that have not been sustained. This inherently causes many to question the legitimacy of the current rally, but there are a few points to note that make the recent rally more compelling. First, we have more consistent support baked in currently than we have seen at any other point in the past two years. The past few months of movement have left three support levels on the default chart with consistently higher lows. Second, we have seen the chart remain unchanged since reaching its rally high at the beginning of the month. Price normalization can occur in one of two ways; you either pullback in price or pullback in time. The recent action seems to represent the latter, which allows the fund to maintain its technical improvement while providing the potential for more actionable trading ranges moving forward.

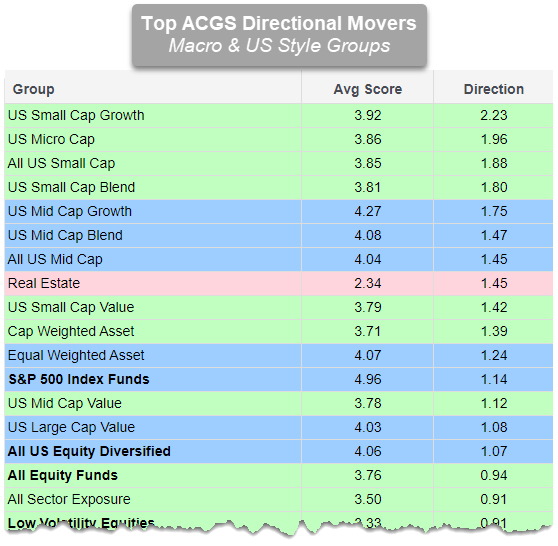
We have also seen sustained improvement from the small-cap groups on the Asset Class Group Scores (ACGS) page. This page looks at 134 different asset classifications for ETFs and mutual funds on our system, then averages the fund scores of each group member together to get a score for the broader classification. That score still ranges from 0 (worst) to 6 (best) like the individual fund scores, and typically will be quicker to change when stacked up against other asset class rankings (like DALI). We can pair together the Macro and US Style view for a better representation of movement across main asset classes and styles, then sort the rankings by the average score direction to see which areas have improved the most from their score lows over the past six months. Doing so reveals that four highest directional movers are all small-cap focused, including the broad US Small Cap group.
The breakdown of sector strength in small-caps looks very different than the relative strength picture for the large-cap space. This is most evident by examining the Invesco SmallCap sector lineup, which includes nine representatives from major sectors. So far this year, we see that only four of these sector representatives are in the black. Out of those, Industrials (PSCI), Energy (PSCE), and Consumer Discretionary (PSCD) are the only three to show better performance than IWM so far in 2024, while Materials (PSCM) is close behind. Meanwhile, we see Technology (PSCT) showing the second-worst performance out of the group at a -5.64% return this year, in stark contrast to the large-cap space. We have provided additional context on the technical posture for each of the nine small-cap sector funds, including their fund score, major relative-strength relationships, recent performance, and the DALI ranking of the broader sector (note that the small-cap sector fund lineup combines utilities and communication services into PSCU, and does not include a separate real estate fund). We will then highlight one area of strength in Industrials, one area of improvement in Energy, and one area of deterioration in Technology.

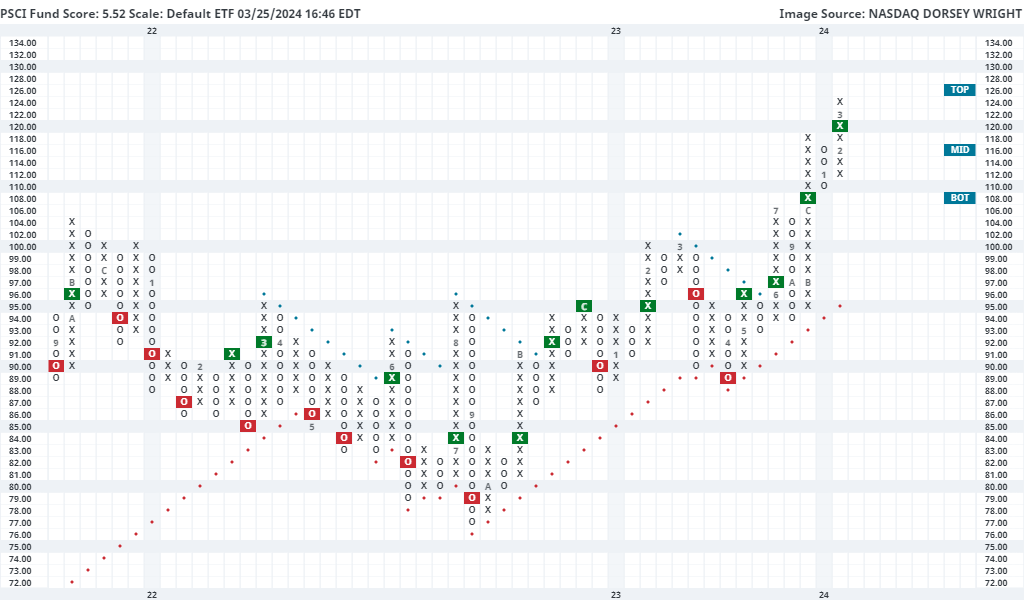
Consistent Strength – Industrials (PSCI)
The Invesco S&P SmallCap Industrials ETF PSCI has the highest fund score out of all the small-cap sector funds at 5.52 and has remained north of the 4.00 threshold since May 2023. This fund sits on four consecutive buy signals on its default chart and moved to a new all-time high last week at $124. It is also the only of the nine funds to sit on a buy signal across its trend chart, market relative strength chart, and peer relative strength chart, which compares PSCI to the large-cap industrials fund XLI. That relationship has been on an RS buy signal since December 2020, speaking to the long-term nature of its outperformance. PSCI continues to have one of the best technical pictures of any small-cap fund, but has moved into an overbought position over the past week. Those looking to add exposure may be best served easing into the current position, or waiting for a pullback/normalization in the trading band. Initial support can be seen on the near-term 1-point chart at $119 and $115, with more definitive support seen at $110 on the default chart.
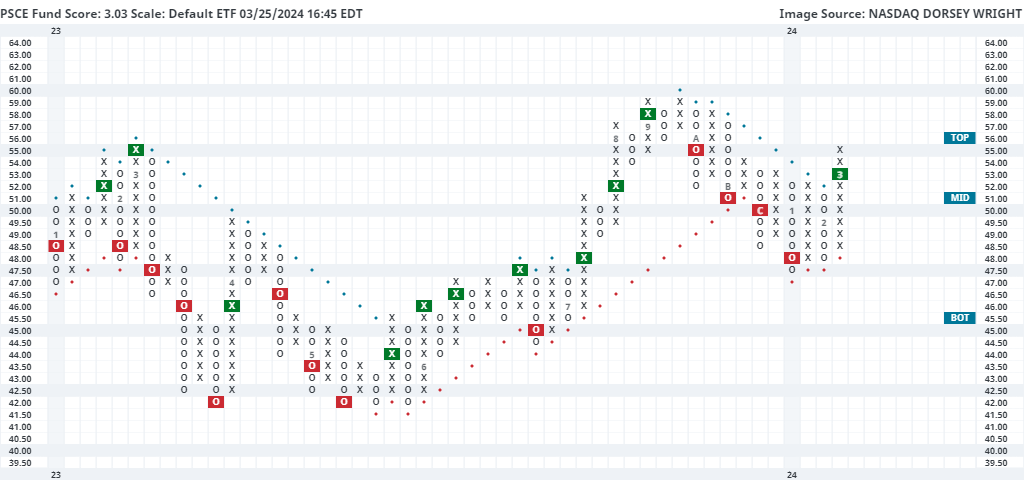
Improving Strength – Energy (PSCE)
Energy has shown consistent improvement on the back of rising crude oil prices, as we highlight in today’s Were You Aware. This has carried over to improvement in the small-cap space, with the Invesco S&P SmallCap Energy ETF PSCE moving back to a positive trend earlier this month at $53 before rising to the current chart level of $55 last week. This ended a streak of four consecutive sell signals from PSCE that began in October and ran through January of this year. The fund now carries a 3.01 fund score paired with a 1.77 score direction, providing further indication of the recent improvement. This will certainly be an area to keep an eye on if the improvement in the broader energy space continues in the second quarter. Initial support can be seen on the default chart at $48, with further support close by at $47.50. Further overhead resistance may be seen initially at $58 with further resistance seen at $59.
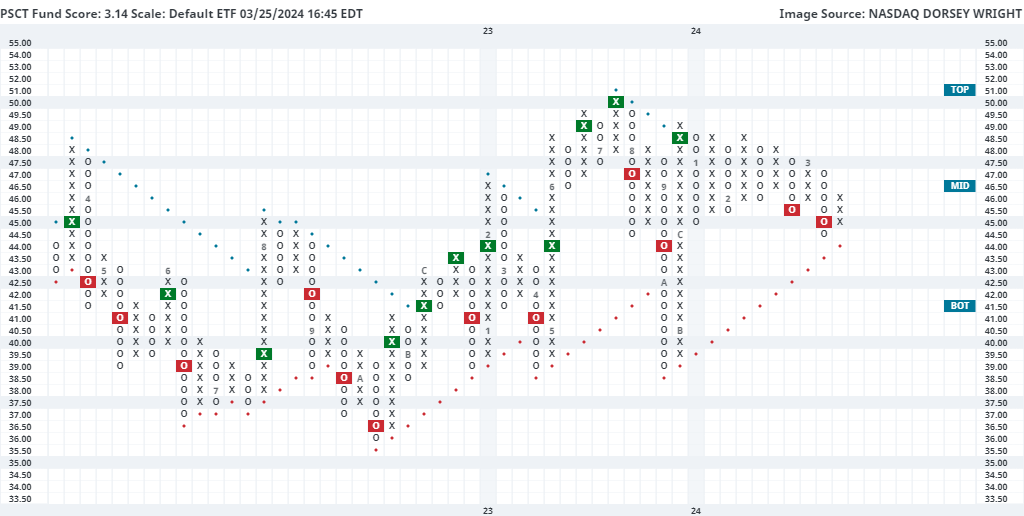
Declining Strength – Technology (PSCT)
Technology continues to dominate the top of our DALI sector rankings, but the small-cap technical picture is not telling the same story. The Invesco S&P SmallCap Information Technology ETF PSCT has moved consistently lower in recent months, giving two consecutive sell signals alongside consecutive lower highs since February. The fund still sits in a positive trend, however, it is close to reversing back to a column of Os at $44.50. That would lead to a test of its trend line which has been in place since December. The fund carries a 3.14 score which is still suitable, but that score sits far below that of the average technology fund (4.58) and has fallen 1.17 points from its relative high in January. If the trend holds and we see a reversal from the near-term deterioration, there could be some further positive tailwinds for the broader technology space and the broader small-cap space moving forward. However, further declines could spell trouble for our top-ranked sector in the coming months.
Average Level
38.83
| < - -100 | -100 - -80 | -80 - -60 | -60 - -40 | -40 - -20 | -20 - 0 | 0 - 20 | 20 - 40 | 40 - 60 | 60 - 80 | 80 - 100 | 100 - > |
|---|---|---|---|---|---|---|---|---|---|---|---|
|
Buy signalQQQ
|
Buy signalvoog
|
||||||||||
|
Buy signalUSO
|
Buy signalXLG
|
||||||||||
|
Sell signalfxe
|
Buy signaldia
|
Buy signalrsp
|
|||||||||
|
Buy signalicf
|
Buy signalgsg
|
Buy signalspy
|
|||||||||
|
Buy signalshy
|
Sell signalagg
|
Buy signalhyg
|
Buy signaloneq
|
Buy signalIJH
|
|||||||
|
Sell signalief
|
Sell signallqd
|
Buy signaldx/y
|
Buy signaleem
|
Sell signalgcc
|
Buy signalgld
|
||||||
|
Buy signaltlt
|
Buy signalijr
|
Buy signaliwm
|
Buy signaldvy
|
Buy signalVOOV
|
Buy signalefa
|
||||||
| < - -100 | -100 - -80 | -80 - -60 | -60 - -40 | -40 - -20 | -20 - 0 | 0 - 20 | 20 - 40 | 40 - 60 | 60 - 80 | 80 - 100 | 100 - > |
| AGG | iShares US Core Bond ETF |
| USO | United States Oil Fund |
| DIA | SPDR Dow Jones Industrial Average ETF |
| DVY | iShares Dow Jones Select Dividend Index ETF |
| DX/Y | NYCE U.S.Dollar Index Spot |
| EFA | iShares MSCI EAFE ETF |
| FXE | Invesco CurrencyShares Euro Trust |
| GLD | SPDR Gold Trust |
| GSG | iShares S&P GSCI Commodity-Indexed Trust |
| HYG | iShares iBoxx $ High Yield Corporate Bond ETF |
| ICF | iShares Cohen & Steers Realty ETF |
| IEF | iShares Barclays 7-10 Yr. Tres. Bond ETF |
| LQD | iShares iBoxx $ Investment Grade Corp. Bond ETF |
| IJH | iShares S&P 400 MidCap Index Fund |
| ONEQ | Fidelity Nasdaq Composite Index Track |
| QQQ | Invesco QQQ Trust |
| RSP | Invesco S&P 500 Equal Weight ETF |
| IWM | iShares Russell 2000 Index ETF |
| SHY | iShares Barclays 1-3 Year Tres. Bond ETF |
| IJR | iShares S&P 600 SmallCap Index Fund |
| SPY | SPDR S&P 500 Index ETF Trust |
| TLT | iShares Barclays 20+ Year Treasury Bond ETF |
| GCC | WisdomTree Continuous Commodity Index Fund |
| VOOG | Vanguard S&P 500 Growth ETF |
| VOOV | Vanguard S&P 500 Value ETF |
| EEM | iShares MSCI Emerging Markets ETF |
| XLG | Invesco S&P 500 Top 50 ETF |

| Symbol | Company | Sector | Current Price | Action Price | Target | Stop | Notes |
|---|---|---|---|---|---|---|---|
| KRG | Kite Realty Group Trust | Real Estate | $20.94 | 19 - 21 | 34.50 | 16 | 5 for 5'er, 11 of 113 in REAL sector matrix, LT pos mkt RS, spread quintuple top, 4.65% yield |
| OEC | Orion SA | Chemicals | $23.08 | 22 - 24 | 45.50 | 19 | 4 for 5'er, top third of CHEM sector matrix, LT pos mkt RS, spread quad top, R-R>5 |
| MNST | Monster Beverage Corp. | Food Beverages/Soap | $59.49 | mid-to-hi 50s | 70 | 47 | 5 for 5'er, top third of FOOD sector matrix, LT pos mkt RS |
| ROP | Roper Technologies Inc. | Software | $556.23 | 510s - 540s | 648 | 432 | 4 for 5'er, top half of favored SOFT sector matrix, LT pos mkt RS, quad top breakout |
| NUE | Nucor Corporation | Steel/Iron | $194.44 | 170s - 180s | 234 | 150 | 4 for 5'er, top half of STEE sector matrix, spread triple top, pullback from ATH, 1.2% yield |
| TPX | Tempur Sealy International Inc. | Household Goods | $54.89 | 49 - 53 | 80 | 41 | 5 for 5'er, top 25% of HOUS sector matrix, LT pos mkt RS, R-R>3.0 |
| BYD | Boyd Gaming Corp | Gaming | $63.17 | 61 - hi 60s | 87 | 52 | 4 TA rating, top 33% of GAME sector matrix, LT RS buy, buy-on-pullback |
| CCEP | Coca-Cola Europacific Partners PLC | Food Beverages/Soap | $71.32 | 60s | 97 | 56 | 5 for 5'er, top 25% of FOOD sector matrix, spread quad top, R-R~3.0, 3% yield |
| CXT | Crane NXT Co. | Electronics | $60.82 | hi 50s - low 60s | 76 | 48 | Top half of MACH sector matrix, bullish catapult |
| ODFL | Old Dominion Freight Line, Inc. | Transports/Non Air | $440.78 | 400s - 430s | 516 | 356 | 4 for 5'er, favored TRAN sector matrix, LT pos mkt RS, bullish triangle |
| SPB | Spectrum Brands Holdings | Food Beverages/Soap | $85.76 | hi 70s - mid 80s | 112 | 65 | 4 TA rating, top quartile of FOOD sector RS matrix, consec. buy signals, buy-on-pullback, R-R > 2 |
| ANSS | Ansys Inc | Software | $349.24 | 330s - 350s | 412 | 300 | 5 for 5'er, favored SOFT sector matrix, triple top, LT pos mkt RS, good R-R |
| MMC | Marsh & McLennan Companies, Inc. | Insurance | $204.42 | 190s - low 200s | 234 | 180 | 5 for 5'er, favored INSU sector, LT pos mkt RS, quad top breakout, 1.4% yield, Earn. 4/18 |
| IT | Gartner, Inc. | Business Products | $479.34 | 440s - 470s | 556 | 380 | 5 for 5'er, top 20% of favored BUSI sector matrix, LT pos mkt RS, quad top breakout |
| BLMN | Bloomin' Brands Inc | Restaurants | $27.31 | hi 20s - low 30s | 41 | 24 | 5 for 5'er, #10 of 27 in REST sector matrix, LT pos mkt RS, quintuple top, R-R>2.0, 3.2% yield |
| EAT | Brinker International Inc | Restaurants | $46.08 | mid 40s - lo 50s | 75 | 37 | 5 TA rating, top 25% of REST sector matrix, LT RS buy, consec. buy signals, R-R > 2.5 |
| HEI | Heico Corporation | Aerospace Airline | $193.38 | 184 - hi 190s | 262 | 152 | 5 TA rating, top half of AERO sector matrix, LT RS buy, near-term consolidation |
| HRB | H&R Block, Inc. | Business Products | $48.69 | mid 40s - lo 50s | 71 | 39 | 5 TA rating, top 33% of BUSI sector matrix, LT pos trend, LT pos. mkt. RS, buy-on-pullback, R-R > 2 |
| IOT | Samsara, Inc. Class A | Software | $37.10 | hi 30s | 65 | 30 | 5 for 5'er, top 20% of favored SOFT sector matrix, spread quad top, R-R>3.0 |
| ANET | Arista Networks Inc | Internet | $306.42 | 280s - 300s | 364 | 252 | 5 for 5'er, #7 of 48 in favored INET sector matrix, LT pos mkt RS, quad top breakout |
| Symbol | Company | Sector | Current Price | Action Price | Target | Stop | Notes |
|---|
| Comment | |||||||
|---|---|---|---|---|---|---|---|
|
|
|||||||
ANET Arista Networks Inc R ($304.70) - Internet - ANET is a 5 for 5'er that ranks seventh out of 48 names in the favored internet sector matrix and has been on a market RS buy signal since 2021. On its default chart, ANET returned to a buy signal last week when it broke a quadruple top at $292. Long exposure may be added in the $280s to $300s and we will set our initial stop at $252, a potential spread triple bottom break on ANET"s default chart. We will use the bullish price objective, $364, as our target price.
| 24 | ||||||||||||||||||||||||||||||||||||||||||||||||||||
| 304.00 | X | 304.00 | ||||||||||||||||||||||||||||||||||||||||||||||||||
| 300.00 | X | 300.00 | ||||||||||||||||||||||||||||||||||||||||||||||||||
| 296.00 | X | 296.00 | ||||||||||||||||||||||||||||||||||||||||||||||||||
| 292.00 | X | X | 292.00 | |||||||||||||||||||||||||||||||||||||||||||||||||
| 288.00 | X | O | X | X | X | X | 288.00 | |||||||||||||||||||||||||||||||||||||||||||||
| 284.00 | X | O | X | O | X | O | X | O | X | 284.00 | ||||||||||||||||||||||||||||||||||||||||||
| 280.00 | X | O | 3 | O | X | O | X | O | X | 280.00 | ||||||||||||||||||||||||||||||||||||||||||
| 276.00 | X | X | O | X | O | O | X | O | 276.00 | |||||||||||||||||||||||||||||||||||||||||||
| 272.00 | X | 2 | O | X | O | X | O | X | Mid | 272.00 | ||||||||||||||||||||||||||||||||||||||||||
| 268.00 | X | O | X | O | X | O | X | X | O | X | 268.00 | |||||||||||||||||||||||||||||||||||||||||
| 264.00 | X | O | X | O | O | X | O | X | O | 264.00 | ||||||||||||||||||||||||||||||||||||||||||
| 260.00 | X | O | O | X | O | X | 260.00 | |||||||||||||||||||||||||||||||||||||||||||||
| 256.00 | X | O | O | 256.00 | ||||||||||||||||||||||||||||||||||||||||||||||||
| 252.00 | X | 252.00 | ||||||||||||||||||||||||||||||||||||||||||||||||||
| 248.00 | X | 248.00 | ||||||||||||||||||||||||||||||||||||||||||||||||||
| 244.00 | X | 244.00 | ||||||||||||||||||||||||||||||||||||||||||||||||||
| 240.00 | X | X | 240.00 | |||||||||||||||||||||||||||||||||||||||||||||||||
| 236.00 | X | O | X | 236.00 | ||||||||||||||||||||||||||||||||||||||||||||||||
| 232.00 | X | O | X | 232.00 | ||||||||||||||||||||||||||||||||||||||||||||||||
| 228.00 | X | 1 | 228.00 | |||||||||||||||||||||||||||||||||||||||||||||||||
| 224.00 | C | 224.00 | ||||||||||||||||||||||||||||||||||||||||||||||||||
| 220.00 | X | 220.00 | ||||||||||||||||||||||||||||||||||||||||||||||||||
| 216.00 | X | X | Bot | 216.00 | ||||||||||||||||||||||||||||||||||||||||||||||||
| 212.00 | X | O | X | • | 212.00 | |||||||||||||||||||||||||||||||||||||||||||||||
| 208.00 | X | O | X | • | 208.00 | |||||||||||||||||||||||||||||||||||||||||||||||
| 204.00 | B | O | • | 204.00 | ||||||||||||||||||||||||||||||||||||||||||||||||
| 200.00 | • | X | • | 200.00 | ||||||||||||||||||||||||||||||||||||||||||||||||
| 198.00 | 9 | X | X | X | • | X | • | 198.00 | ||||||||||||||||||||||||||||||||||||||||||||
| 196.00 | X | O | X | O | X | O | X | X | O | • | X | • | 196.00 | |||||||||||||||||||||||||||||||||||||||
| 194.00 | X | O | X | O | X | O | X | O | X | O | • | X | • | 194.00 | ||||||||||||||||||||||||||||||||||||||
| 192.00 | X | X | O | O | X | O | X | O | X | O | X | X | • | 192.00 | ||||||||||||||||||||||||||||||||||||||
| 190.00 | X | X | O | X | O | A | O | X | O | O | X | O | X | • | 190.00 | |||||||||||||||||||||||||||||||||||||
| 188.00 | X | O | X | O | X | O | X | O | O | X | O | X | • | 188.00 | ||||||||||||||||||||||||||||||||||||||
| 186.00 | X | O | X | O | X | O | X | • | O | X | O | X | • | 186.00 | ||||||||||||||||||||||||||||||||||||||
| 184.00 | X | O | X | X | O | X | O | X | • | O | X | O | X | • | 184.00 | |||||||||||||||||||||||||||||||||||||
| 182.00 | X | O | X | X | X | O | X | O | X | O | X | • | O | O | X | • | 182.00 | |||||||||||||||||||||||||||||||||||
| 180.00 | X | O | X | O | X | O | X | O | X | O | X | O | X | • | O | X | • | 180.00 | ||||||||||||||||||||||||||||||||||
| 178.00 | X | • | X | O | X | O | X | O | X | O | O | O | • | O | X | • | 178.00 | |||||||||||||||||||||||||||||||||||
| 176.00 | X | O | X | • | X | O | X | O | O | • | O | X | • | 176.00 | ||||||||||||||||||||||||||||||||||||||
| 174.00 | X | O | X | O | X | O | • | O | X | • | 174.00 | |||||||||||||||||||||||||||||||||||||||||
| 172.00 | X | O | X | X | O | X | • | O | X | • | 172.00 | |||||||||||||||||||||||||||||||||||||||||
| 170.00 | X | O | X | O | X | O | X | • | O | • | 170.00 | |||||||||||||||||||||||||||||||||||||||||
| 168.00 | X | O | X | O | X | O | X | • | • | 168.00 | ||||||||||||||||||||||||||||||||||||||||||
| 166.00 | X | O | X | O | X | O | X | • | 166.00 | |||||||||||||||||||||||||||||||||||||||||||
| 164.00 | X | 6 | X | O | X | X | O | X | • | 164.00 | ||||||||||||||||||||||||||||||||||||||||||
| 162.00 | X | O | X | O | X | O | X | O | X | • | 162.00 | |||||||||||||||||||||||||||||||||||||||||
| 160.00 | X | O | X | O | X | O | X | O | X | • | 160.00 | |||||||||||||||||||||||||||||||||||||||||
| 158.00 | X | O | X | O | X | 7 | X | O | X | • | 158.00 | |||||||||||||||||||||||||||||||||||||||||
| 156.00 | X | O | O | X | O | O | 8 | • | 156.00 | |||||||||||||||||||||||||||||||||||||||||||
| 154.00 | X | O | X | O | X | • | 154.00 | |||||||||||||||||||||||||||||||||||||||||||||
| 152.00 | X | O | X | O | X | • | 152.00 | |||||||||||||||||||||||||||||||||||||||||||||
| 150.00 | X | O | • | O | • | 150.00 | ||||||||||||||||||||||||||||||||||||||||||||||
| 148.00 | X | • | • | 148.00 | ||||||||||||||||||||||||||||||||||||||||||||||||
| 146.00 | X | • | 146.00 | |||||||||||||||||||||||||||||||||||||||||||||||||
| 144.00 | X | • | 144.00 | |||||||||||||||||||||||||||||||||||||||||||||||||
| 142.00 | X | • | 142.00 | |||||||||||||||||||||||||||||||||||||||||||||||||
| 140.00 | • | 140.00 | ||||||||||||||||||||||||||||||||||||||||||||||||||
| 24 |
| ANDE The Andersons, Inc. ($56.62) - Food Beverages/Soap - Shares of ANDE broke a double top at $57 on Monday, completing a bullish triangle. The stock remains a 5 for 5'er at this time and the weight of the technical evidence is positive. Further bullish confirmation would come with a break past resistance at $58. |
| IBM International Business Machines Corp. ($188.79) - Computers - IBM fell lower Monday to break a double bottom at $190. This sell signal follows a double top formation at $198, setting up a potential shakeout pattern. The buy point on this pattern would come with a potential reversal back up into Xs, as long as the current column of Os does not exceed 7 boxes or break through additional support. Currently, that buy point would come at $196. IBM has a strong 5 for 5 TA rating and sits in the top quartile of the computers sector RS matrix. The long-term technical picture is favorable, enhancing the favorable nature of this potential trading signal. Further support can be seen initially at $180. The pattern would be completed with a potential move to $200, which would denote a triple top breakout and mark a new multi-year high. |
| PLAY Dave & Busters Entertainment ($59.64) - Restaurants - PLAY broke a double bottom at $60 to initiate a shakeout pattern as the stock fell to $59. The stock is a 5 for 5'er that ranks in the top quintile of the Restaurants sector matrix. From here, the action point for the shakeout pattern is on a reversal into Xs at $62 and the pattern would be complete upon a triple top break at $65, a potential multi-year high. From here, initial support lies at $58, while additional can be found at $48. |

| Name | Option Symbol | Action | Stop Loss |
|---|---|---|---|
| Airbnb, Inc. Class A - $167.99 | O: 24G165.00D19 | Buy the July 165.00 calls at 17.00 | 160.00 |
| Name | Option | Action |
|---|---|---|
| Halliburton Company ( HAL) | Apr. 35.00 Calls | Initiate an option stop loss of 2.00 (CP: 4.05) |
| Cadence Design Systems, Inc. ( CDNS) | Jul. 305.00 Calls | Stopped at 33.20 (CP: 31.10) |
| Amazon.com Inc. ( AMZN) | Jul. 170.00 Calls | Raise the option stop loss to 17.15 (CP: 19.15) |
| Name | Option Symbol | Action | Stop Loss |
|---|---|---|---|
| The Boeing Company - $191.41 | O: 24S195.00D19 | Buy the July 195.00 puts at 14.10 | 212.00 |
| Name | Option | Action |
|---|---|---|
| Keurig Dr Pepper Inc. ( KDP) | Apr. 32.00 Puts | Stopped at 1.90 (CP: 1.75) |
| Name | Option Sym. | Call to Sell | Call Price | Investment for 500 Shares | Annual Called Rtn. | Annual Static Rtn. | Downside Protection |
|---|---|---|---|---|---|---|---|
| Ally Financial Inc. $ 39.29 | O: 24F40.00D21 | Jun. 40.00 | 2.45 | $ 18,684.25 | 24.84% | 22.55% | 5.16% |
| Name | Action |
|---|---|
| Cleveland-Cliffs Inc. ( CLF) - 21.26 | Sell the June 21.00 Calls. |
| Carnival Corporation ( CCL) - 17.08 | Sell the June 16.00 Calls. |
| Uber Technologies, Inc. ( UBER) - 80.23 | Sell the June 80.00 Calls. |
| Bath & Body Works Inc. ( BBWI) - 46.75 | Sell the June 47.50 Calls. |
| Applied Materials, Inc. ( AMAT) - 210.21 | Sell the June 210.00 Calls. |
| Palantir Technologies Inc. Class A ( PLTR) - 24.18 | Sell the June 26.00 Calls. |
| Advanced Micro Devices, Inc. ( AMD) - 179.61 | Sell the June 180.00 Calls. |
| Hewlett Packard Enterprise Company ( HPE) - 17.37 | Sell the August 18.00 Calls. |
| Name | Covered Write |
|---|---|
| Ralph Lauren ( RL - 187.60 ) | June 195.00 covered write. |
Daily Equity & Market Analysis
Loading, Please Wait...
