Broad small-cap representatives have been stagnate over the past few weeks, but we have seen some major differences in the underlying sector action within the space.
The battle between large-cap and small-cap stocks has been very lopsided over the past few years. The iShares Russell 2000 ETF IWM, the typical broad small-cap representative, has risen by just under 20% over the trailing year, far lower than the 33% rise of the S&P 500 Index over the same timeframe (through 3/22/24). While the level of improvement from small-caps has not been to the same magnitude that we have seen in large-caps, the recent market action has seen consistent appreciation from IWM. The fund moved back to a positive trend last November, is trading on three consecutive buy signals, and reached its highest level since March 2022 earlier this month at $210. Even though this is notable movement, we have seen several prior periods of near-term strength over the past two years that have not been sustained. This inherently causes many to question the legitimacy of the current rally, but there are a few points to note that make the recent rally more compelling. First, we have more consistent support baked in currently than we have seen at any other point in the past two years. The past few months of movement have left three support levels on the default chart with consistently higher lows. Second, we have seen the chart remain unchanged since reaching its rally high at the beginning of the month. Price normalization can occur in one of two ways; you either pullback in price or pullback in time. The recent action seems to represent the latter, which allows the fund to maintain its technical improvement while providing the potential for more actionable trading ranges moving forward.

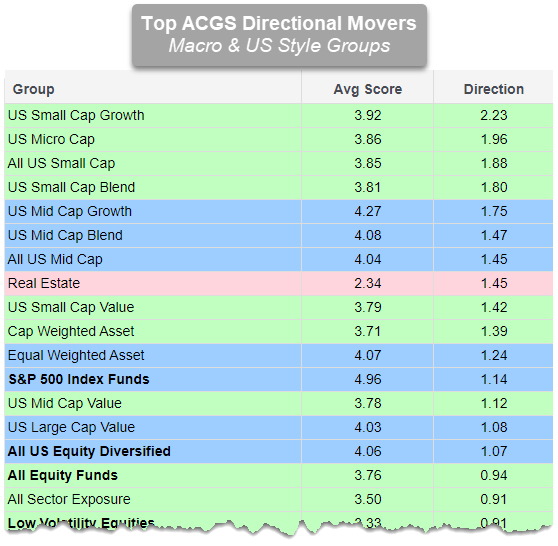
We have also seen sustained improvement from the small-cap groups on the Asset Class Group Scores (ACGS) page. This page looks at 134 different asset classifications for ETFs and mutual funds on our system, then averages the fund scores of each group member together to get a score for the broader classification. That score still ranges from 0 (worst) to 6 (best) like the individual fund scores, and typically will be quicker to change when stacked up against other asset class rankings (like DALI). We can pair together the Macro and US Style view for a better representation of movement across main asset classes and styles, then sort the rankings by the average score direction to see which areas have improved the most from their score lows over the past six months. Doing so reveals that four highest directional movers are all small-cap focused, including the broad US Small Cap group.
The breakdown of sector strength in small-caps looks very different than the relative strength picture for the large-cap space. This is most evident by examining the Invesco SmallCap sector lineup, which includes nine representatives from major sectors. So far this year, we see that only four of these sector representatives are in the black. Out of those, Industrials (PSCI), Energy (PSCE), and Consumer Discretionary (PSCD) are the only three to show better performance than IWM so far in 2024, while Materials (PSCM) is close behind. Meanwhile, we see Technology (PSCT) showing the second-worst performance out of the group at a -5.64% return this year, in stark contrast to the large-cap space. We have provided additional context on the technical posture for each of the nine small-cap sector funds, including their fund score, major relative-strength relationships, recent performance, and the DALI ranking of the broader sector (note that the small-cap sector fund lineup combines utilities and communication services into PSCU, and does not include a separate real estate fund). We will then highlight one area of strength in Industrials, one area of improvement in Energy, and one area of deterioration in Technology.

Consistent Strength – Industrials (PSCI)
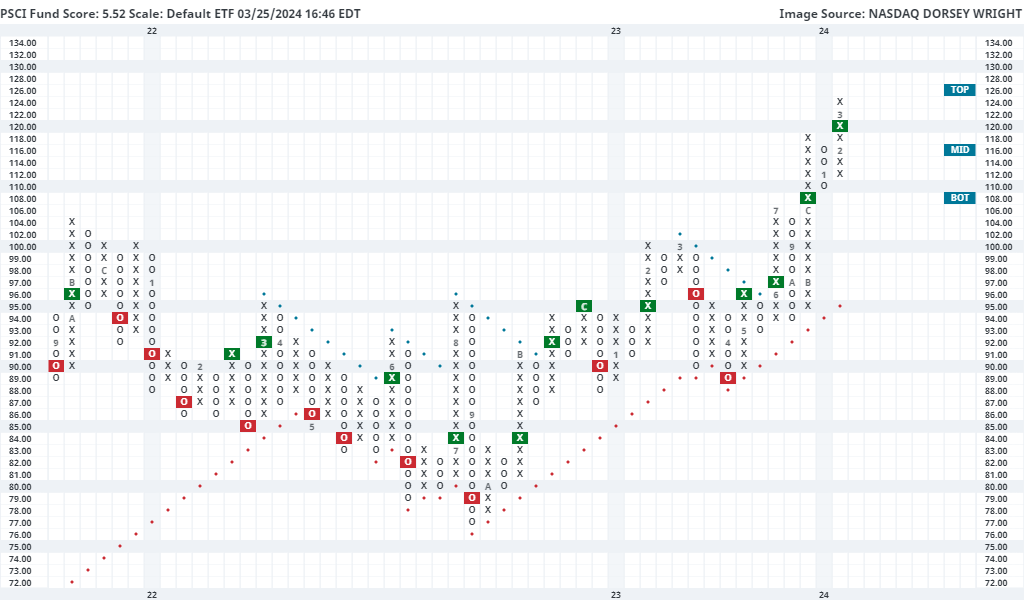
The Invesco S&P SmallCap Industrials ETF PSCI has the highest fund score out of all the small-cap sector funds at 5.52 and has remained north of the 4.00 threshold since May 2023. This fund sits on four consecutive buy signals on its default chart and moved to a new all-time high last week at $124. It is also the only of the nine funds to sit on a buy signal across its trend chart, market relative strength chart, and peer relative strength chart, which compares PSCI to the large-cap industrials fund XLI. That relationship has been on an RS buy signal since December 2020, speaking to the long-term nature of its outperformance. PSCI continues to have one of the best technical pictures of any small-cap fund, but has moved into an overbought position over the past week. Those looking to add exposure may be best served easing into the current position, or waiting for a pullback/normalization in the trading band. Initial support can be seen on the near-term 1-point chart at $119 and $115, with more definitive support seen at $110 on the default chart.
Improving Strength – Energy (PSCE)
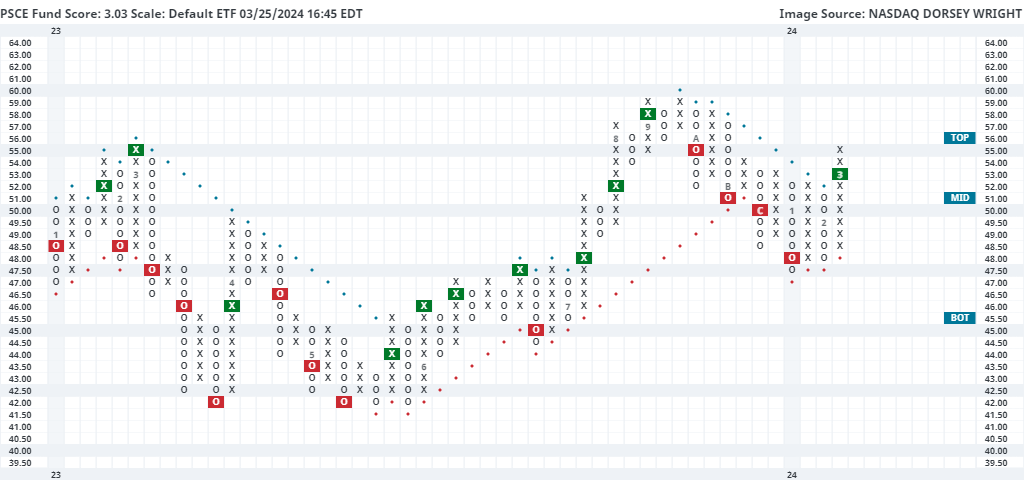
Energy has shown consistent improvement on the back of rising crude oil prices, as we highlight in today’s Were You Aware. This has carried over to improvement in the small-cap space, with the Invesco S&P SmallCap Energy ETF PSCE moving back to a positive trend earlier this month at $53 before rising to the current chart level of $55 last week. This ended a streak of four consecutive sell signals from PSCE that began in October and ran through January of this year. The fund now carries a 3.01 fund score paired with a 1.77 score direction, providing further indication of the recent improvement. This will certainly be an area to keep an eye on if the improvement in the broader energy space continues in the second quarter. Initial support can be seen on the default chart at $48, with further support close by at $47.50. Further overhead resistance may be seen initially at $58 with further resistance seen at $59.
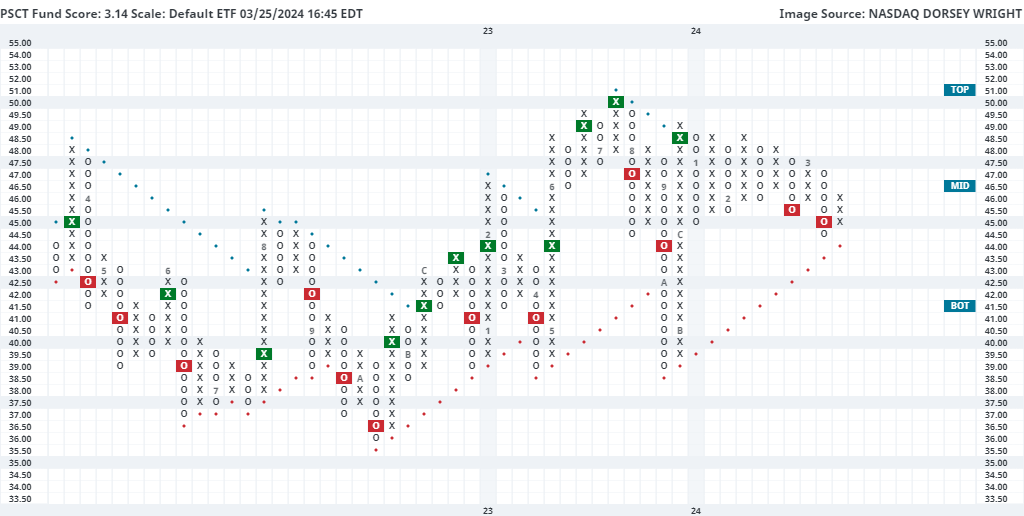
Declining Strength – Technology (PSCT)
Technology continues to dominate the top of our DALI sector rankings, but the small-cap technical picture is not telling the same story. The Invesco S&P SmallCap Information Technology ETF PSCT has moved consistently lower in recent months, giving two consecutive sell signals alongside consecutive lower highs since February. The fund still sits in a positive trend, however, it is close to reversing back to a column of Os at $44.50. That would lead to a test of its trend line which has been in place since December. The fund carries a 3.14 score which is still suitable, but that score sits far below that of the average technology fund (4.58) and has fallen 1.17 points from its relative high in January. If the trend holds and we see a reversal from the near-term deterioration, there could be some further positive tailwinds for the broader technology space and the broader small-cap space moving forward. However, further declines could spell trouble for our top-ranked sector in the coming months.