
The month of September is known for its historically lackluster returns, but data suggests it may be wrong to blame this unfortunate phenomenon on the entirety of the month. If anything, the back half of September is what investors should be pointing fingers at.
As recently discussed in a DWA Prospecting Report, September is historically one of the weakest months for equities and so far, the month is living up to precedent with flying colors. Through trading yesterday (9/15), the S&P 500 (SPX) and the Dow (.DJIA) were down over -1% while the Nasdaq Composite had lost over -2% since the end of August. With total return data beginning in 1957, that is the 18th worst first half (1H) September performance on record for the S&P 500. Before September 2020 when SPX was down -2.75%, you must look back to 2008 to find a lower 1H return.
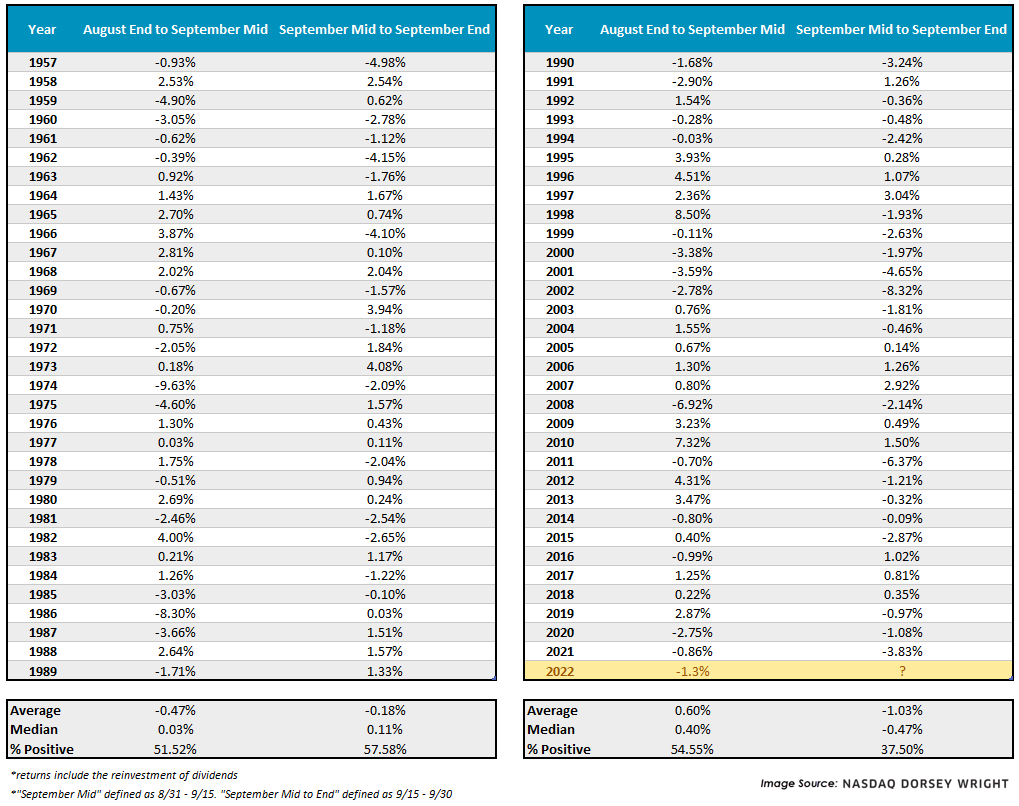
A loss of just over -1% may seem anticlimactic for a period holding the “weakest month of the year” title, but historically, the back half of September has presented the most challenges. Since 1957, the 1H September average and median return have been 0.07% and 0.19%, respectively, and positive about 53% of the time; meanwhile, the second half (2H) September average and median return have been -0.59% and -0.09%, respectively, and positive just 47% of the time.
Maybe this has been a thing of the past and archaic market environments/structures are skewing these numbers? The data suggests otherwise. In fact, since 1990 the return profile is worse as just 38% of 2H Septembers have been positive with an average loss of -1.03%. Maybe our lookback is still too far? What about just the past 10 years? From 2012 – 2021, the 2H of September has been negative 70% of the time with an average loss of -0.8%.
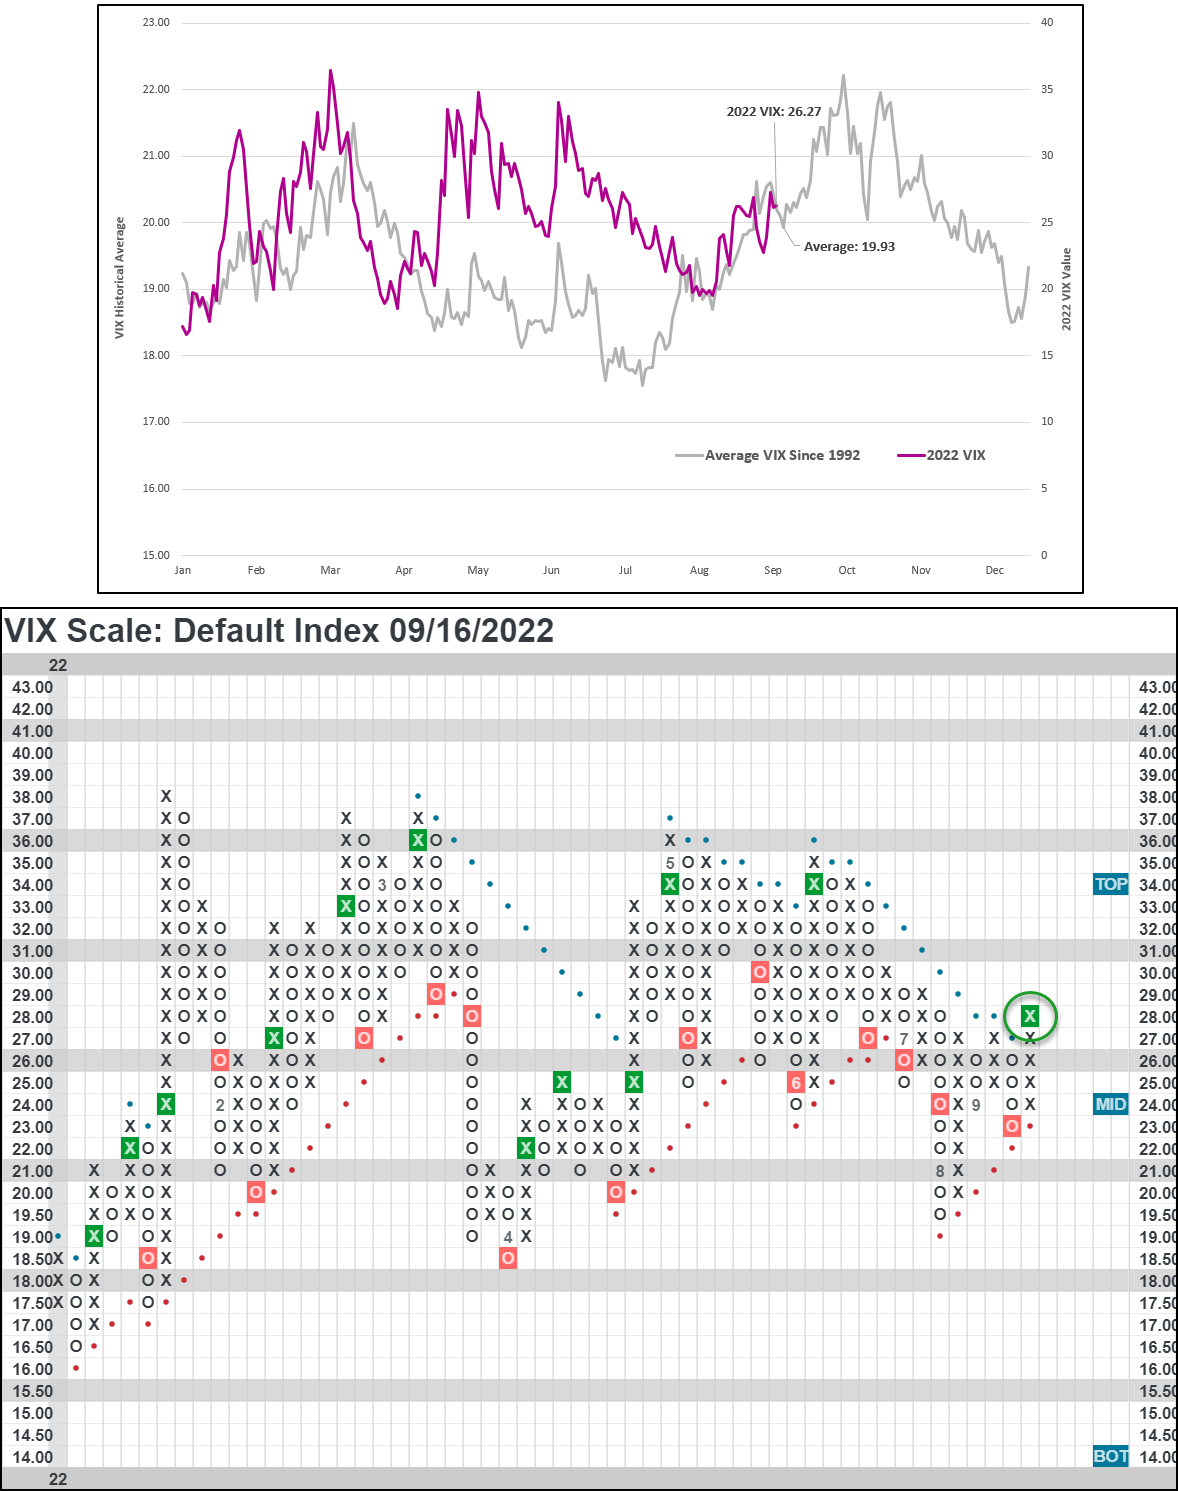
A coincidental observation relates to market volatility, commonly discussed via the CBOE SPX Volatility Index (VIX). Along with the 2H of September being historically weak from a return perspective, volatility also tends to be higher - which makes sense given that VIX and SPX tend to be negatively correlated. As for exactly why the second half of September is more volatile, the jurors and academics alike are still out deliberating, but some common attributions are quarter-end rebalancing/trading and the end of summer travel/time off work.
The VIX ended around 26 yesterday (9/15) which puts it slightly above the 30-year average, but it would not be uncommon to see this tick even higher. In fact, this upward trend could be evidenced already as earlier this week (9/13) we saw VIX break through its bearish resistance line and give a Point & Figure buy signal for the first time since June of this year.
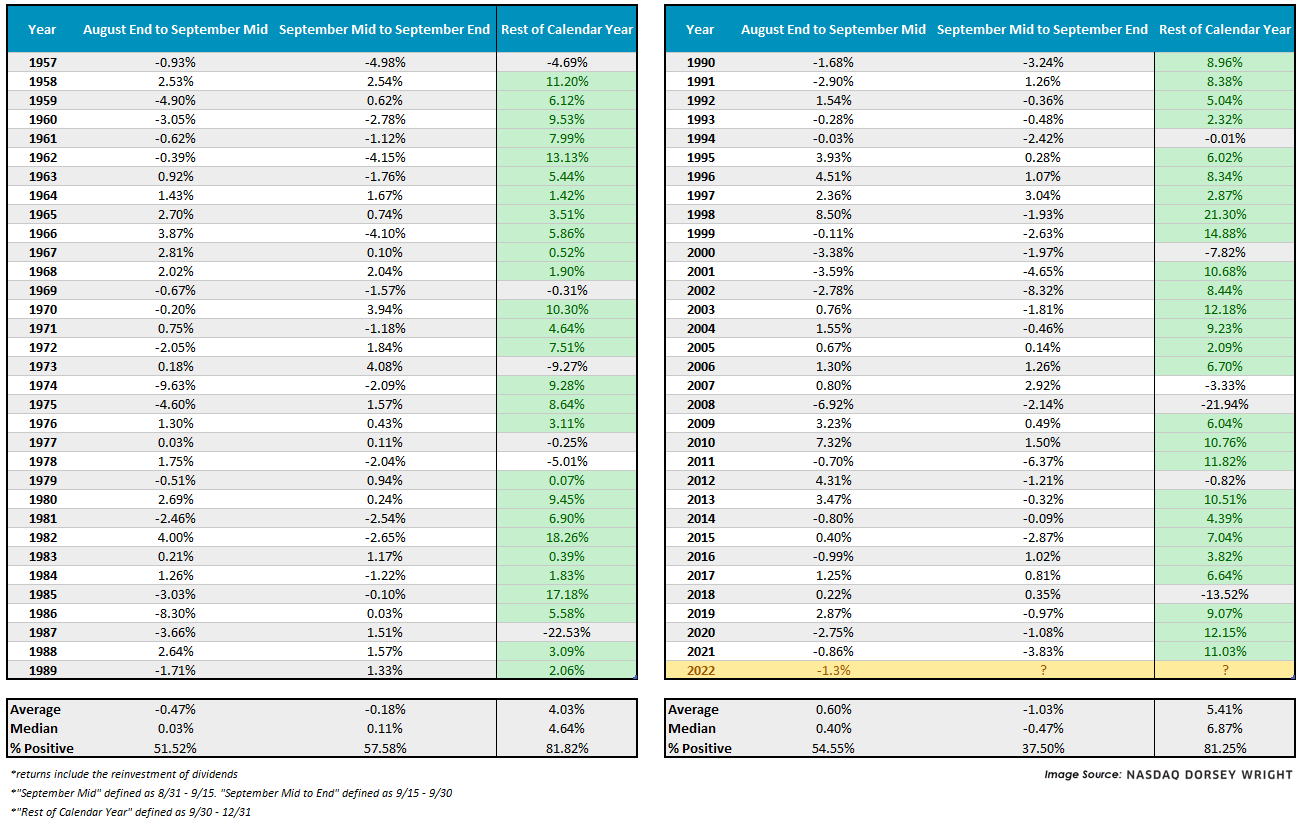
Now, before the bears get too excited about this potential weak/bumpy stretch ahead of us, notice we left out a key piece of information in the first return tables which we have now added below - the past performance for the rest of the calendar year (far right-hand column). From the end of September to the end of the calendar year the S&P 500 has been positive over 80% of the time with an average gain between 4% and 5% – and that stat is consistent from 1957 to 2021. Furthermore, of the times SPX has been down -1% or more in the 1H of September, the rest of the calendar year (from month end until year-end) has been positive 14 out of 17 times - the three outliers being 1987, 2000, and 2008.
Investors tend to have a love/hate relationship with October (which we will probably outline in a report next week) so a majority of this could be attributed to the tailwinds of the seasonally strong period in the market, Santa Claus Rally, Sell in May Go Away Come Back in November, or whatever you want to call it. Regardless, the numbers speak for themselves.
With 2022 being a year unlike any other, by seemingly countless measurements, there is a real possibility of deviating from historical norms given that has been the theme this year. However, someone with their glass half full may rationalize a potential buying opportunity within the next several weeks based on these metrics of seasonality.
