Most Requested Symbols

The average distribution reading is -7.19% oversold.
Today's featured stock is Tanger Factory Outlet Centers (SKT).
TMO, PYPL, TTD, ONTO, IDXX, GS, AMC, BE, EL, BURL, CWH, WMS, IRDM, OSTK, MSCI, PENN, ECL, TREX, RPM, CF, & ACN.
Call: Pfizer (PFE); Put Agnico-Eagle Mines (AEM); Covered Write: Tenaris S.A. (TS)
NDW Morning Update Video - January 18, 2022
NDW Morning Update Video
Click here to download MP3
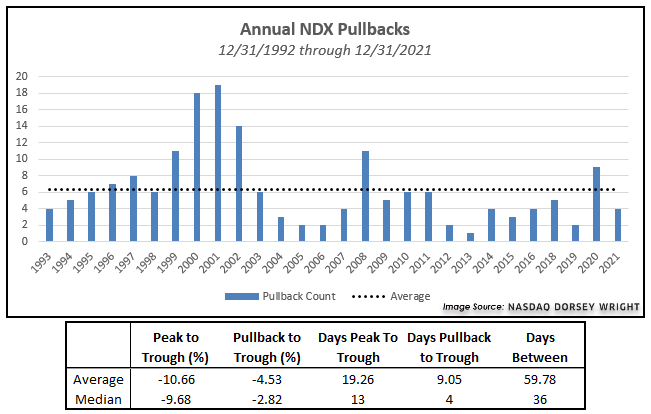
Selling pressure on the Nasdaq 100 Index NDX has continued over the past week, with the index closing at 15495.62 Thursday (1/13) to mark a drawdown of -6.47% from its closing price on December 27, 2021. The current pullback hit a 5% drawdown on January 7, which was just 35 calendar days after the prior pullback and marks the third 5% drawdown for the index over the past four months.
The Nasdaq 100 Index is not a stranger to sharp movement, as it carries fewer names and a higher concentration toward growth securities when compared to other indices. This can lead to sharper upside appreciation during periods when growth stocks are in favor, but can also produce swift declines when these areas underperform. It is important for any investor to understand the history behind sharp declines for the NDX to provide perspective on what may be expected in the future.
We have run some statistical testing on historical data for the Nasdaq 100 from December 31, 1992, through December 31, 2021, to help better understand the nature of prior 5% pullbacks. In order to qualify as a unique instance, the NDX must see the corresponding percentage drawdown from a relative closing high and the same percentage increase from that closing low.
There have been a total of 177 pullbacks for NDX since the end of 1992 (not including the current drawdown). The average peak to trough drawdown for those instances sits at -10.66% with a median of -9.68%. It took the Nasdaq 100 Index just over 19 days on average from each peak to reach the trough. Less than half of the pullbacks ultimately led to a 10% correction, with the average decline from the date of each pullback to each trough sitting at -4.53%. The index averaged just under 60 days between each 5% pullback, which would lead to six such events each year.

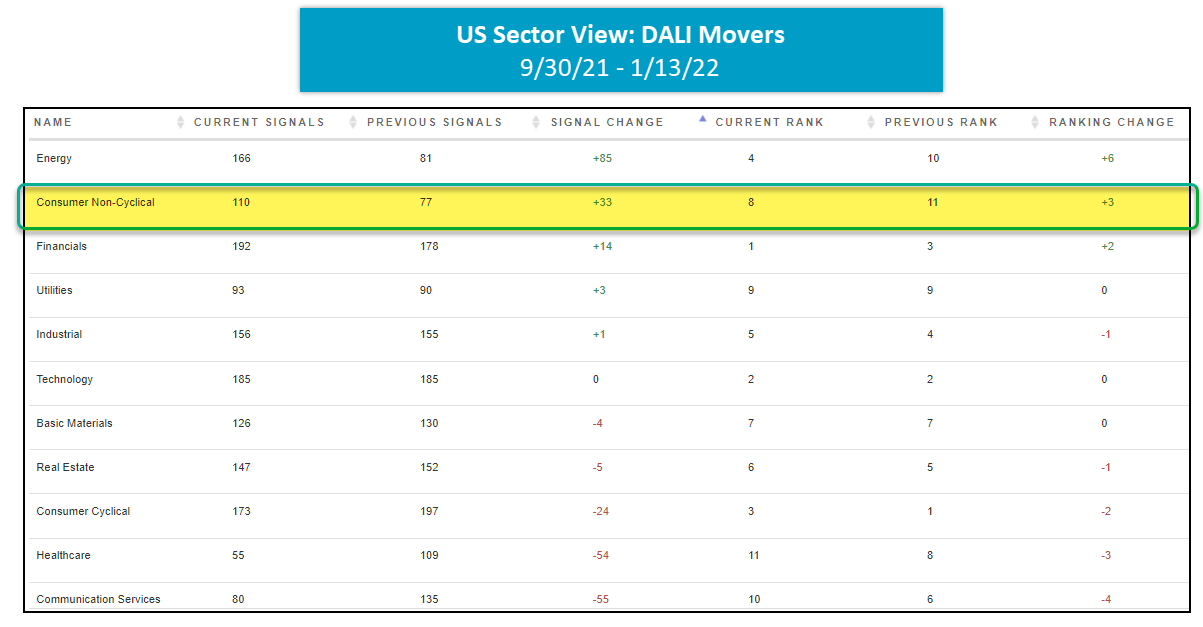
As a result of recent market volatility, we have continued to see more defensive sectors like utilities and consumer non-cyclical pick up near-term relative strength. Although the consumer non-cyclical (consumer staples) sector still resides in the bottom half of the DALI rankings at #8, the sector has gained 33 signals since 9/30, trailing only energy which has gained 85. Additionally, on the Asset Class Group Scores page, consumer non-cyclical is one of the most improved groups in terms of score over the past 30 days, up 0.28 points. As a result, the group has an average group score of 3.48, placing it well into the green zone. We’ve also seen absolute outperformance from the broader staples sector as the Consumer Staples Select Sector SPDR Fund XLP has outperformed the S&P 500 Index SPX over the last 30-, 60-, and 90-day periods by 1.69%, 6.07%, and 4.39%, respectively. Despite being down 29bps on a year-to-date basis, the XLP has continued to outperform the broader market by 1.96% over the first two weeks of 2022. When compared to the other broad sector proxies in the SPDR sector lineup, XLP is the second-best performing sector behind energy XLE over the last 60- and 90-day periods, up 5.56% and 8.59%.
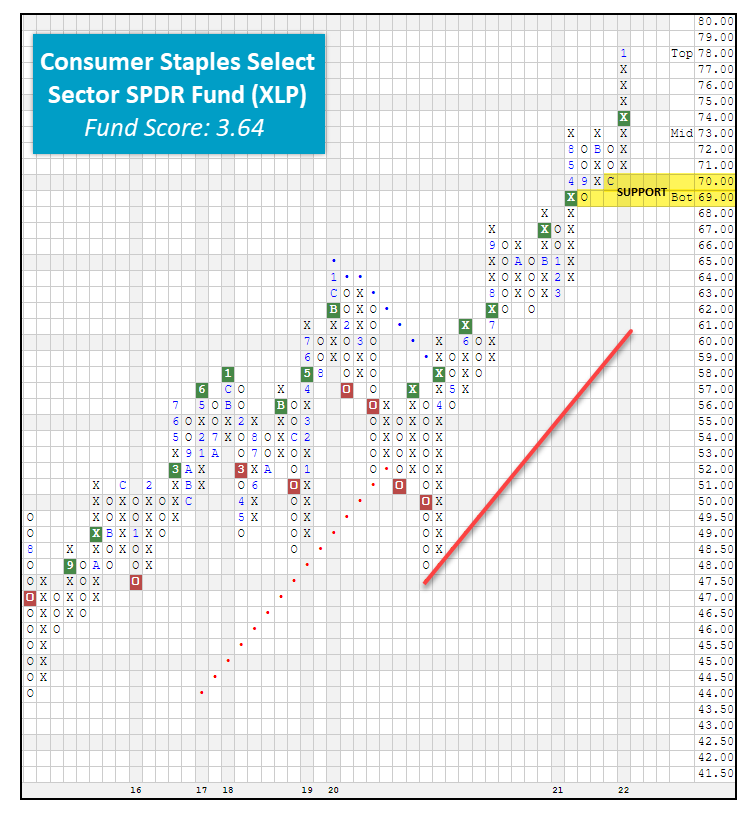
On its trend chart, the XLP continues to trade at all-time highs first printed back on January 5, 2022, at the $78 level. Since returning to a Point & Figure buy signal in April 2020 following the COVID-19 sell-off, XLP has given a total of six consecutive buy signals, confirming that demand has the upper hand. The most recent buy signal occurred on December 10, 2021, when XLP managed to move through significant overhead resistance, breaking a triple top at $74. In addition to its orderly trend chart, the XLP has a solid NDW fund score of 3.64 with a strongly positive score direction of 1.33, speaking to the fund’s improvement within the last six months. This recent score posting is the highest recorded for the XLP since the November 2020 timeframe. Currently, the XLP is 64% overbought based on its 10-week trading band and has cooled off over the last few weeks after printing a relatively high OBOS% reading of 85%, making the ETF actionable here if looking to initiate new long exposure.
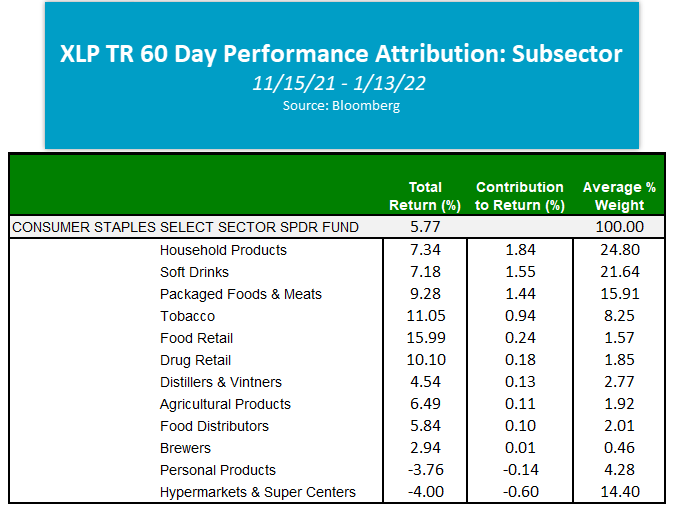
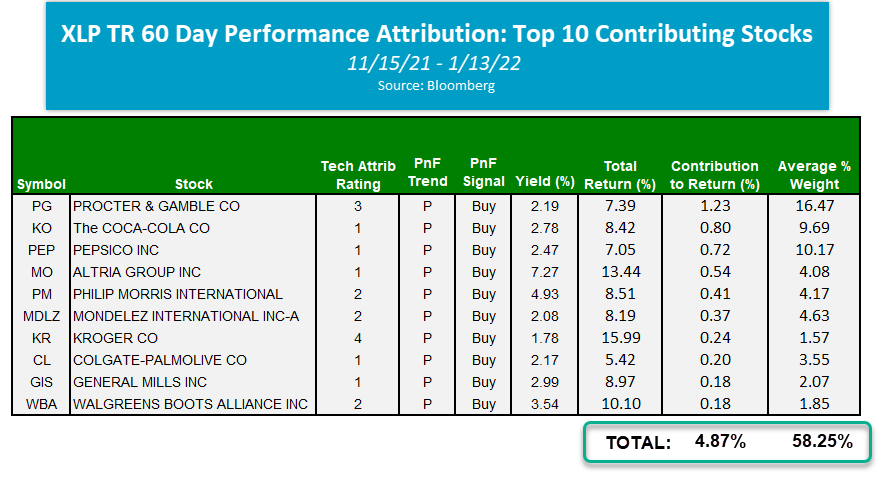
Below is a snapshot of XLP’s performance attribution over the last 60 days, providing us with an in-depth look at the top contributing subsectors and stocks. Since November 15th, household products have contributed the most to XLP’s total return, adding 1.84% on a total-return basis, while soft drinks added 1.55%. On average, household products accounted for most of the exposure within XLP over the last 60 days at about 25%. Personal products and hypermarkets and supercenters were the only two sub-sectors to cause a drag on the portfolio with respective total contributions of -0.14% and -0.60%. On a total-return basis, the food retail subsector has been the top-performer over the last 60 days with a return of 15.99% however, due to its relatively low subsector weighting of 1.57%, this only added 0.24% to the XLP’s performance.
When we take it one step further and break down the performance attribution of the individual stocks that make up the XLP ETF, we find that Procter & Gamble PG has led the way in terms of total contribution to return, adding an impressive 1.23%. As we mentioned above, soft drinks added the second-most to XLP’s total return over the last 60 days, so it comes as no surprise to see the Coca-Cola Company KO and PepsiCo PEP next on the top attributions list, each adding 0.80% and 0.72%, respectively. Notably, the top 10 contributors account for over half of XLP, and out of the 5.77% returned, contributed 4.87%. Currently, all 10 top contributors are trading above their bullish support lines i.e., in overall positive trends and maintain Point & Figure buy signals. At this time, PG and Kroger KR are the only two high attribute names on our list with attribute ratings of 3 or higher. Since relative strength is based on relative performance, many stocks, particularly those that are higher-yielding or lower beta like the names within the staples sector, have a harder time beating the market benchmark on a relative strength basis, especially since relative strength is measured on a price return basis. As a result, some higher-yielding names like KO and PEP are likely to possess lower technical attribute ratings of 2 or lower, which is what we're seeing in the table below. The rule of thumb is that higher-yielding, low attribute names are acceptable as long as they’re also trading in a positive trend and maintain a Point & Figure buy signal.
Because the broader staples sector has shown improvement on a relative and absolute basis, today we are going to use the XLP as the starting universe for a screen that we’ll run using the NDW Security Screener tool. Doing so allows us to easily identify those technically-sound individual consumer staples names that can then be added to a potential shopping list/watch list. To run your own stock screen using the NDW Security Screener tool, type the “XLP” symbol into the blank box on the blue Universe section and add the additional technical criteria detailed below before hitting the green “Preview” button (note: if you run this exact screen after the close on 1/14, you may get a different list). Using the search criteria outlined below, we were able to generate eight stocks. These names are listed in the table below. Underneath the table, we have highlighted two individual stock ideas.
| Symbol | Name | Price | Tech Attrib/Score | DWA Sector | Yield |
|---|---|---|---|---|---|
| ADM | Archer-Daniels-Midland Company | 70.90 |
|
Food Beverages/Soap | 2.10 |
| KR | The Kroger Co. | 49.48 |
|
Retailing | 1.78 |
| LW | Lamb Weston Holdings Inc | 69.04 |
|
Food Beverages/Soap | 1.42 |
| MNST | Monster Beverage Corp. | 94.37 |
|
Food Beverages/Soap | 0.00 |
| PEP | PepsiCo, Inc. | 174.18 |
|
Food Beverages/Soap | 2.47 |
| PG | The Procter & Gamble Company | 158.29 |
|
Food Beverages/Soap | 2.19 |
| SYY | Sysco Corporation | 80.42 |
|
Food Beverages/Soap | 2.40 |
| TSN | Tyson Foods, Inc. | 93.21 |
|
Food Beverages/Soap | 2.03 |
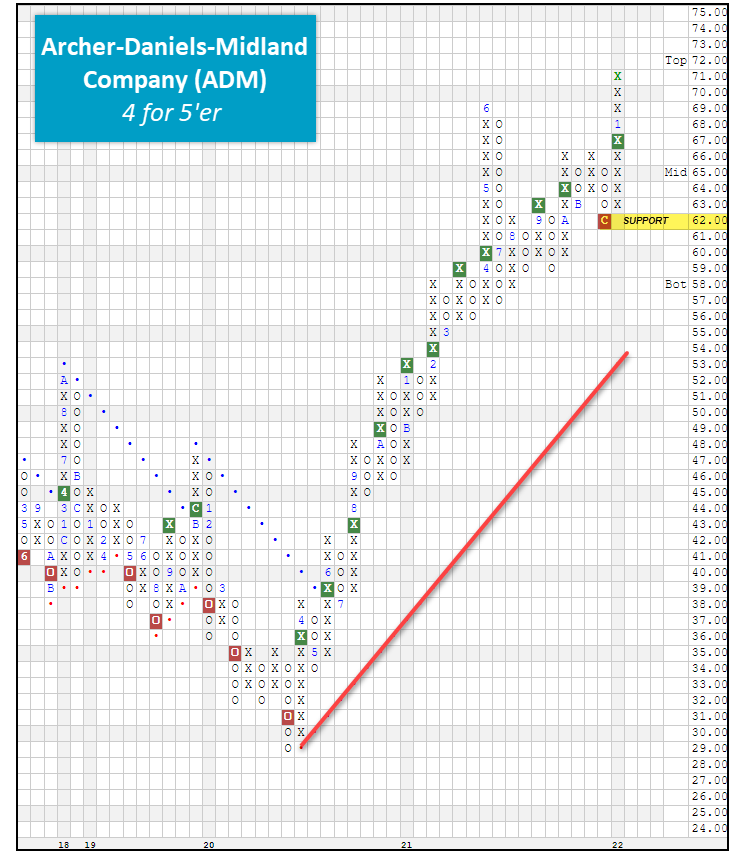
ADM Archer-Daniels-Midland Company ($71.41) - Food Beverages/Soap – ADM is a healthy 4 for 5’er that ranks within the top quartile of the food and beverages/soap sector stock matrix. ADM, which has already managed to post a solid year-to-date gain of 4.90%, trades on a Point & Figure buy signal given in late December with the completion of a shakeout pattern and is sitting at all-time highs as a result of Thursday’s market action. Monthly momentum just flipped positive after having experienced six months of negative monthly momentum while weekly momentum has been positive for three weeks, both adding to the overall positive technical picture. At current levels, ADM is technically overbought with an OBOS% reading of 83% so those looking to initiate new long exposure may want to scale in here or wait for a potential pullback. Initial support sits at $62. ADM yields 2.1% and is set to announce earnings on 1/24/2022.
KR The Kroger Co. ($49.22) - Retailing – Another technically strong name within the broader staples sector is the Kroger Company KR, which was also one of the top 10 contributing names in XLP over the last 60 days. KR ranks in the top decile of the retailing sector stock matrix and has maintained a high attribute rating (3 or higher) since August 2021. Additionally, KR trades well above the bullish support line that has been in place since March 5th, 2020, and trades on four consecutive Point & Figure buy signals. Like ADM, KR hit a new all-time high with yesterday’s market action. As a result, KR has already printed a strong 2022 return of 9.32% just two weeks into the new year, outperforming the S&P 500 Index SPX by a whopping 11.57%. New positions are welcome at current levels. Initial support sits at $44, with additional support available at the $39 level. Note KR yields 1.78%.

In last Friday’s Fund Score Overview, we looked at the improvement in low volatility equities. Low volatility equities offer a unique aspect to portfolio construction due to their vastly different sector exposure compared to a normal benchmark like the S&P 500 Index. Comparing the Invesco S&P 500 Low Volatility ETF (SPLV) to the SPDR S&P 500 ETF Trust (SPY), the technology exposure is the most apparent difference with SPY at 32.79% versus 5.26% for SPLV. The other major differences can be attributed to industrials, utilities, and consumer staples with SPLV having noticeably more exposure to these sectors than SPY.
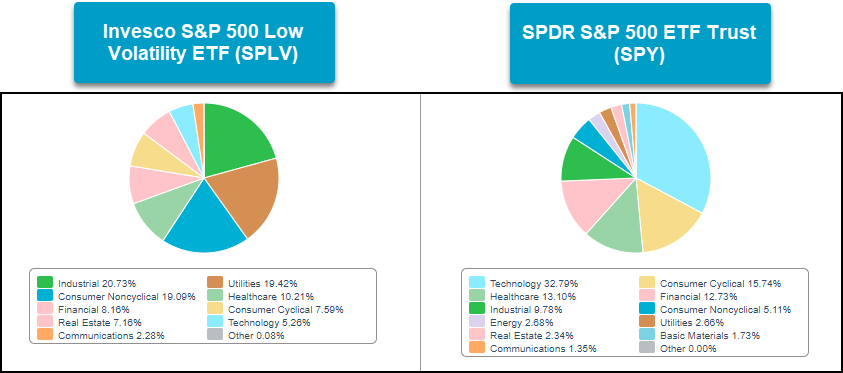
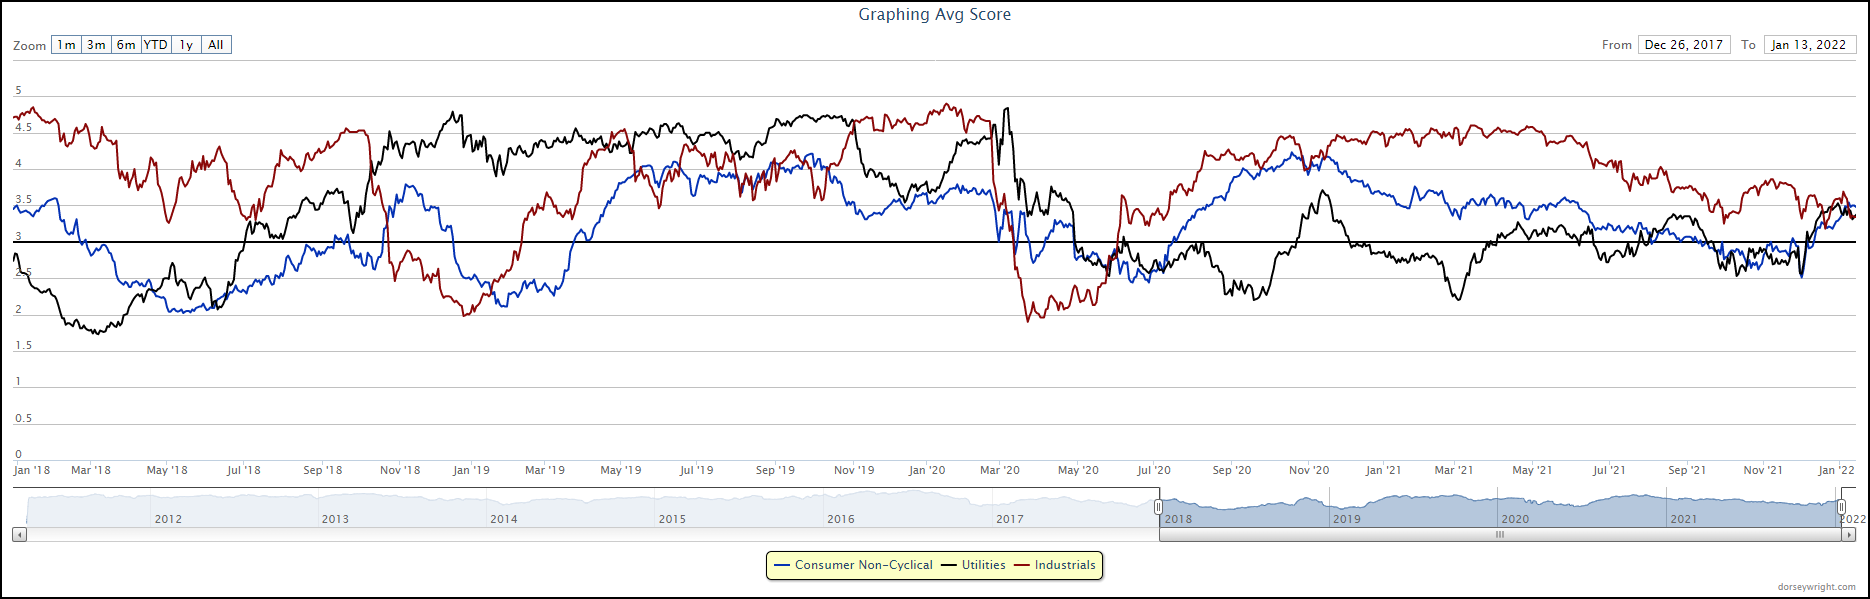
All three of these sectors hold acceptable average scores above 3.0 with staples and utilities possessing some of the best score directions on the entire Asset Class Group Scores page. Consumer staples is the strongest of the three as it has the highest average score and score direction in the group. Utilities have done well over the last few months as well. The Utilities Select Sector SPDR Fund (XLU) has returned 6.40% over the last 90 days compared to the S&P 500 Index’s (SPX) return of 4.20%. On the other hand, the technology group finds itself near the bottom of the sector rankings with an average score of 2.72 and a negative score direction of -1.72.
Both utilities and consumer staples saw a sharp boost in strength at the start of December and their scores have trended higher since. Industrials have been in good standing for most of 2020 and 2021 but its score has stagnated around the 3.50 mark, so not a recent improver like staples and utilities but it is still an acceptable group. The start of 2022 has seen technology weaken while areas like staples and utilities improve, so low volatility equities can be a quality addition to portfolio allocations in times like these.

Average Level
-7.19
| AGG | iShares US Core Bond ETF |
| USO | United States Oil Fund |
| DIA | SPDR Dow Jones Industrial Average ETF |
| DVY | iShares Dow Jones Select Dividend Index ETF |
| DX/Y | NYCE U.S.Dollar Index Spot |
| EFA | iShares MSCI EAFE ETF |
| FXE | Invesco CurrencyShares Euro Trust |
| GLD | SPDR Gold Trust |
| GSG | iShares S&P GSCI Commodity-Indexed Trust |
| HYG | iShares iBoxx $ High Yield Corporate Bond ETF |
| ICF | iShares Cohen & Steers Realty ETF |
| IEF | iShares Barclays 7-10 Yr. Tres. Bond ETF |
| LQD | iShares iBoxx $ Investment Grade Corp. Bond ETF |
| IJH | iShares S&P 400 MidCap Index Fund |
| ONEQ | Fidelity Nasdaq Composite Index Track |
| QQQ | Invesco QQQ Trust |
| RSP | Invesco S&P 500 Equal Weight ETF |
| IWM | iShares Russell 2000 Index ETF |
| SHY | iShares Barclays 1-3 Year Tres. Bond ETF |
| IJR | iShares S&P 600 SmallCap Index Fund |
| SPY | SPDR S&P 500 Index ETF Trust |
| TLT | iShares Barclays 20+ Year Treasury Bond ETF |
| GCC | WisdomTree Continuous Commodity Index Fund |
| VOOG | Vanguard S&P 500 Growth ETF |
| VOOV | Vanguard S&P 500 Value ETF |
| EEM | iShares MSCI Emerging Markets ETF |
| XLG | Invesco S&P 500 Top 50 ETF |
| Symbol | Company | Sector | Current Price | Action Price | Target | Stop | Notes |
|---|---|---|---|---|---|---|---|
| AKR | Acadia Realty Trust | Real Estate | $22.51 | 20 - 22 | 28 | 18 | 4 for 5'er, #6 of 154 in REAL sector matrix, one box from RS buy signal, 2.7% yield, Earnings 2/8 |
| STOR | Store Capital Corp. | Real Estate | $33.85 | mid-to-upper 30s | 47.50 | 30 | 5 for 5'er, multiple buy signals, one box from 52-week high, 4.1% yield, R-R>2.0 |
| FOE | Ferro Corp | Chemicals | $21.66 | high teens to low 20s | 35 | 16 | 4 for 5'er, 8 consec buy signals, pullback from recent high, pos trend, top of DWACHEM matrix |
| SC | Santander Consumer USA Holdings Inc. | Finance | $41.65 | high 30s to mid 40s | 57 | 34 | 5 for 5'er, top 10% of DWAFINA, 3 consec buy signals, all-time highs, 2.11% yield, Earnings 2/1 |
| ESI | Element Solutions Inc. | Chemicals | $24.60 | mid to upper 20s | 37 | 20 | 5 for 5'er, multi-year high, 6 consec buy signals, top of DWACHEM |
| BAM | Brookfield Asset Management | Finance | $58.31 | mid to hi 50s | 70 | 47 | 5 for 5'er, top 20% of FINA sector matrix, LT pos mkt RS, multiple consecutive buy signals Earnings 2/10 |
| SMCI | Super Micro Computer, Inc. | Computers | $45.29 | low 40s | 52 | 34 | 4 for 5'er, top 20% of COMP sector matrix, multiple buy signals, pullback from ATH Earnings 1/31 |
| UMC | United Microlectronics Corporation (Taiwan) ADR | Semiconductors | $11.40 | 11.50 - 12.50 | 19 | 10 | 4 for 5'er, top half of favored SEMI sector matrix, bullish catapult, 2.4% yield, R-R>3.0, pot. cov. write |
| SMPL | Simply Good Foods Co | Retailing | $38.50 | mid-to-upper $30s | 56 | 31 | 4 for 5'er top half of RETA sector matrix, bullish catapult, pullback from ATH |
| BRO | Brown & Brown, Inc. | Insurance | $68.58 | low to upper 60s | 77 | 55 | 5 for 5'er, pos trend since 2010, longterm market RS buy signal, one box from 4th consec buy signal Earnings 1/24 |
| SEE | Sealed Air Corporation | Business Products | $67.77 | low-to-mid 60s | 89 | 53 | 5 for 5'er, top 20% of BUSI sector matrix, multiple consec buy signals Earnings 2/7 |
| SWCH | Switch, Inc. Class A | Internet | $26.05 | 25 - 28 | 54.50 | 22 | 4 for 5'er #6 of 51 in INET sector matrix, spread triple top, R-R>5.0 |
| IR | Ingersoll-Rand Inc. | Machinery and Tools | $59.52 | mid 50s to low 60s | 74 | 49 | 5 for 5'er, pullback from ATH, 3 consecutive buy signals, pos monthly momentum |
| LYV | Live Nation Entertainment Inc. | Leisure | $113.87 | low 120s to mid 130s | 142 | 98 | 5 for 5'er, pullback from ATH, long-term market RS buy signal, 2 consecutive buy signals, pos month and weekly momentum |
| EQH | Equitable Holdings Inc | Insurance | $35.70 | mid to upper 30s | 47.5 | 27 | 4 for 5'er, pullback from ATH, 3 consec buy signals, pos weekly momentum flip, 2.2% yield |
| STE | STERIS PLC | Healthcare | $234.85 | hi 220s - low 240s | 316 | 200 | 4 for 5'er, top 25% of HEAL sector matrix, LT pos mkt RS, triple top breakout, Earn. 1/31 |
| LAMR | Lamar Advertising Company | Media | $115.04 | low 100s - low 120s | 158 | 97 | 5 for 5'er, top 25% of MEDI sector matrix, pullback from ATH, 3.4% yield. |
| TROX | Tronox Incorporated | Chemicals | $25.28 | mid 20s | 43.50 | 20 | 5 for 5'er, top 1/3 DWACHEM matrix, 3 weeks pos weekly mom, pullback from rally high, 1.65% yield |
| ON | On Semiconductor Corp. | Semiconductors | $64.64 | mid-to-high 60s | 94 | 56 | 5 for 5'er, #3 of 61 in SEMI sector matrix, breakout to new ATH, R-R>2.0, Earn. 1/31 |
| NSA | National Storage Affiliates | Real Estate | $64.71 | low 60s to low 70s | 91 | 51 | 5 for 5'er, top 10% DWAREAL matrix, pullback from ATH, 7 consec buy signals, 2.74% yield |
| SKT | Tanger Factory Outlet Centers | Real Estate | $19.65 | 19 - 21 | 34.50 | 15.50 | 5 for 5'er, top third of REAL sector matrix, |
| Symbol | Company | Sector | Current Price | Action Price | Target | Stop | Notes |
|---|
| Symbol | Company | Sector | Current Price | Action Price | Target | Stop | Notes |
|---|---|---|---|---|---|---|---|
| HD | Home Depot, Inc. | Building | $386.98 | high 380s to 410s | 540 | 316 | HD fell to a sell signal on Friday. OK to hold here. Raise stop to $324, the next potential sell signal on HD's default chart. |
| Comment | |||||||
|---|---|---|---|---|---|---|---|
|
|
|||||||
SKT Tanger Factory Outlet Centers R ($19.43) - Real Estate - SKT is a 5 for 5'er that ranks in the top third of the real estate sector matrix. After giving multiple consecutive buy signals SKT completed a bearish signal reversal in November and continued higher breaking a spread triple top at $21, taking out resistance that had been in place since June. The stock pulled back in December before reversing up earlier this month and currently sits near the middle of its trading band. Long exposure may be added in the $19 - $21 range and we will set our initial stop at $15.50, which would take out two levels of support on SKT's default chart. We will use the bullish price objective, $34.50, as our target price, giving us a reward-to-risk ratio north of 3.0. SKT also carries a 3.75% yield.
| 21 | 22 | ||||||||||||||||||||||||||||||||||||||||||||||||||||
| 22.00 | • | X | X | 22.00 | |||||||||||||||||||||||||||||||||||||||||||||||||
| 21.00 | • | X | O | • | X | O | 21.00 | ||||||||||||||||||||||||||||||||||||||||||||||
| 20.00 | • | X | X | O | X | X | • | • | • | X | O | 1 | Mid | 20.00 | |||||||||||||||||||||||||||||||||||||||
| 19.50 | • | X | O | X | O | X | O | X | O | 7 | • | X | • | X | O | X | 19.50 | ||||||||||||||||||||||||||||||||||||
| 19.00 | • | X | O | X | O | X | O | X | O | X | O | X | O | • | X | C | X | 19.00 | |||||||||||||||||||||||||||||||||||
| 18.50 | • | X | O | X | O | X | 6 | O | O | X | O | X | O | X | • | • | B | O | X | 18.50 | |||||||||||||||||||||||||||||||||
| 18.00 | • | X | O | X | O | X | X | O | X | O | O | • | O | X | O | X | • | A | O | 18.00 | |||||||||||||||||||||||||||||||||
| 17.50 | • | X | O | X | O | X | O | X | X | O | X | • | • | O | X | O | X | O | 9 | 17.50 | |||||||||||||||||||||||||||||||||
| 17.00 | • | X | O | X | X | 3 | O | X | X | O | X | X | O | X | 5 | X | • | O | 8 | X | O | X | • | 17.00 | |||||||||||||||||||||||||||||
| 16.50 | X | • | X | O | X | O | X | O | X | O | X | O | X | O | X | O | 4 | O | X | O | X | • | O | O | X | • | 16.50 | ||||||||||||||||||||||||||
| 16.00 | X | O | • | X | O | X | O | X | O | X | O | X | O | X | O | X | O | X | O | O | X | • | O | • | 16.00 | ||||||||||||||||||||||||||||
| 15.50 | X | O | X | O | X | 2 | X | O | O | O | O | O | X | O | • | • | 15.50 | ||||||||||||||||||||||||||||||||||||
| 15.00 | X | O | X | O | X | O | X | O | • | Bot | 15.00 | ||||||||||||||||||||||||||||||||||||||||||
| 14.50 | X | O | X | O | O | X | • | 14.50 | |||||||||||||||||||||||||||||||||||||||||||||
| 14.00 | 2 | X | O | X | • | 14.00 | |||||||||||||||||||||||||||||||||||||||||||||||
| 13.50 | O | X | X | O | X | • | 13.50 | ||||||||||||||||||||||||||||||||||||||||||||||
| 13.00 | O | X | O | X | O | X | • | 13.00 | |||||||||||||||||||||||||||||||||||||||||||||
| 12.50 | O | X | O | X | O | • | 12.50 | ||||||||||||||||||||||||||||||||||||||||||||||
| 12.00 | O | X | O | • | 12.00 | ||||||||||||||||||||||||||||||||||||||||||||||||
| 11.50 | O | 1 | • | 11.50 | |||||||||||||||||||||||||||||||||||||||||||||||||
| 11.00 | 3 | X | • | 11.00 | |||||||||||||||||||||||||||||||||||||||||||||||||
| 10.50 | O | C | • | 10.50 | |||||||||||||||||||||||||||||||||||||||||||||||||
| 10.00 | O | X | X | • | 10.00 | ||||||||||||||||||||||||||||||||||||||||||||||||
| 9.50 | O | X | O | X | • | 9.50 | |||||||||||||||||||||||||||||||||||||||||||||||
| 9.00 | O | X | O | X | • | 9.00 | |||||||||||||||||||||||||||||||||||||||||||||||
| 8.50 | O | X | O | X | X | • | 8.50 | ||||||||||||||||||||||||||||||||||||||||||||||
| 8.00 | O | X | X | X | O | X | O | X | • | 8.00 | |||||||||||||||||||||||||||||||||||||||||||
| 7.50 | O | X | O | X | X | O | X | 6 | O | X | O | B | • | 7.50 | |||||||||||||||||||||||||||||||||||||||
| 7.00 | O | X | O | X | O | X | O | X | O | X | O | O | A | • | 7.00 | ||||||||||||||||||||||||||||||||||||||
| 6.50 | O | X | O | X | O | X | O | X | O | X | O | X | • | 6.50 | |||||||||||||||||||||||||||||||||||||||
| 6.00 | O | O | O | X | O | X | 5 | X | 8 | X | • | 6.00 | |||||||||||||||||||||||||||||||||||||||||
| 5.50 | O | X | O | X | O | 9 | • | 5.50 | |||||||||||||||||||||||||||||||||||||||||||||
| 5.00 | O | X | X | O | • | 5.00 | |||||||||||||||||||||||||||||||||||||||||||||||
| 4.75 | 4 | X | O | X | 4.75 | ||||||||||||||||||||||||||||||||||||||||||||||||
| 4.50 | O | X | O | X | 4.50 | ||||||||||||||||||||||||||||||||||||||||||||||||
| 4.25 | O | O | 4.25 | ||||||||||||||||||||||||||||||||||||||||||||||||||
| 21 | 22 |

| ACN Accenture PLC ($353.36) - Business Products - ACN broke a double bottom at $360 for a second consecutive sell signal before falling down to $352 and taking out support at $356. The stock still remains a 5 for 5'er, but short-term holders may seek to trim on this breakdown and violation of support. Long-term holders should note support on the default chart now lies at $320. |
| AMC AMC Entertainment Holdings Inc. ($20.57) - Leisure - AMC broke a spread triple bottom today at $20, marking the stock’s third consecutive sell signal. AMC is an unacceptable 0 for 5’er that ranks dead last in the leisure sector stock matrix. Supply is in control and the weight of the evidence is bearish. Avoid. |
| BE Bloom Energy Corporation Class A ($18.12) - Utilities/Electricity - BE broke a double bottom at $18 today, marking the second consecutive sell signal on the chart. This also violated the bullish support line. As a result, BE is now trading in a negative trend with 2 attributes in its favor. Supply is in control and there are stronger names within this space. Earnings are slated for 2/8. |
| BURL Burlington Stores, Inc. ($229.12) - Retailing - BURL broke a spread triple bottom at 232 before moving lower to 224, marking a new 52 week low on the chart. BURL trades on three consecutive sell signals with just 1 attribute in its favor. Weekly momentum has been negative for two weeks, suggesting the potential for lower prices. Avoid. |
| CF CF Industries Holdings, Inc. ($66.44) - Chemicals - CF industries gave a second consecutive sell signal on Friday when it broke a double bottom at $65. While the overall technical picture remains positive - CF is a 4 for 5'er and ranks first out of 51 names in the chemical sector matrix. Those with open exposure may wish to monitor the stock closely for signs of further deterioration. |
| CWH Camping World Holdings Inc ($37.15) - Retailing - CWH is a 2 for 5’er that broke a double bottom at $36 today. This marks the stock’s third consecutive sell signal. CWI trades below the bearish resistance line and maintains a market RS sell signal. Avoid. |
| ECL Ecolab Inc. ($215.49) - Chemicals - ECL fell to a sell signal and violated its trend its line in Friday's trading, a move which will drop it to a 0 for 5'er. ECL also ranks in the bottom third of the chemicals sector matrix. Long exposure should be avoided. |
| EL Estee Lauder Companies ($322.35) - Retailing - Shares of EL broke a double bottom at $328 on Friday and simultaneously violated their positive trend line in place since May of 2020. The stock will fall to a 3 for 5'er. No new exposure at this point yet those with existing long exposure may continue to hold. The next level of support is offered at around $300. Note earnings are expected on February 3rd. |
| GS Goldman Sachs Group, Inc. ($378.04) - Wall Street - GS shares moved lower today to break a double bottom at $384 to mark its first sell signal. This 3 for 5'er has been in a positive trend since November but on an RS sell signal versus the market since June of 2016. GS is trading near the middle of the trading band with a weekly overbought/oversold reading of -9%. From here, support is offered at $368. |
| IDXX IDEXX Laboratories, Inc. ($527.99) - Healthcare - IDXX shares moved lower today to break a double bottom at $520 to mark its second consecutive sell signal. This 3 for 5'er entered a negative trend today and has been in a column of Os on its market RS chart since January. IDXX is heavily oversold at current levels with a weekly overbought/oversold reading of -73%. From here, support is offered at $512. |
| IRDM Iridium Communications, Inc. ($37.51) - Telephone - IRDM broke a double bottom at 37 on Friday and is now testing support from October. IRDM, a weak 2 for 5’er, trades on three consecutive sell signals below the bearish resistance line. Weekly momentum just flipped negative, suggesting the potential for lower prices. Supply is in control. Avoid. |
| MSCI MSCI Inc. ($526.98) - Finance - MSCI broke a double bottom at $528 for a fifth consecutive sell signal before falling down to $520 and violating the bullish support line. The stock will now become a 2 for 5'er in attribute rating. Holders may seek to trim or step away here depending on cost basis. Support on the default chart now lies at $448 and $408. |
| ONTO Onto Innovation Inc. ($104.28) - Semiconductors - ONTO rallied Friday to break a double top at $102 before climbing over 9% intraday to match its all-time high at $104. This move puts the stock back in a positive trend and promotes it to a 5 for 5 TA rating. The weight of the evidence is positive and improving. Exposure may be considered on this breakout, however, potential investors may proceed with caution as initial support is not offered until $89. Further support is seen at $88 and $86. Earnings are expected on 2/2. |
| OSTK Overstock.Com, Inc. ($49.01) - Internet - OSTK broke a double bottom at 51 before moving lower to 48. This marks the sixth consecutive sell signal on the chart. OSTK is an unacceptable 0 for 5’er that should be avoided at this time. |
| PENN Penn National Gaming Inc ($44.32) - Gaming - PENN broke a double bottom at $44 and is now up against support from December. PENN is a 0 for 5’er that expects earnings on 2/2/22. Avoid. |
| PYPL Paypal Holdings Inc ($177.32) - Software - PYPL fell Friday to break a double bottom at $176, marking a third consecutive sell signal. This 1 for 5'er moved to a negative trend in October and ranks in the lower quintile of the unfavored software sector RS matrix. The weight of the technical evidence is negative here and weakening. Long exposure should be avoided. Initial overhead resistance may be seen at $192. Earnings are expected on 2/1. |
| RPM RPM, Inc. ($91.82) - Chemicals - RPM gave a second consecutive sell signal Friday when it broke a spread triple bottom at $90, negating a potential shakeout pattern. While RPM remains a 3 for 5'er, those with open positions should monitor the stock closely as it has violated multiple levels of support. RPM's bullish support line sits at $85, beyond which the nearest level of support is $79. |
| TMO Thermo Fisher Scientific Inc. ($592.02) - Healthcare - TMO shares moved lower today to break a double bottom at $592 to mark its second consecutive sell signal. This 5 for 5'er has been in a positive trend since April of 2020 and on an RS buy signal versus the market since February of 2014. TMO is trading in oversold territory with a weekly overbought/oversold reading of -46%. From here, support is offered at $560. |
| TREX Trex Company, Inc. ($107.10) - Building - TREX broke a double bottom at $110 for a third consecutive sell signal before falling down to $106 and violating the bullish support line. The stock will now become a 2 for 5'er in attribute rating. Holders may seek to trim or step away depending on cost basis. Support now lies at $94 and $91. |
| TTD The Trade Desk Inc ($74.56) - Internet - TTD fell Friday to break a double bottom at $73. This 2 for 5'er moved to a negative trend earlier this month and has seen declining relative strength against the market. The weight of the technical evidence is negative and deteriorating. Long exposure should be avoided. Further support may be seen at $69 with initial overhead resistance potentially found at $87. |
| WMS Advanced Drainage Systems Inc. ($118.75) - Machinery and Tools - WMS broke a spread quadruple bottom at $120 on Friday, returning the stock to a sell signal. WMS remains a 5 for 5'er yet with Friday's break there is no material support offered until around $106. No new exposure here. Demand would reenter the picture with a breakout at $130. Note earnings are expected on February 2nd. |
| Name | Option Symbol | Action | Stop Loss |
|---|---|---|---|
| Pfizer Inc. - $54.95 | O: 22E50.00D20 | Buy the May 50.00 calls at 6.65 | 50.00 |
| Name | Option | Action |
|---|---|---|
| The Charles Schwab Corporation ( SCHW) | Feb. 82.50 Calls | Raise the option stop loss to 11.00 (CP: 13.00) |
| The Sherwin-Williams Company ( SHW) | Mar. 340.00 Calls | Stopped at 310.00 (CP: 309.16) |
| Iron Mountain Inc. ( IRM) | Mar. 50.00 Calls | Stopped at 45.00 (CP: 44.82) |
| Home Depot, Inc. ( HD) | May. 385.00 Calls | Stopped at 376.00 (CP: 371.79) |
| Name | Option Symbol | Action | Stop Loss |
|---|---|---|---|
| Agnico-Eagle Mines Ltd. - $51.41 | O: 22Q55.00D20 | Buy the May 55.00 puts at 6.60 | 54.00 |
| Name | Option | Action |
|---|---|---|
| Ollies Bargain Outlet Holding Inc. (OLLI) | Mar. 50.00 Puts | Raise the option stop loss to 4.50 (CP: 6.50) |
| Paypal Holdings Inc (PYPL) | May. 190.00 Puts | Raise the option stop loss to 20.30 (CP: 22.30) |
| Name | Option Sym. | Call to Sell | Call Price | Investment for 500 Shares | Annual Called Rtn. | Annual Static Rtn. | Downside Protection |
|---|---|---|---|---|---|---|---|
| Tenaris S.A. (Italy) ADR $22.69 | O: 22F25.00D17 | Jun. 25.00 | 1.40 | $11,331.05 | 21.96% | 12.01% | 4.82% |
| Name | Action |
|---|---|
| EQT Corporation (EQT) - 23.51 | Sell the March 23.00 Calls. |
| Extreme Networks, Inc. (EXTR) - 14.31 | Sell the March 15.00 Calls. |
| Advanced Micro Devices, Inc. (AMD) - 132.74 | Sell the March 145.00 Calls. |
| Alcoa Inc. (AA) - 60.51 | Sell the March 65.00 Calls. |
| Macy's Inc. (M) - 26.84 | Sell the May 28.00 Calls. |
| Builders FirstSource, Inc. (BLDR) - 80.58 | Sell the May 85.00 Calls. |
| On Semiconductor Corp. (ON) - 64.64 | Sell the February 65.00 Calls. |
| Continental Resources Inc. (CLR) - 50.38 | Sell the June 55.00 Calls. |
| Suncor Inc (SU) - 27.87 | Sell the June 29.00 Calls. |
| Commercial Metals Corporation (CMC) - 37.85 | Sell the June 40.00 Calls. |
| Name | Covered Write |
|---|---|
| SeaWorld Entertainment, Inc. ( SEAS - 65.72 ) | March 70.00 covered write. |
| Micron Technology, Inc. ( MU - 95.62 ) | May 95.00 covered write. |
Daily Equity & Market Analysis
Loading, Please Wait...
