Historical statistics on 5% pullbacks in the Nasdaq 100 Index.
Selling pressure on the Nasdaq 100 Index NDX has continued over the past week, with the index closing at 15495.62 Thursday (1/13) to mark a drawdown of -6.47% from its closing price on December 27, 2021. The current pullback hit a 5% drawdown on January 7, which was just 35 calendar days after the prior pullback and marks the third 5% drawdown for the index over the past four months.
The Nasdaq 100 Index is not a stranger to sharp movement, as it carries fewer names and a higher concentration toward growth securities when compared to other indices. This can lead to sharper upside appreciation during periods when growth stocks are in favor, but can also produce swift declines when these areas underperform. It is important for any investor to understand the history behind sharp declines for the NDX to provide perspective on what may be expected in the future.
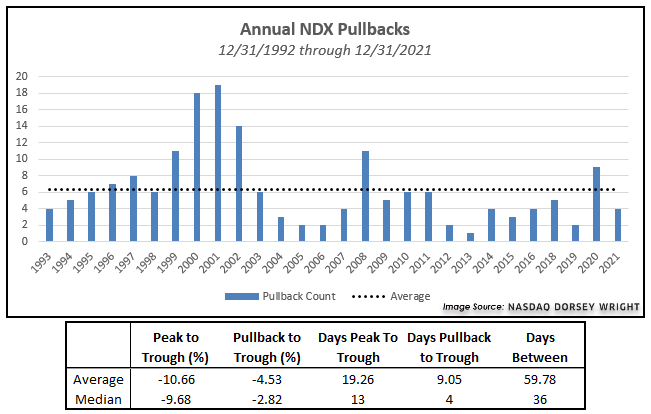
We have run some statistical testing on historical data for the Nasdaq 100 from December 31, 1992, through December 31, 2021, to help better understand the nature of prior 5% pullbacks. In order to qualify as a unique instance, the NDX must see the corresponding percentage drawdown from a relative closing high and the same percentage increase from that closing low.
There have been a total of 177 pullbacks for NDX since the end of 1992 (not including the current drawdown). The average peak to trough drawdown for those instances sits at -10.66% with a median of -9.68%. It took the Nasdaq 100 Index just over 19 days on average from each peak to reach the trough. Less than half of the pullbacks ultimately led to a 10% correction, with the average decline from the date of each pullback to each trough sitting at -4.53%. The index averaged just under 60 days between each 5% pullback, which would lead to six such events each year.