Most Requested Symbols

The average distribution reading is -8.70% oversold.
Today's featured stock is Costco Wholesale Corporation (COST)
ADSK, CB, CVNA, DDD, DLTR, FTCH, LLY, PXD, SPWR and TREX
Call: Edwards Lifesciences (EW); Put: Crocs (CROX); Covered Write: Builders FirstSource (BLDR)
NDW Morning Update Video - January 7, 2022
NDW Morning Update Video
Click here to download MP3
Beginners Series Webinar: Join us on Friday, January 7th, at 2 PM (ET) for our first NDW Beginners Series Webinar of the new year. This week's topic is Creating Custom Models: Static Allocation & Model of Models. Register Here
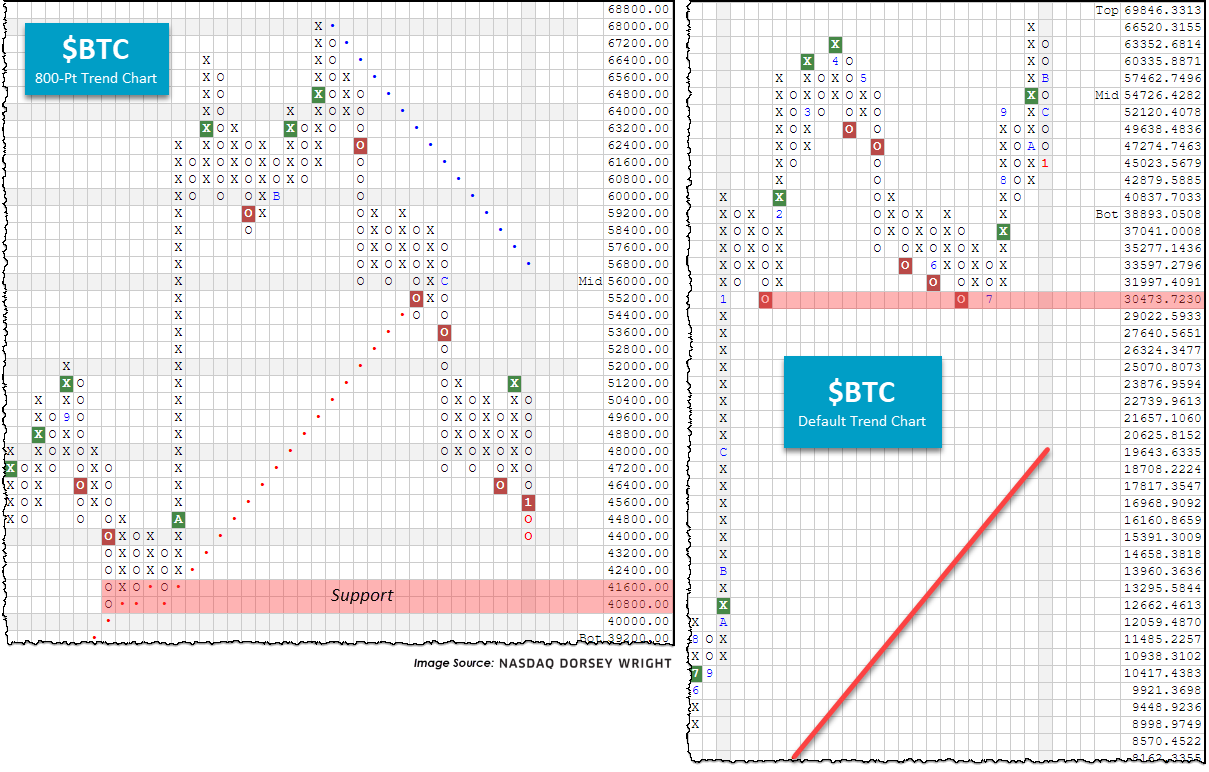
Like equity and fixed income markets, the major cryptocurrencies are off to a shaky start in 2022, especially Bitcoin ($BTC). In the first several trading days $BTC is off 4.16% (through 1/5), tacking on to its poor trailing 30-day loss which is north of 10%. The underlying reasons for the sharp pullback remain largely unclear, but after a year in which BTC rallied nearly 60% perhaps some investors are realizing their gains in the new year. The mining crackdown in China, one of the most concentrated geographic regions for crypto transactions according to an MIT study, could also be catalyzing the exhale. Regardless of the rationale, we are seeing demand weaken for Bitcoin, pulling the crypto down towards a key level of support.
Looking to the 800-point chart (left-hand side), we spot key support offered near the 40,000 range – this is also confirmed on the longer-term default chart. Beyond 40,000 we would look towards 30,000, which appears to be a firmer level of support due to buyers repeatedly stepping in here on past drawdowns.
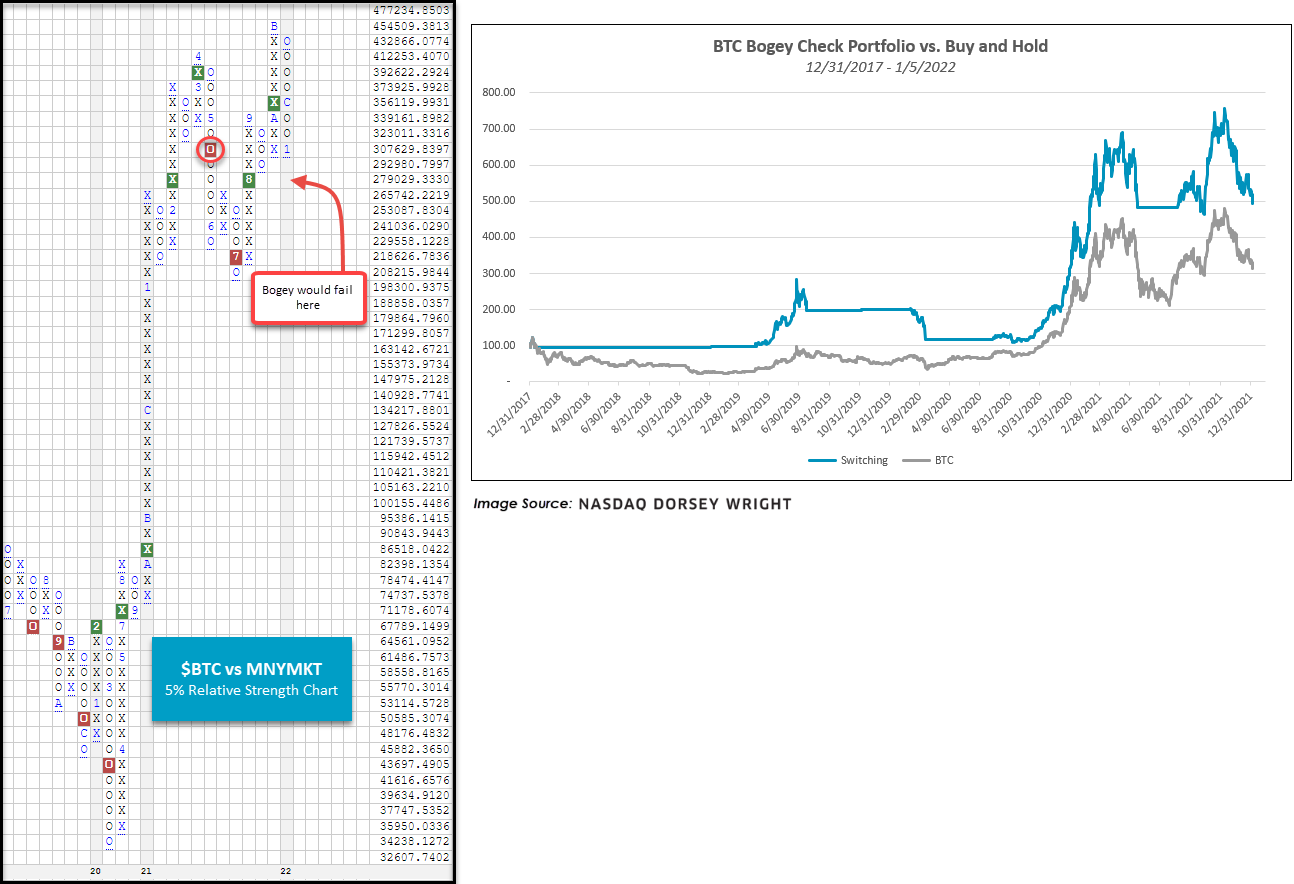
To some surprise, the volatility of Bitcoin is generally trending lower – likely due to the increase in market efficiency and the introduction of more digital assets. However, the moves are still relatively extreme, and tactical decisions to raise cash during past downturns have proved advantageous. We featured a “Bitcoin Bogey Check” in our Alternative Assets Update last August which used a 5% relative strength relationship between $BTC and MNYMKT to determine when to exit the market. If $BTC is on a relative strength buy signal versus MNYMKT, the bogey check passes, but if $BTC is on a relative strength sell signal versus MNYMKT, the bogey check fails.
In practice, this essentially cut losing trades short and let the winning trades run. The strategy was not correct on each signal given nor did we exit at tops or buy during bottoms, but the method did provide a framework to keep us out of a situation where we needed a 100% return after suffering a 50% loss to breakeven. As with other technical indicators, disciplines, and models, it is not about trying to time when to use them but spending extended time in the strategies.
The reason we bring this up today is that the previously explained Bitcoin Bogey is nearly failing. A further push lower for $BTC to 41,128 or lower would lead to an RS sell signal on the 5% RS chart against MNYMKT, indicating a risk-off posture.

Quarter endings and beginnings are typically a good time to provide a touchpoint with your clients and prospects, so in recognition of the change of calendar, we wanted to give you a sample newsletter to aid you with this communication. You want to let your clients know that you are holding the reigns of their portfolios and that you are holding on tight. This letter has not been FINRA approved.
Note to Wells Fargo Advisors: A version of this letter has been submitted to Wells Fargo compliance for CAR approval. Once it is approved, we will put the CAR # in the "Were You Aware?" section of the Daily Equity Report.
Sample Client Newsletter: Q4 2021
PRINT ON FIRM APPROVED LETTERHEAD
INSERT DATE
The fourth quarter and 2021 are now officially in the books. After a rocky end to the third quarter, US equities quickly rebounded in October. Aided by generally strong earnings reports, the S&P 500 and Nasdaq each gained around 7% for the month, with the Dow posting a gain of nearly 6%.
US equities’ strength carried through into November with the S&P 500 reaching new all-time highs. However, the emergence of the omicron COVID-19 variant and concerns about the efficacy of existing vaccines sent stock prices and bond yields tumbling post-Thanksgiving.
While the emergence of the omicron variant pushed stocks lower, it took a larger toll on oil prices, which declined more than 10% the day after Thanksgiving, the largest one-day decline since April 2020, leading to a loss of more than 20% for the month.
In remarks the following week, Fed Chair Powell struck a more hawkish tone further unnerving equity investors. Powell said that it was no longer appropriate to call inflation “transitory” and, citing the strength of the US economy, said that a faster tapering of asset purchases was under consideration, The S&P 500 finished the month down slightly, posting a loss of -0.83%. Small-cap stocks were hit harder as the Russell 2000 lost nearly 4.3%.
Fears about the omicron COVID-19 variant subsided as data indicated that, while more infectious, the illness caused by omicron was less severe than other variants, and the S&P 500 ended December with a gain of more than 4% for the month.
Crude oil also rebounded as worries about omicron eased, gaining nearly 14% in December to finish 2021 up more than 55%, its best year since 2009.
The S&P 500 ended 2021 with a gain of just under 27%, its second-best annual return since 2013. Meanwhile, the Nasdaq and the Dow gained around 21% and 19%, respectively. This marked just the sixth year in which the S&P 500 outperformed both of the other major US benchmarks.
While 2021 was undoubtedly a positive year for US equities, rising interest rates were a headwind for bonds. The Bloomberg Barclays US Aggregate Bond Index was down about 1.7% in 2021, its worst year since 2013.
As we begin 2022, we continue to monitor closely for any shifts in the market landscape. Domestic equities and commodities remain first and second, respectively, in the relative strength asset class rankings of our Dynamic Level Investing (DALI) tool. DALI provides us with a heat map of where relative strength (and weakness) resides across and within asset classes. From a sector perspective, relative strength resides with technology and financials; the technology sector regained the top spot in the DALI sector rankings late in the year, finishing 2021 in the same position in which it began.
If you have any questions about your portfolio or you would like to become more familiar with my investment process and the tools I use to identify market leadership across and within asset classes, please don’t hesitate to contact me.
NAME, TITLE
P.S. If you think this type of information would be beneficial to anyone you know, please share this communication with them.
Please be aware that the content of this newsletter is based on the opinion of Dorsey, Wright research and may differ from the research provided by your financial advisor. This market theme letter was written by Dorsey, Wright & Associates and is provided courtesy of your advisor.
The performance numbers in this article do not reflect transaction costs. Indexes are not available for direct investment. Past performance is not indicative of future results and there is no assurance that any forecasts mentioned in this report will be attained.
Stocks offer growth potential but are subject to market fluctuations. Dividends are not guaranteed; companies can reduce or eliminate their dividend at any time. There are special risks associated with an investment in real estate, including credit risk, interest rate fluctuations and the impact of varied economic conditions.
The information contained herein has been prepared without regard to any particular investor’s investment objectives, financial situation, and needs. Accordingly, investors should not act on any recommendation (express or implied) or information in this material without obtaining specific advice from their financial advisors and should not rely on information herein as the primary basis for their investment decisions. Information contained herein is based on data obtained from recognized statistical services, issuer reports or communications, or other sources believed to be reliable (“information providers”). However, such information has not been verified by Dorsey, Wright & Associates, LLC (DWA) or the information provider and DWA and the information providers make no representations or warranties or take any responsibility as to the accuracy or completeness of any recommendation or information contained herein. DWA and the information provider accept no liability to the recipient whatsoever whether in contract, in tort, for negligence, or otherwise for any direct, indirect, consequential, or special loss of any kind arising out of the use of this document or its contents or of the recipient relying on any such recommendation or information (except insofar as any statutory liability cannot be excluded). Any statements nonfactual in nature constitute only current opinions, which are subject to change without notice. Neither the information nor any opinion expressed shall constitute an offer to sell or a solicitation or an offer to buy any securities, commodities or exchange traded products. This document does not purport to be complete description of the securities or commodities, markets or developments to which reference is made.
Potential for profits is accompanied by possibility of loss.
The material has been prepared or is distributed solely for information purposes and is not a solicitation or an offer to buy any security or instrument or to participate in any trading strategy.
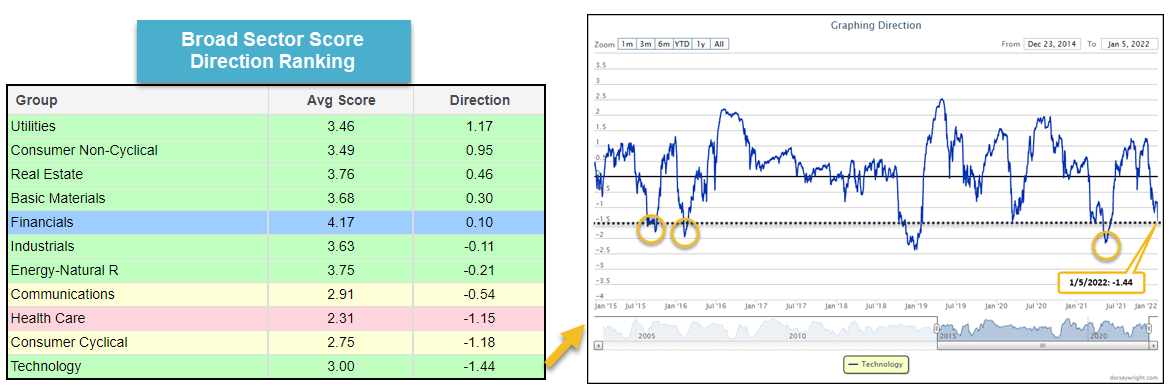
The US sector view on the Asset Class Group Scores (ACGS) page has seen quite the shake-up over the past month, with the New Year bringing a new layout of strength. These changes can be seen by sorting the sector groups by their average score direction, which shows the average gain or loss from a peak or trough over the past six months for each group. The risk-off sectors make up many of the names at the top of this sort, including groups such as utilities and consumer non-cyclical. Those groups at the bottom, or those with the lowest directional moves, include some of the risk-on groups such as technology and consumer cyclical.
The score decline in technology is especially noteworthy as the -1.44 directional move is among the most negative over the past 10 years. The group has only seen a directional move south of -1.50 on a handful of instances since 2010, including 2011, 2015-16, 2018, and May 2021. The only other time technology saw such a sharply negative score direction twice in the same rolling year came in October 2015 and February 2016.
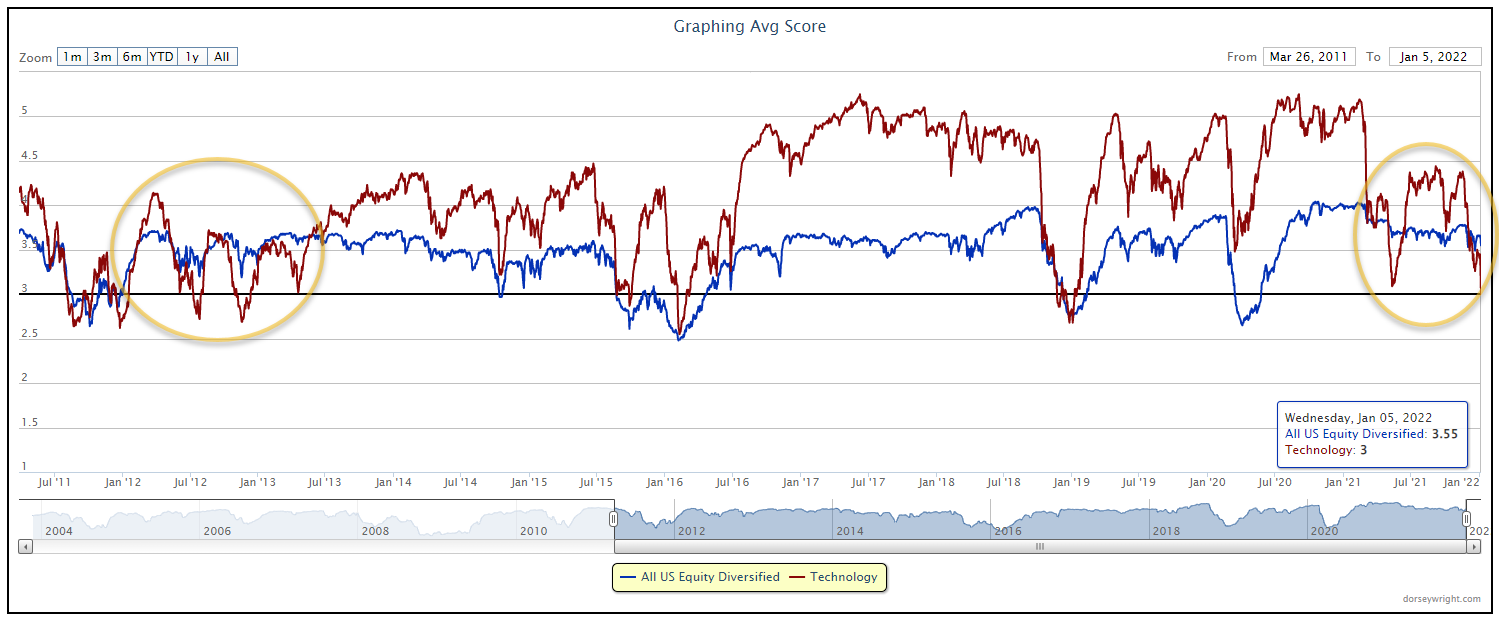
Most of the prior large score declines for technology were also paired with significant score declines for the broad US equity market, as shown through the US equity diversified group. This was the case in the 2015-16 and 2018 timeframes. In each of those instances, the group score for both technology and US equity diversified dipped below 3.00 before moving higher. However, the most recent score declines for technology have not seen the same moves as the broad US market has remained relatively resilient. This was also the case during the 2011-12 timeframe when the technology group saw substantially more volatility in score than the market.
We have seen the technology group move much quicker than the US equity diversified group over the past several years, but much of that movement has remained at consistently elevated score territory. The recent score divergence south for technology may be taken as a sign of caution over the next few weeks, as there is the potential for further volatility in the sector that may not carry over to the broader market.

Average Level
-8.70
| AGG | iShares US Core Bond ETF |
| USO | United States Oil Fund |
| DIA | SPDR Dow Jones Industrial Average ETF |
| DVY | iShares Dow Jones Select Dividend Index ETF |
| DX/Y | NYCE U.S.Dollar Index Spot |
| EFA | iShares MSCI EAFE ETF |
| FXE | Invesco CurrencyShares Euro Trust |
| GLD | SPDR Gold Trust |
| GSG | iShares S&P GSCI Commodity-Indexed Trust |
| HYG | iShares iBoxx $ High Yield Corporate Bond ETF |
| ICF | iShares Cohen & Steers Realty ETF |
| IEF | iShares Barclays 7-10 Yr. Tres. Bond ETF |
| LQD | iShares iBoxx $ Investment Grade Corp. Bond ETF |
| IJH | iShares S&P 400 MidCap Index Fund |
| ONEQ | Fidelity Nasdaq Composite Index Track |
| QQQ | Invesco QQQ Trust |
| RSP | Invesco S&P 500 Equal Weight ETF |
| IWM | iShares Russell 2000 Index ETF |
| SHY | iShares Barclays 1-3 Year Tres. Bond ETF |
| IJR | iShares S&P 600 SmallCap Index Fund |
| SPY | SPDR S&P 500 Index ETF Trust |
| TLT | iShares Barclays 20+ Year Treasury Bond ETF |
| GCC | WisdomTree Continuous Commodity Index Fund |
| VOOG | Vanguard S&P 500 Growth ETF |
| VOOV | Vanguard S&P 500 Value ETF |
| EEM | iShares MSCI Emerging Markets ETF |
| XLG | Invesco S&P 500 Top 50 ETF |
| Symbol | Company | Sector | Current Price | Action Price | Target | Stop | Notes |
|---|---|---|---|---|---|---|---|
| AKR | Acadia Realty Trust | Real Estate | $22.14 | 20 - 22 | 28 | 18 | 4 for 5'er, #6 of 154 in REAL sector matrix, one box from RS buy signal, 2.7% yield, |
| STOR | Store Capital Corp. | Real Estate | $33.70 | mid-to-upper 30s | 47.50 | 30 | 5 for 5'er, multiple buy signals, one box from 52-week high, 4.1% yield, R-R>2.0 |
| FOE | Ferro Corp | Chemicals | $21.80 | high teens to low 20s | 35 | 16 | 4 for 5'er, 8 consec buy signals, pullback from recent high, pos trend, top of DWACHEM matrix |
| SC | Santander Consumer USA Holdings Inc. | Finance | $41.64 | high 30s to mid 40s | 57 | 34 | 5 for 5'er, top 10% of DWAFINA, 3 consec buy signals, all-time highs, 2.11% yield, |
| ESI | Element Solutions Inc. | Chemicals | $24.50 | mid to upper 20s | 37 | 20 | 5 for 5'er, multi-year high, 6 consec buy signals, top of DWACHEM |
| BAM | Brookfield Asset Management | Finance | $57.78 | mid to hi 50s | 70 | 47 | 5 for 5'er, top 20% of FINA sector matrix, LT pos mkt RS, multiple consecutive buy signals |
| SMCI | Super Micro Computer, Inc. | Computers | $45.36 | low 40s | 52 | 34 | 4 for 5'er, top 20% of COMP sector matrix, multiple buy signals, pullback from ATH Earnings 1/31 |
| UMC | United Microlectronics Corporation (Taiwan) ADR | Semiconductors | $11.14 | 11.50 - 12.50 | 19 | 10 | 4 for 5'er, top half of favored SEMI sector matrix, bullish catapult, 2.4% yield, R-R>3.0, pot. cov. write |
| SMPL | Simply Good Foods Co | Retailing | $38.89 | mid-to-upper $30s | 56 | 31 | 4 for 5'er top half of RETA sector matrix, bullish catapult, pullback from ATH Earnings 1/5 |
| IBKR | Interactive Brokers Group, Inc. | Wall Street | $76.44 | mid 70s to low 80s | 89 | 62 | 4 for 5'er, 5 consec buy signals, monthly momentum to positive Earnings 1/17 |
| UAA | Under Armour, Inc. | Textiles/Apparel | $20.71 | low-to-mid 20s | 41.50 | 19.50 | 4 for 5'er top third of TEXT sector matrix, spread triple top, pullback from ATH, R-R>4.0 |
| BRO | Brown & Brown, Inc. | Insurance | $67.45 | low to upper 60s | 77 | 55 | 5 for 5'er, pos trend since 2010, longterm market RS buy signal, one box from 4th consec buy signal Earnings 1/24 |
| SEE | Sealed Air Corporation | Business Products | $66.80 | low-to-mid 60s | 89 | 53 | 5 for 5'er, top 20% of BUSI sector matrix, multiple consec buy signals |
| SWCH | Switch, Inc. Class A | Internet | $26.64 | 25 - 28 | 54.50 | 22 | 4 for 5'er #6 of 51 in INET sector matrix, spread triple top, R-R>5.0 |
| HD | Home Depot, Inc. | Building | $407.24 | high 380s to 410s | 540 | 316 | 5 for 5'er, long-term market RS buy, 3 consec buy signals, pullback from all-time high, 3 mon pos monthly mom, 1.69% yield |
| IR | Ingersoll-Rand Inc. | Machinery and Tools | $59.21 | mid 50s to low 60s | 74 | 49 | 5 for 5'er, pullback from ATH, 3 consecutive buy signals, pos monthly momentum |
| CUBE | CubeSmart | Real Estate | $53.94 | mid to upper 50s | 68 | 47 | 5 for 5'er, top 10% of DWAREAL, 7 consec buy signals, LT market RS buy signal |
| WTFC | Wintrust Financial Corporation | Banks | $95.64 | 90S | 112 | 79 | 4 for 5'er, top 20% of favored BANK sector matrix, triple top, 1.35% yield Earnings 1/19 |
| LYV | Live Nation Entertainment Inc. | Leisure | $117.47 | low 120s to mid 130s | 142 | 98 | 5 for 5'er, pullback from ATH, long-term market RS buy signal, 2 consecutive buy signals, pos month and weekly momentum |
| EQH | Equitable Holdings Inc | Insurance | $34.11 | mid to upper 30s | 47.5 | 27 | 4 for 5'er, pullback from ATH, 3 consec buy signals, pos weekly momentum flip, 2.2% yield |
| OFG | Oriental Financial Group | Banks | $28.02 | mid-to-high 20s | 37 | 23 | 5 for 5'er, top 20% of favored BANK sector matrix, LT pos mkt RS, multiple consec buy signals, 1.75% yield |
| COST | Costco Wholesale Corporation | Retailing | $549.92 | 530s to 580s | 672 | 432 | 5 for 5'er, 5 consec buy signals, pullback from all-time high, LT market RS buy signal since 2007. |
| Symbol | Company | Sector | Current Price | Action Price | Target | Stop | Notes |
|---|
| Symbol | Company | Sector | Current Price | Action Price | Target | Stop | Notes |
|---|---|---|---|---|---|---|---|
| CIO | CITY OFFICE REIT, INC. | Real Estate | $20.55 | 17 - 19 | 44.50 | 15.50 | See follow comment below. |
| BX | The Blackstone Group Inc | Finance | $117.79 | low 130s - low 140s | 168 | 108 | See follow comment below. |
| Comment |
|---|
| BX The Blackstone Group Inc R ($118.74) - Finance - BX moved to a sell signal with today's action. No new exposure. We will maintain our $108 stop. |
| CIO CITY OFFICE REIT, INC. R ($21.01) - Real Estate - CIO has moved outside of our actionable territory. We will maintain our stop at $15.50, the first sell signal on the chart. |
COST Costco Wholesale Corporation R ($550.74) - Retailing - COST is a perfect 5 for 5'er that has maintained a market RS buy signal since 2007, confirming the stock's long-term strength versus the broader market. COST hit a new all-time high last week before pulling back to $544 with today's market action. This pullback offers a nice entry point for those looking to go long COST. COST trades in a positive trend on five consecutive buy signals. Okay to add new exposure in the 530s to 580s. We will set our initial stop at $432, which would violate multiple support levels on the chart. We will use a modified bullish price objective based on the last buy signal of $672 as our near-term price target.
| 19 | 20 | 21 | ||||||||||||||||||||||||||||||||||||||||||||||||||||
| 568.00 | X | 568.00 | ||||||||||||||||||||||||||||||||||||||||||||||||||||
| 560.00 | X | X | o | 560.00 | ||||||||||||||||||||||||||||||||||||||||||||||||||
| 552.00 | X | O | X | o | 552.00 | |||||||||||||||||||||||||||||||||||||||||||||||||
| 544.00 | X | O | X | 1 | 544.00 | |||||||||||||||||||||||||||||||||||||||||||||||||
| 536.00 | X | O | X | 536.00 | ||||||||||||||||||||||||||||||||||||||||||||||||||
| 528.00 | X | C | X | Mid | 528.00 | |||||||||||||||||||||||||||||||||||||||||||||||||
| 520.00 | X | O | 520.00 | |||||||||||||||||||||||||||||||||||||||||||||||||||
| 512.00 | X | 512.00 | ||||||||||||||||||||||||||||||||||||||||||||||||||||
| 504.00 | X | 504.00 | ||||||||||||||||||||||||||||||||||||||||||||||||||||
| 496.00 | B | 496.00 | ||||||||||||||||||||||||||||||||||||||||||||||||||||
| 488.00 | X | 488.00 | ||||||||||||||||||||||||||||||||||||||||||||||||||||
| 480.00 | X | 480.00 | ||||||||||||||||||||||||||||||||||||||||||||||||||||
| 472.00 | X | 472.00 | ||||||||||||||||||||||||||||||||||||||||||||||||||||
| 464.00 | 9 | X | Bot | 464.00 | ||||||||||||||||||||||||||||||||||||||||||||||||||
| 456.00 | X | O | X | 456.00 | ||||||||||||||||||||||||||||||||||||||||||||||||||
| 448.00 | X | O | X | 448.00 | ||||||||||||||||||||||||||||||||||||||||||||||||||
| 440.00 | X | A | 440.00 | |||||||||||||||||||||||||||||||||||||||||||||||||||
| 432.00 | 8 | 432.00 | ||||||||||||||||||||||||||||||||||||||||||||||||||||
| 424.00 | X | 424.00 | ||||||||||||||||||||||||||||||||||||||||||||||||||||
| 416.00 | X | 416.00 | ||||||||||||||||||||||||||||||||||||||||||||||||||||
| 408.00 | 7 | 408.00 | ||||||||||||||||||||||||||||||||||||||||||||||||||||
| 400.00 | X | 400.00 | ||||||||||||||||||||||||||||||||||||||||||||||||||||
| 396.00 | • | X | 396.00 | |||||||||||||||||||||||||||||||||||||||||||||||||||
| 392.00 | X | • | X | 392.00 | ||||||||||||||||||||||||||||||||||||||||||||||||||
| 388.00 | X | X | O | • | X | X | 388.00 | |||||||||||||||||||||||||||||||||||||||||||||||
| 384.00 | X | X | O | X | O | • | X | X | O | X | 384.00 | |||||||||||||||||||||||||||||||||||||||||||
| 380.00 | X | O | X | O | X | C | 1 | X | O | X | O | X | 380.00 | |||||||||||||||||||||||||||||||||||||||||
| 376.00 | X | O | X | O | X | O | X | O | 5 | O | X | 6 | 376.00 | |||||||||||||||||||||||||||||||||||||||||
| 372.00 | X | O | X | O | X | O | X | O | X | O | 372.00 | |||||||||||||||||||||||||||||||||||||||||||
| 368.00 | X | O | B | O | X | O | X | O | X | 368.00 | ||||||||||||||||||||||||||||||||||||||||||||
| 364.00 | X | O | X | O | O | X | O | X | 364.00 | |||||||||||||||||||||||||||||||||||||||||||||
| 360.00 | X | A | O | X | O | O | 4 | 360.00 | ||||||||||||||||||||||||||||||||||||||||||||||
| 356.00 | X | O | X | O | O | X | 356.00 | |||||||||||||||||||||||||||||||||||||||||||||||
| 352.00 | 9 | O | X | O | X | 352.00 | ||||||||||||||||||||||||||||||||||||||||||||||||
| 348.00 | X | O | X | X | 2 | X | 348.00 | |||||||||||||||||||||||||||||||||||||||||||||||
| 344.00 | X | X | O | X | O | X | O | X | 344.00 | |||||||||||||||||||||||||||||||||||||||||||||
| 340.00 | X | O | X | O | X | O | X | O | X | • | 340.00 | |||||||||||||||||||||||||||||||||||||||||||
| 336.00 | X | O | X | O | X | O | O | X | • | 336.00 | ||||||||||||||||||||||||||||||||||||||||||||
| 332.00 | 8 | O | O | • | O | X | • | 332.00 | ||||||||||||||||||||||||||||||||||||||||||||||
| 328.00 | X | • | 3 | X | • | 328.00 | ||||||||||||||||||||||||||||||||||||||||||||||||
| 324.00 | X | X | X | • | O | X | • | 324.00 | ||||||||||||||||||||||||||||||||||||||||||||||
| 320.00 | X | O | X | O | X | X | • | O | X | • | 320.00 | |||||||||||||||||||||||||||||||||||||||||||
| 316.00 | 2 | O | X | O | X | X | O | X | • | O | X | • | 316.00 | |||||||||||||||||||||||||||||||||||||||||
| 312.00 | X | O | X | O | X | O | X | O | X | 6 | X | • | O | X | • | 312.00 | ||||||||||||||||||||||||||||||||||||||
| 308.00 | X | O | X | O | X | X | O | X | O | X | O | X | O | 7 | • | O | • | 308.00 | ||||||||||||||||||||||||||||||||||||
| 304.00 | X | X | 1 | O | X | O | X | O | X | O | X | O | X | O | X | O | X | • | • | 304.00 | ||||||||||||||||||||||||||||||||||
| 300.00 | 9 | O | X | O | X | O | X | O | X | O | X | X | O | X | O | 5 | X | O | X | • | 300.00 | |||||||||||||||||||||||||||||||||
| 296.00 | X | O | X | O | X | O | X | O | O | X | O | X | O | X | 4 | O | O | • | 296.00 | |||||||||||||||||||||||||||||||||||
| 292.00 | X | O | X | C | O | X | O | X | O | X | O | X | O | X | • | 292.00 | ||||||||||||||||||||||||||||||||||||||
| 288.00 | X | O | X | O | X | O | X | O | X | O | X | O | X | • | 288.00 | |||||||||||||||||||||||||||||||||||||||
| 284.00 | X | X | A | O | 3 | O | X | O | X | O | X | O | X | • | 284.00 | |||||||||||||||||||||||||||||||||||||||
| 280.00 | X | O | X | O | X | O | O | O | O | • | 280.00 | |||||||||||||||||||||||||||||||||||||||||||
| 276.00 | X | O | X | O | X | • | 276.00 | |||||||||||||||||||||||||||||||||||||||||||||||
| 272.00 | 7 | 8 | X | O | • | 272.00 | ||||||||||||||||||||||||||||||||||||||||||||||||
| 268.00 | X | O | X | • | 268.00 | |||||||||||||||||||||||||||||||||||||||||||||||||
| 264.00 | X | O | • | 264.00 | ||||||||||||||||||||||||||||||||||||||||||||||||||
| 260.00 | X | • | 260.00 | |||||||||||||||||||||||||||||||||||||||||||||||||||
| 256.00 | X | • | 256.00 | |||||||||||||||||||||||||||||||||||||||||||||||||||
| 252.00 | X | • | 252.00 | |||||||||||||||||||||||||||||||||||||||||||||||||||
| 248.00 | X | 6 | • | 248.00 | ||||||||||||||||||||||||||||||||||||||||||||||||||
| 244.00 | 4 | O | X | • | 244.00 | |||||||||||||||||||||||||||||||||||||||||||||||||
| 240.00 | X | O | X | • | 240.00 | |||||||||||||||||||||||||||||||||||||||||||||||||
| 236.00 | X | 5 | • | 236.00 | ||||||||||||||||||||||||||||||||||||||||||||||||||
| 232.00 | X | • | 232.00 | |||||||||||||||||||||||||||||||||||||||||||||||||||
| 228.00 | • | X | • | 228.00 | ||||||||||||||||||||||||||||||||||||||||||||||||||
| 224.00 | • | X | • | 224.00 | ||||||||||||||||||||||||||||||||||||||||||||||||||
| 220.00 | 3 | • | 220.00 | |||||||||||||||||||||||||||||||||||||||||||||||||||
| 216.00 | 2 | • | 216.00 | |||||||||||||||||||||||||||||||||||||||||||||||||||
| 212.00 | X | • | 212.00 | |||||||||||||||||||||||||||||||||||||||||||||||||||
| 208.00 | 1 | • | 208.00 | |||||||||||||||||||||||||||||||||||||||||||||||||||
| 204.00 | X | • | 204.00 | |||||||||||||||||||||||||||||||||||||||||||||||||||
| 200.00 | X | X | • | 200.00 | ||||||||||||||||||||||||||||||||||||||||||||||||||
| 198.00 | X | O | X | • | 198.00 | |||||||||||||||||||||||||||||||||||||||||||||||||
| 196.00 | X | O | X | • | 196.00 | |||||||||||||||||||||||||||||||||||||||||||||||||
| 194.00 | O | X | • | 194.00 | ||||||||||||||||||||||||||||||||||||||||||||||||||
| 192.00 | O | X | • | 192.00 | ||||||||||||||||||||||||||||||||||||||||||||||||||
| 190.00 | O | • | 190.00 | |||||||||||||||||||||||||||||||||||||||||||||||||||
| 19 | 20 | 21 |

| ADSK Autodesk, Inc. ($264.68) - Software - ADSK fell in early trading Thursday to break a double bottom at $260. This 2 for 5'er moved to a negative trend in November and ranks in the lower half of the software sector RS matrix. The technical picture is negative and once again weakening. Long exposure should be avoided. Additional support may be offered at $252 and $248, while initial overhead resistance is seen at $284. |
| CB Chubb Ltd ($197.98) - Insurance - CB broke a spread triple top at $198 for a second consecutive buy signal and a new all-time high on the chart. The stock is a 3 for 5'er that ranks in the top third of the Insurance sector matrix and is accompanied by a yield of roughly 1.6%. Okay to consider here on the breakout. Initial support lies at $186 with additional support at $180, the bullish support line. |
| CVNA Carvana Company ($190.83) - Autos and Parts - CVNA broke a double bottom at 194 on Thursday before tumbling lower to 186. This stock is an unacceptable 0 for 5’er that has given three consecutive sell signals since December. Avoid as supply is in control and the weight of the evidence is extremely bearish. |
| DDD 3D Systems Corporation ($20.14) - Machinery and Tools - DDD fell Thursday to break a double bottom at $20 before dropping to $19.50 intraday. This 0 for 5'er moved to a negative trend in October and ranks 64th out of 65 names in the machinery and tools sector RS matrix. Long exposure should be avoided. Note that the stock is at support from last May while initial overhead resistance may be seen at $24. |
| DLTR Dollar Tree, Inc. ($142.89) - Retailing - DLTR broke a double top at 144 on Thursday. This marks the retailing stock’s fourth consecutive buy signal. From here, support sits at 134 while DLTR faces resistance at 148. |
| FTCH Farfetch Limited Class A ($29.76) - Retailing - FTCH is an unacceptable 0 for 5’er within the unfavored retailing sector that broke a double bottom at $28 today, marking the stock’s fourth consecutive sell signal. Avoid as supply is in control and FTCH does not have any positive technicals in its favor at this time. |
| LLY Eli Lilly and Company ($260.14) - Drugs - LLY shares moved lower today to break a double bottom at $260 to mark its first sell signal. This 5 for 5'er has been in a positive trend since December of 2020 and on an RS buy signal versus the market since August. LLY is trading near the middle of its trading band with a weekly overbought/oversold reading of -2%. From here, support is offered at $240. |
| PXD Pioneer Natural Resources ($198.33) - Oil - PXD continued higher on Thursday, taking out resistance at $196, its 2021 high. PXD is a 5 for 5'er and ranks in the top half of the oil sector matrix. From here, support sits at $180. PXD carries a 1.2% yield. |
| SPWR Sunpower Corporation ($19.25) - Electronics - SPWR moved lower Thursday to break a double bottom at $19, marking a second consecutive sell signal and a new 52-week low. This 0 for 5'er moved to a negative trend in December and ranks in the bottom quintile of the unfavored electronics sector RS matrix. The weight of the evidence is negative here and continues to weaken. Long exposure should be avoided. Further support may be found at $18.50, while initial overhead resistance is seen at $22. |
| TREX Trex Company, Inc. ($123.54) - Building - TREX broke a double bottom at $124 on Thursday, resulting in a second consecutive sell signal. The stock maintains a 5 for 5 rating and high placement in the favored building stock sector matrix, but given the near-term absolute weakness, we would not advocate for new exposure at this time. The next level of support is distant, located at around $104. Demand would reenter the picture with a breakout at $138. |
| Name | Option Symbol | Action | Stop Loss |
|---|---|---|---|
| Edwards Lifesciences Corporation - $123.40 | EW2220E125 | Buy the May 125.00 calls at 10.30 | 114.00 |
| Name | Option | Action |
|---|---|---|
| Seagate Technology ( STX) | Feb. 105.00 Calls | Stopped at 11.05 (CP: 10.20) |
| United Parcel Service, Inc. ( UPS) | Mar. 210.00 Calls | Initiate an option stop loss of 11.25 (CP: 13.25) |
| Name | Option Symbol | Action | Stop Loss |
|---|---|---|---|
| Crocs, Inc. - $129.26 | CROX2217R135 | Buy the June 135.00 puts at 23.30 | 142.00 |
| Name | Option | Action |
|---|---|---|
| Unity Software, Inc. (U) | Feb. 140.00 Puts | Initiate an option stop loss of 21.50 (CP: 23.50) |
| Block Inc (SQ) | Mar. 165.00 Puts | Raise the option stop loss to 23.70 (CP: 25.70) |
| Name | Option Sym. | Call to Sell | Call Price | Investment for 500 Shares | Annual Called Rtn. | Annual Static Rtn. | Downside Protection |
|---|---|---|---|---|---|---|---|
| Builders FirstSource, Inc. $82.40 | BLDR2220E85 | May. 85.00 | 8.00 | $37,672.20 | 31.93% | 25.65% | 8.61% |
| Name | Action |
|---|---|
| EQT Corporation (EQT) - 21.69 | Sell the March 23.00 Calls. |
| Extreme Networks, Inc. (EXTR) - 14.77 | Sell the March 15.00 Calls. |
| Advanced Micro Devices, Inc. (AMD) - 136.15 | Sell the March 145.00 Calls. |
| Xilinx, Inc. (XLNX) - 201.66 | Sell the March 230.00 Calls. |
| SeaWorld Entertainment, Inc. (SEAS) - 64.82 | Sell the March 70.00 Calls. |
| Alcoa Inc. (AA) - 58.55 | Sell the March 65.00 Calls. |
| Arista Networks Inc (ANET) - 133.15 | Sell the May 150.00 Calls. |
| Macy's Inc. (M) - 26.44 | Sell the May 28.00 Calls. |
| Seagate Technology (STX) - 114.71 | Sell the March 115.00 Calls. |
| Jabil Circuit, Inc. (JBL) - 69.99 | Sell the June 75.00 Calls. |
| Teck Resources Limited (TECK) - 29.42 | Sell the May 31.00 Calls. |
| Name | Covered Write |
|---|---|
| D.R. Horton, Inc. ( DHI - 103.07 ) | May 110.00 covered write. |
Daily Equity & Market Analysis
Loading, Please Wait...
