Most Requested Symbols

We examine a few of the possible explanations for the recent precipitous drop in US Treasury yields.
As we do each quarter, today we update our U.S. and International "Smart Beta Quilts" and Factor Studies for the second quarter of 2021.
The past week of market action saw the US Equity Core Percentile Rank (CorePR) continue to push higher to a recent reading of 99.30%. We examine the frequency of elevated CorePR readings and average forward returns from such levels.
The average distribution reading is 28.87% overbought.
Today's featured stock is Liveramp Holdings Inc. (RAMP)
ADS, BBW, BNFT, C, DENN, DIS, FCX, GBCI, GIL, HZNP, MTZ, RF & SATS
Call: Amphenol Corporation (APH); Put: Ionic Pharmaceuticals (IONS); Covered Write: Amkor Technology (AMKR)
Beginners Series Webinar: Join us on Friday, July 9th, at 2 PM (ET) for our NDW Beginners Series Webinar. This week's topic is Understanding Relative Strength & the Matrix Tool. Register Here.
Equity markets exhaled on Thursday (7/8) from all-time highs; the S&P 500 (SPX), Nasdaq Composite (NASD), and Dow (DJIA) fell 0.92%, 0.76%, and 1.12%, respectively. Note these daily changes are higher than the intraday lows recorded, telling us that markets recouped some of their losses, as Dow futures were down over 500 points before the open. The pullback was, at least partially, attributed to concerns about the spreading Delta variant in other parts of the world along with the ongoing effects of a tight labor market and supply shortages pitted against high economic growth expectations from investors. Given the intraday drawdown, most of the major equity market indices reversed lower into a column of O’s on their intermediate-term Point & Figure charts; however, there were no material support violations. That said, the downtick (thus far) in equities appears to be an appropriate, expected, and healthy exhale after a breathless run to all-time highs. Domestic Equities retain the top rank in DALI and the US Equity Core remains dominant amongst all other groups, as we further examine in today’s Fund Score Overview, but we will see several reversals down across a variety of our bullish percent indicators, suggesting that underlying participation continues to narrow.

We also saw fixed income yields continue their descent on Thursday. The US Treasury 10YR Yield Index (TNX) ticked lower in a column of O’s to 1.275% on its default Point & Figure chart, now resting on its bullish support line. Should this trend violation occur, it would add further technical evidence of the shift in sentiment regarding potential rate hikes. Below in today’s (7/8) report we further unpack this unique fixed income environment.


In Thursday’s trading, the US Treasury 10YR Yield Index TNX reached 1.275% on its default chart after closing at around 1.48% last Thursday – a drop of around 20 basis points in a week’s time. Throughout all of May and June, TNX traded within a 25 basis point range between 1.45% and 1.7% on its chart, which offers some perspective on the magnitude of this move.
A Bloomberg article from Tuesday, when TNX was around 1.35%, or 10 basis points higher than where it currently sits in its P&F chart, showed that its then-current level was three standard deviations below the level projected by JP Morgan’s “fair value model,” which is the largest deviation since fall of 2020. The model uses factors like inflation expectations, fed guidance, and recent economic data to predict an equilibrium level for the 10-year yield.
A number of explanations for the drop in yields have been offered including:
The reality is that are probably multiple factors driving the decline in yields. However, some of these explanations seem diametrically opposed – yields have declined because investors don’t believe the Fed will taper as fast as it has indicated vs. they’ve declined because of lower growth and inflation expectations due to the Fed’s more hawkish tone. The fact that we saw global equities decline Thursday in tandem with sovereign yields (in the US and elsewhere) runs counter to the idea that investors are doubting the Fed’s sincerity and believe the easy-money party will continue uninterrupted.
Whether due to tighter monetary policy or a resurgence of COVID-19, most of the other rationales that have been offered up have a common theme of investors adjusting their expectations for growth downward, which would be consistent with some of the other risk-off moves recently.
The sharp drop in Treasury yields merits our attention as it is a notable deviation from the norm and certainly has a risk-off undertone. That being said, at this point, there is no indication of weakness in the equities market. Even with Thursday’s decline the S&P 500 SPX and Nasdaq NASD both remain within 2% of their all-time highs, domestic equities remain atop the DALI asset class rankings, and US equity core percentile rank within the Asset Class Group Scores sits above 99%.
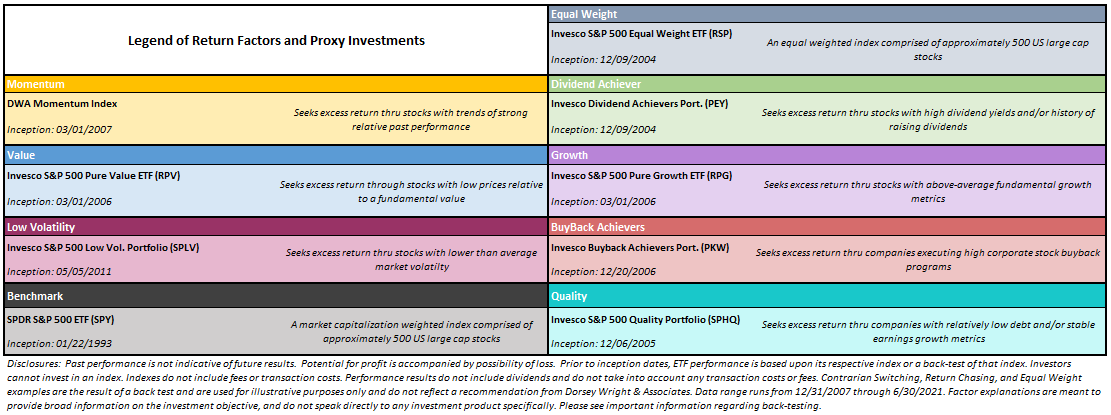
As we do each quarter, today we update our U.S. and International "Smart Beta Quilts" and Factor Studies for the second quarter of 2021. Before the term “factor investing” became commonplace within the financial community, there were two main "factors" that advisors were already using within client portfolios: growth and value. Advisors commonly used various market capitalization sizes or some form of style rotation, but beyond that, there was not a lot of access to many of the security selection processes that are available today. Over the past decade, the number of investable factors has increased significantly, thanks in large part to the proliferation of ETFs. The term "factor" is broad, and there is a healthy debate as to what exactly should fall into that category. Arguably, any indexing strategy in which securities are chosen systematically, based on measurable attributes, with a goal of producing superior returns over the asset class would qualify. Still, that covers a wide range and is a vague definition, but we can agree it goes well beyond "growth" and "value."
Other factors that are commonly accessible through ETFs today are momentum, low volatility, quality, dividend achiever, and buyback strategies. All of these factors are designed to pinpoint a certain investment theme within the marketplace, and systematically allocate to that theme. For instance, the “low volatility” factor is represented by the Invesco S&P 500 Low Volatility ETF (SPLV), a fund that seeks exposure to the 100 stocks with the lowest volatility in the S&P 500. Over time, most of the factors examined offer better performance than the benchmark, the SPDR S&P 500 ETF (SPY), however, no single factor ETF has been the best performer every year, or even most of the years...nor has any single factor ETF been the worst performing every year or most of the years.

Our goal with the research above is both to illustrate the range of factors that are available and also the necessity of being disciplined in applying these factors over time as we want to promote "good behavior", as it relates to any investment process or product. This is perhaps the most important observation from the data above: We've illustrated the outcomes generated by a few common behaviors using the same investment universe, and the outcomes vary dramatically! There are the "buy and hold" outcomes, which show growth as the best performer, but we also know inherently what comes with a buy and hold commitment to only growth. While not visible above, 2000-2002 were tough years for that factor, tougher than many could endure in fact. Another approach that we illustrate is to simply equal weight all seven of the individual factors in a portfolio and rebalance that portfolio once a year. Additionally, we looked at the hypothetical behavior of buying the best performing factor from the previous year and holding that factor for the entire next calendar year. For our purposes, we label this “Return Chasing,” and while no portfolio manager markets themselves this way exactly, it is an emotional bias that creeps into many investors' psyches.
This "Return Chasing" portfolio tracks a hypothetical investor who sees that momentum was the best performing factor in 2020, and then just owns that factor for 2021. This strategy worked out well in 2020 and there have been a few other years where the return chasing worked out, such as when value was the best performer in back-to-back years from 2012 to 2013. However, even though it has worked out well in a few instances, on a cumulative basis, return chasing has been the worst “strategy” and has massively underperformed the contrarian strategy and an equal-weighted basket of the factors. The factors themselves are not the problem, as most create substantial alpha relative to the market. However, bad behavior can create bad returns out of good products, and constantly chasing last year's best performing factor is an example of bad behavior.
The opposite of return chasing is the contrarian approach, which hypothetically buys the worst-performing factor from the previous year and holds it for the subsequent calendar year. The “Contrarian Switching” portfolio illustrates what is missed when an investor dumps a factor for having a bad year, and this strategy outperformed both cap-weighted and equal-weighted benchmarks over the study period! A good stock can become a bad stock and may remain a bad stock for a long time. A good factor is much less likely to remain perennially out of favor. A good factor should have a process of systematically eliminating bad stocks at some point and should return to favor as a result. Each factor illustrated above is available through an ETF, or multiple ETFs because they have been vetted through research and real-life portfolio management applications, which provides some confidence that periods of underperformance should not become perpetual underperformance.
This tells us that lagging years for a good investment factor have commonly been better-than-average entry points. In 2016, momentum had a rough go of it, which was the first time during the lookback period that it was the worst-performing factor. In the following year, it was the second-best performing factor behind growth, and these were the only two factors to outperform the benchmark. 2017's worst-performing factor (shown above) was the "Dividend" factor, which we represent with a Dividend Achiever portfolio (PEY), which is weighted based upon yield. The long-term returns for this fund are heavily weighted toward dividends and so the price return of the fund is perhaps less representative of the outcome than with other factor-based products. In 2018, we did not see much of a "mean reversion" as PEY was near the bottom of the pack again. Value also had a rough go of it during 2018, which was followed by underperformance in both 2019 and 2020. As a result, the "Contrarian Switching" approach lagged in those years. However, through the first six months of 2021 we have seen somewhat of a return to form for the Contrarian Switching strategy, as value went from the lowest-ranked factor in 2020 to the best so far this year.
These strategies can also be applied to factor representatives from international equities, which, as we can see below, demonstrate similar tendencies to their domestic counterparts.


The past week of market action saw the US Equity Core Percentile Rank (CorePR) continue to push higher to a recent reading of 99.30% through trading on Wednesday (7/7). As a refresher, the CorePR tracks the relative position of the S&P 500 Index Funds group, our core market representative, when compared against the rest of the groups found on the Asset Class Group Scores (ACGS) page. This recent reading came as the core moved into the second-ranked position, sitting behind MLPs with a recent group score of 4.39. While this is not the highest average score the group has seen so far in 2021, it is one of the highest readings we have seen for the CorePR. This is only the third time the reading has gotten to the 99th percentile, which last occurred in November 2019 and previously in early October 2018. Those two instances saw drastically different movements for the S&P 500 Index SPX in the months that followed. The end of 2018 saw a sharp market correction and enhanced volatility in the last few months of the year, while the market continued to push higher in late-2019 and continued to hit new all-time highs in 2020 prior to the pandemic-induced market decline.
As we covered in the Fund Score Overview last Friday, it is a good sign to see elevated positioning for the CorePR reading, as this points toward a favorable stance for the broader domestic equity space. However, extremely high levels for the CorePR can present the risk of a near-term pullback as this points towards a narrowing of market strength. The bullish nature of domestic equity markets makes it fairly normal to see high CorePR readings, but just how often have we seen levels north of 90%?
To help answer this question, we measured the percentage of days the CorePR reading sat in each decile from its origin on November 18, 2003, through market movement Wednesday. We also took the average return for SPX over a forward one, three, six, and twelve-month timeframe for each decile.

As shown by the above table, the CorePR reading has sat at 90% or higher for 21% of the trading days since late-2003. In fact, the reading has been north of 70% for the majority of its existence at 53% of the trading days. The average forward return data shows that the broader hypothesis of elevated positioning leading to strong domestic equity returns holds true, as the returns are generally higher when the indicator remains above 70%. However, we can also see that the average returns become more muted as the reading moves from 70% to 100%, highlighting the potential for a near-term reversion or normalization in the price action for the core market representative.
Out of the 976 trading days that have seen a CorePR reading at or above 90%, roughly 62% of the average returns one month out from those days were positive. If we go three months down the road from those elevated positioning days, we see that 72% of returns were positive. This continues to improve over the forward six-month and twelve-month average returns at respective positive return “batting averages” of 78% and 87%.
At the time of this writing on Thursday, the S&P 500 Index is posting an intraday loss of about 1%, which would mark its fourth-worst daily decline since the end of March. While we cannot know with certainty what the next few months hold, the historical CorePR data for positioning above the 90th percentile does present the possibility of muted near-term movement over the next month, but that movement has shown historical improvement further along the timeline.
Average Level 28.87
| AGG | iShares US Core Bond ETF |
| USO | United States Oil Fund |
| DIA | SPDR Dow Jones Industrial Average ETF |
| DVY | iShares Dow Jones Select Dividend Index ETF |
| DX/Y | NYCE U.S.Dollar Index Spot |
| EFA | iShares MSCI EAFE ETF |
| FXE | Invesco CurrencyShares Euro Trust |
| GLD | SPDR Gold Trust |
| GSG | iShares S&P GSCI Commodity-Indexed Trust |
| HYG | iShares iBoxx $ High Yield Corporate Bond ETF |
| ICF | iShares Cohen & Steers Realty ETF |
| IEF | iShares Barclays 7-10 Yr. Tres. Bond ETF |
| LQD | iShares iBoxx $ Investment Grade Corp. Bond ETF |
| IJH | iShares S&P 400 MidCap Index Fund |
| ONEQ | Fidelity Nasdaq Composite Index Track |
| QQQ | Invesco QQQ Trust |
| RSP | Invesco S&P 500 Equal Weight ETF |
| IWM | iShares Russell 2000 Index ETF |
| SHY | iShares Barclays 1-3 Year Tres. Bond ETF |
| IJR | iShares S&P 600 SmallCap Index Fund |
| SPY | SPDR S&P 500 Index ETF Trust |
| TLT | iShares Barclays 20+ Year Treasury Bond ETF |
| GCC | WisdomTree Continuous Commodity Index Fund |
| VOOG | Vanguard S&P 500 Growth ETF |
| VOOV | Vanguard S&P 500 Value ETF |
| EEM | iShares MSCI Emerging Markets ETF |
| XLG | Invesco S&P 500 Top 50 ETF |

| Symbol | Company | Sector | Current Price | Action Price | Target | Stop | Notes |
|---|---|---|---|---|---|---|---|
| GTES | Gates Industrial Corporation plc | Business Products | $17.81 | high 10s | 22 | 14 | 4 for 5'er, top 1/3 of business products sector RS matrix, bullish triangle, multi-year highs, consec buys Earnings 8/2 |
| GRMN | Garmin Ltd. | Electronics | $147.83 | high 130s to high 140s | 177 | 116 | 5 for 5'er, 5 consec buy signals, double top at ATH,LT market RS buy signal Earnings 7/27 |
| ASML | Asm Lithograpghy HLDG NV (Netherlands) ADR | Semiconductors | $690.18 | mid-to-upper 600s | 856 | 592 | 5 for 5'er, top 10% of SEMI sector matrix, LT pos mkt RS, R-R>2.0 |
| GFL | GFL Environmental Inc | Waste Management | $32.92 | low to upper 30s | 38 | 26 | 5 for 5'er, 5 consec buy signals, pullback from ATH Earnings 7/28 |
| AKR | Acadia Realty Trust | Real Estate | $21.35 | 20 - 22 | 28 | 18 | 4 for 5'er, #6 of 154 in REAL sector matrix, one box from RS buy signal, 2.7% yield Earnings 7/28 |
| SPR | Spirit Aerosystems Holdings Inc. | Aerospace Airline | $45.03 | high 40s - low 50s | 78 | 40 | 4 for 5'er, top third of AERO sector matrix, bearish signal reversal, R-R>2.5 Earnings 8/2 |
| FHN | First Horizon Corp. | Banks | $16.49 | high 10s | 25.5 | 15.5 | 4 for 5'er, 4 consec buy signals, at multi-year highs, top 15% of DWABANK matrix, 3.28% yield Earnings 7/16 |
| STOR | Store Capital Corp. | Real Estate | $35.75 | mid-to-upper 30s | 47.50 | 30 | 5 for 5'er, multiple buy signals, one box from 52-week high, 4.1% yield, R-R>2.0 Earnings 8/3 |
| WHD | Cactus, Inc. Class A | Oil Service | $37.12 | hi 30s - low 40s | 51.50 | 32 | 5 for 5'er, #2 of 29 in favored OILS sector matrix, bullish triangle, pullback from ATH Earnings 7/27 |
| RVNC | Revance Therapeutics, Inc | Biomedics/Genetics | $32.47 | hi 20s - low 30s | 40 | 26 | 4 for 5'er, top 25% of BIOM sector matrix, quad top breakout, positive trend change, pos monthly mom flip Earnings 8/4 |
| NDLS | Noodles & Company | Restaurants | $12.16 | 11.50 - 13.50 | 20 | 10 | 5 for 5'er, #1 of 28 in REST sector matrix, triple top, pullback to mid of trading band, R-R>2.5 Earnings 8/4 |
| ANF | Abercrombie & Fitch Co. | Retailing | $43.56 | mid-to-hi 40s | 59 | 36 | 5 for 5'er, #6 of 97 names in favored RETA sector matrix, triple top breakout, pos wkly mom flip |
| SEM | Select Medical Holdings Corporation | Healthcare | $40.97 | hi 30s - low 40s | 58 | 35 | 5 for 5'er, #8 of 116 names in favored HEAL sector matrix, multiple buy signals, good R-R, Earn. 7/28 |
| BKE | The Buckle, Inc. | Retailing | $45.43 | high to low 40s | 73 | 38 | 4 for 5'er, pullback from rally high, top 25% favored DWARETA, buy signal, pos weekly momentum |
| DRI | Darden Restaurants, Inc. | Restaurants | $148.79 | mid 140s - mid 150s | 180 | 126 | 3 for 5'er, top half of REST sector matrix, spread triple top, pos wkly mom flip, 1.8% yield |
| Symbol | Company | Sector | Current Price | Action Price | Target | Stop | Notes |
|---|---|---|---|---|---|---|---|
| OPEN | Opendoor Technologies Inc. | Wall Street | $16.03 | low to mid 10s | 2 | 19.50 | 0 for 5'er, 4 consecutive sell signals, negative trend, bottom of DWAWALL matrix, negative monthly momentum |
| RAMP | Liveramp Holdings Inc. | Business Products | $44.11 | high 40s to high 30s | 36 | 51 | 0 for 5'er, 10 consec sell signals, 52 week lows, negative monthly mom flip, negative trend |
| Symbol | Company | Sector | Current Price | Action Price | Target | Stop | Notes |
|---|---|---|---|---|---|---|---|
| CAL | Caleres Inc. | Textiles/Apparel | $25.18 | mid to upper 20s | 32 | 23 | See follow comment below. |
| Comment |
|---|
| CAL Caleres Inc. R ($25.07) - Textiles/Apparel - CAL moved to a sell signal with today's action. Maintain a $23 stop. |
RAMP Liveramp Holdings Inc. R ($43.58) - Business Products - RAMP is an unacceptable 0 for 5’er that ranks in the bottom decile of the unfavored business products sector stock matrix. RAMP moved into a negative trend in mid-February of this year and is showing significant weakness relative to its peers as well as the broader market. RAMP has given 10 consecutive sell signals since January, just days after printing a new all-time high, and recently printed a new 52 week low at $41. Furthermore, weekly momentum just flipped negative, suggesting the potential for lower prices. Supply is in control. Short exposure okay in the high 40s to high 30s range. We will set our initial buy stop at $51, which would mark the first buy signal on the chart. We will use $36, the bottom of the 10 week trading band, as our near-term price target.
| 21 | |||||||||||||||||||||||||||||||||||||||||||||||||||||
| 87.00 | X | • | 87.00 | ||||||||||||||||||||||||||||||||||||||||||||||||||
| 86.00 | X | O | • | 86.00 | |||||||||||||||||||||||||||||||||||||||||||||||||
| 85.00 | X | O | X | • | • | 85.00 | |||||||||||||||||||||||||||||||||||||||||||||||
| 84.00 | X | X | O | X | O | X | • | 84.00 | |||||||||||||||||||||||||||||||||||||||||||||
| 83.00 | X | O | X | O | X | O | X | O | • | 83.00 | |||||||||||||||||||||||||||||||||||||||||||
| 82.00 | X | O | X | O | X | O | X | O | • | 82.00 | |||||||||||||||||||||||||||||||||||||||||||
| 81.00 | • | X | O | O | O | X | O | • | 81.00 | ||||||||||||||||||||||||||||||||||||||||||||
| 80.00 | X | • | X | O | X | O | • | 80.00 | |||||||||||||||||||||||||||||||||||||||||||||
| 79.00 | X | O | • | X | O | 2 | O | • | 79.00 | ||||||||||||||||||||||||||||||||||||||||||||
| 78.00 | X | O | • | X | O | X | O | • | 78.00 | ||||||||||||||||||||||||||||||||||||||||||||
| 77.00 | X | O | • | X | O | X | O | • | 77.00 | ||||||||||||||||||||||||||||||||||||||||||||
| 76.00 | X | O | • | X | O | O | • | 76.00 | |||||||||||||||||||||||||||||||||||||||||||||
| 75.00 | X | O | • | X | O | • | 75.00 | ||||||||||||||||||||||||||||||||||||||||||||||
| 74.00 | X | O | • | • | X | X | O | X | • | 74.00 | |||||||||||||||||||||||||||||||||||||||||||
| 73.00 | X | O | X | • | X | O | X | O | X | O | • | 73.00 | |||||||||||||||||||||||||||||||||||||||||
| 72.00 | X | O | X | O | X | O | X | O | X | O | • | 72.00 | |||||||||||||||||||||||||||||||||||||||||
| 71.00 | X | O | X | X | O | X | 1 | O | O | X | • | 71.00 | |||||||||||||||||||||||||||||||||||||||||
| 70.00 | X | O | X | O | X | O | X | O | X | O | • | 70.00 | |||||||||||||||||||||||||||||||||||||||||
| 69.00 | X | O | X | O | X | O | X | • | O | X | O | • | 69.00 | ||||||||||||||||||||||||||||||||||||||||
| 68.00 | X | O | X | O | X | O | • | O | O | • | 68.00 | ||||||||||||||||||||||||||||||||||||||||||
| 67.00 | X | X | O | X | O | • | O | X | • | 67.00 | |||||||||||||||||||||||||||||||||||||||||||
| 66.00 | X | X | O | X | O | X | • | O | X | O | X | • | 66.00 | ||||||||||||||||||||||||||||||||||||||||
| 65.00 | X | O | X | O | X | O | X | • | O | X | O | 3 | O | • | 65.00 | ||||||||||||||||||||||||||||||||||||||
| 64.00 | X | O | X | B | X | O | X | X | • | O | X | O | X | O | • | 64.00 | |||||||||||||||||||||||||||||||||||||
| 63.00 | X | O | X | O | X | O | X | X | O | X | • | O | O | X | O | • | 63.00 | ||||||||||||||||||||||||||||||||||||
| 62.00 | X | O | X | O | O | X | O | X | O | X | • | O | O | • | 62.00 | ||||||||||||||||||||||||||||||||||||||
| 61.00 | X | O | X | O | X | O | X | O | X | • | O | • | 61.00 | ||||||||||||||||||||||||||||||||||||||||
| 60.00 | X | O | O | X | O | O | C | • | O | • | 60.00 | ||||||||||||||||||||||||||||||||||||||||||
| 59.00 | X | O | O | X | • | O | Top | 59.00 | |||||||||||||||||||||||||||||||||||||||||||||
| 58.00 | X | • | O | X | • | O | 58.00 | ||||||||||||||||||||||||||||||||||||||||||||||
| 57.00 | X | • | O | X | • | O | X | X | 57.00 | ||||||||||||||||||||||||||||||||||||||||||||
| 56.00 | X | • | O | X | • | O | X | O | X | O | 56.00 | ||||||||||||||||||||||||||||||||||||||||||
| 55.00 | X | • | O | • | O | X | O | X | O | 55.00 | |||||||||||||||||||||||||||||||||||||||||||
| 54.00 | X | A | • | • | O | X | O | O | 54.00 | ||||||||||||||||||||||||||||||||||||||||||||
| 53.00 | X | O | X | • | O | X | O | X | 4 | 53.00 | |||||||||||||||||||||||||||||||||||||||||||
| 52.00 | O | X | O | X | • | O | X | O | X | O | X | O | 52.00 | ||||||||||||||||||||||||||||||||||||||||
| 51.00 | O | X | O | X | • | O | X | O | X | O | X | O | 51.00 | ||||||||||||||||||||||||||||||||||||||||
| 50.00 | O | O | • | O | X | O | O | O | X | X | X | X | 50.00 | ||||||||||||||||||||||||||||||||||||||||
| 49.00 | • | O | O | X | O | X | O | X | O | X | O | 49.00 | |||||||||||||||||||||||||||||||||||||||||
| 48.00 | • | O | X | O | X | O | X | O | X | O | 48.00 | ||||||||||||||||||||||||||||||||||||||||||
| 47.00 | • | O | 5 | X | O | X | 6 | X | O | Mid | 47.00 | ||||||||||||||||||||||||||||||||||||||||||
| 46.00 | O | X | O | O | X | 7 | 46.00 | ||||||||||||||||||||||||||||||||||||||||||||||
| 45.00 | O | O | X | O | 45.00 | ||||||||||||||||||||||||||||||||||||||||||||||||
| 44.00 | O | X | o | 44.00 | |||||||||||||||||||||||||||||||||||||||||||||||||
| 43.00 | O | X | o | 43.00 | |||||||||||||||||||||||||||||||||||||||||||||||||
| 42.00 | O | X | 42.00 | ||||||||||||||||||||||||||||||||||||||||||||||||||
| 41.00 | O | 41.00 | |||||||||||||||||||||||||||||||||||||||||||||||||||
| 21 |
| ADS Alliance Data Systems Corporation ($99.55) - Business Products - ADS broke a spread quadruple bottom at $100 before falling down to the $99 level. This is the third consecutive sell signal for the stock and violates notable support at $102 that dates back to April. This move appears that it will cause the market RS chart to reverse down into a column of O's causing the stock to fall to a 4 for 5'er. Monthly momentum also flipped negative this week. Short-term holder may look to exit here, while long-term holders may seek to trim here on this violation of support. |
| BBW Build-A-Bear Workshop, Inc. ($16.34) - Retailing - BBW is a 5 for 5’er within the favored retailing sector that broke a spread triple bottom with today’s market action. Despite this near-term price weakness, BBW remains a long-term leader. From here, those long can look to $15 for additional support. |
| BNFT Benefitfocus, Inc. ($13.05) - Software - BNFT moved lower Thursday to break a triple bottom at $13. This 1 for 5'er has been in a negative trend since early-2019 and ranks in the lower quartile of the software sector RS matrix. Weekly and monthly momentum each recently flipped negative as well, suggesting the potential for further downside from here. Avoid long exposure. Further support can be found at $12.50, with initial overhead resistance seen at $15. Earnings are expected on 8/3. |
| C Citigroup, Inc. ($66.73) - Banks - C shares moved lower today to break a spread triple bottom at $67 to mark its second consecutive sell signal. This 2 for 5'er still remains in a positive trend but has been on an RS sell signal versus the market since March of 2020. C shares are heavily oversold at current levels with a weekly overbought/oversold reading below -70%. From here, support is offered at $66 and then not until $58. |
| DENN Denny's Corporation ($15.74) - Restaurants - DEN broke a double bottom at $15.50 on Thursday, which violated its bullish support line. As a result, DEN is now trading in a negative trend with 2 attributes in its favor. Avoid. Earnings are expected 7/26. |
| DIS The Walt Disney Company ($173.41) - Media - DIS completed a bearish triangle pattern today and broke through its bearish resistance line. As a result, DIS is now trading in a negative trend with 2 attributes in its favor. Avoid as the trend is negative and supply is in control. Further support sits at $168. |
| FCX Freeport-McMoRan Inc. ($34.69) - Metals Non Ferrous - FCX broke a spread triple bottom at $34 for a third consecutive sell signal and violating a support level that dates back to April of this year. FCX still remains a 4 for 5'er, but the series of lower tops through May and June cause reason for evaluation. Holders of FCX may seek to trim here on this support level violation. From here, support now lies at $30, which is currently the bottom of the 10-week trading band. |
| GBCI Glacier Bancorp Inc ($52.22) - Banks - GBCI broke a double bottom at $52, which follows a spread triple bottom at $55, and completes a bearish catapult. This also counts for the third consecutive sell signal and a violation of the bullish support line, causing the stock to fall to a 2 for 5'er. Holders may seek to trim upon the violation of support here. Support now lies at $47. |
| GIL Gildan Activewear ($34.44) - Textiles/Apparel - After forming a double top at 38, shares of GIL broke a double bottom at 34. This sets the chart up for a potential shakeout pattern. From here, the action point of the shakeout would occur with a reversal up into Xs and the pattern would complete with a triple top breakout at 39. GIL is a 5 for 5’er that ranks in the top half of the textiles/apparel sector stock matrix. Okay to play the pattern on the reversal or upon completion. Earnings are slated for 8/5. |
| HZNP Horizon Pharma PLC ($92.81) - Drugs - HZNP shares moved lower today to break a double bottom at $93 which also broke its bullish support line putting the stock into a negative trend. This 4 for 5'er has been on an RS buy signal versus the market since November of 2018. HZNP is trading near the middle of its trading band with a weekly overbought/oversold reading of 5%. From here, support is offered at $90. |
| MTZ Mastec Inc ($100.62) - Building - Shares of MTZ dropped on Thursday to break a double bottom at $99, completing a bearish catapult pattern. The stock remains a 5 for 5 attribute name in the top quartile of the building stock sector matrix but given the recent weakness those looking to initiate new long exposure may consider waiting for demand to reenter the picture with a double top break at $110. Those already long may look to $96 as the next level of support. Note earnings are expected on 7/28. |
| RF Regions Financial Corporation ($18.97) - Banks - RF shares moved lower today to break a double bottom at $19 to mark its first sell signal of the year. This 3 for 5'er remains in a positive trend but has been on an RS sell signal versus the market since March of 2020. RF is heavily oversold at current levels with a weekly overbought/oversold reading of -70%. From here, support is offered at $17. |
| SATS EchoStar Corporation ($22.97) - Media - SATS fell Thursday to break a double bottom at $23. This 0 for 5'er moved to a negative trend in February of last year and has been on an RS sell signal against the market since late-2018. Long exposure should be avoided. Further support can be found at $21 and $20. Initial overhead resistance may be seen at $28, which is also the current location of the bullish support line. Earnings are expected on 8/4. |
| Name | Option Symbol | Action | Stop Loss |
|---|---|---|---|
| Amphenol Corporation - $68.92 | APH2115J67.5 | Buy the October 67.50 calls at 4.20 | 64.00 |
| Name | Option | Action |
|---|---|---|
| Tempur Sealy International Inc. ( TPX) | Sep. 35.00 Calls | Stopped at 5.70 (CP: 5.20) |
| The Charles Schwab Corporation ( SCHW) | Sep. 70.00 Calls | Stopped at 68.00 (CP: 67.73) |
| Cameco Corporation ( CCJ) | Sep. 20.00 Calls | Stopped at 18.00 (CP: 18.08) |
| Schlumberger Limited ( SLB) | Oct. 32.50 Calls | Stopped at 30.00 (CP: 30.38) |
| Name | Option Symbol | Action | Stop Loss |
|---|---|---|---|
| Ionis Pharmaceuticals Inc. - $38.77 | IONS2115V40 | Buy the October 40.00 puts at 6.10 | 45.00 |
| Name | Option | Action |
|---|---|---|
| Las Vegas Sands Corp. (LVS) | Sep. 60.00 Puts | Raise the option stop loss to 8.20 (CP: 10.20) |
| Liveramp Holdings Inc. (RAMP) | Aug. 50.00 Puts | Raise the option stop loss to 5.90 (CP: 7.90) |
| Name | Option Sym. | Call to Sell | Call Price | Investment for 500 Shares | Annual Called Rtn. | Annual Static Rtn. | Downside Protection |
|---|---|---|---|---|---|---|---|
| Amkor Technology, Inc. $22.48 | AMKR2117L23 | Dec. 23.00 | 2.30 | $9,996.75 | 31.40% | 23.17% | 9.33% |
| Name | Action |
|---|---|
| The Gap, Inc. (GPS) - 31.38 | Sell the September 38.00 Calls. |
| International Game Technology (IGT) - 22.98 | Sell the October 25.00 Calls. |
| The Gap, Inc. (GPS) - 31.38 | Sell the September 33.00 Calls. |
| Himax Technologies, Inc. ADR (Taiwan) (HIMX) - 14.90 | Sell the September 16.00 Calls. |
| Devon Energy Corporation (DVN) - 27.53 | Sell the October 30.00 Calls. |
| Allegheny Technologies, Inc. (ATI) - 21.48 | Sell the October 22.50 Calls. |
| Cleveland-Cliffs Inc. (CLF) - 21.39 | Sell the October 22.00 Calls. |
| Marathon Oil Corporation (MRO) - 12.93 | Sell the September 14.00 Calls. |
| Antero Resources Corp (AR) - 13.98 | Sell the November 15.00 Calls. |
| Macy's Inc. (M) - 17.17 | Sell the November 20.00 Calls. |
| Avantor, Inc. (AVTR) - 35.72 | Sell the November 37.50 Calls. |
| Wendy's Company (WEN) - 22.71 | Sell the November 24.00 Calls. |
| Snap Inc (SNAP) - 65.13 | Sell the October 70.00 Calls. |
| Ford Motor Company (F) - 14.23 | Sell the October 15.00 Calls. |
| Name | Covered Write |
|---|---|
| Tanger Factory Outlet Centers ( SKT - 18.27 ) | September 20.00 covered write. |
Daily Equity & Market Analysis
LISTEN TO PODCAST
Apr 02, 2026
Loading, Please Wait...
