
Some recent short-term changes suggest investors may be realigning their equity exposure away from the reflation trade.
This year, the dominant theme in the US equity market has probably been the reopening or “reflation” trade. The hallmark of this trade has been a resurgence in areas of the market that had underperformed during the COVID-19 shutdown and are expected to benefit the most from the resumption of normal economic activity. This theme has been exhibited in the general outperformance of small cap over large, value over growth and at a sector level by strong gains from areas such as energy, financials, and consumer cyclicals. It has also been characterized by an underperforming technology sector, which had been the best performing sector of the market during the COVID shutdown and had led the DALI sector rankings almost continuously for the last few years.
However, recently there has been evidence that the technology sector may be turning around. After hitting a multi-year low around 3.1 in May, the average fund score for the technology group, within the Asset Class Group Scores (ACGS), has rebounded and crossed above the 4.0 threshold earlier this month and now has continued higher to its current level of 4.33. Its average group score places technology second among the macro sectors behind energy, and seventh out of all 135 groups in the ACGS system. Within the DALI sector rankings, which tend to move a bit more slowly than the Asset Class Group Scores, the technology sector remains in the middle of the pack in fifth place, however, we have seen the sector’s buy signal tally stop falling and pick up a few signals over the last few weeks.

We’ve also seen another shift in the existing dynamic, albeit over the very short-term. Since 6/15, following the Federal Reserve’s June meeting when members of the FOMC increased their median projection for interest rates in 2023, we have seen outperformance by large stocks, especially those in the mega cap category. Between 6/15 and 6/28, the Invesco S&P 500 Top 50 ETF XLG has gained 1.88% outperforming, while the S&P 100 ETF OEF gained 1.60%, and the S&P 500 SPX has returned 1.04% over the period. Meanwhile, the S&P iShares Russell 2000 ETF IWM is up just 0.03% over the same period. Of course, this cannot be completely separated from sector themes. As we mentioned above, the technology sector has gained relative strength recently and it is also home to many mega cap stocks. The technology sector accounts for 37.7% of XLG, while it’s only around 27% of the S&P 500.

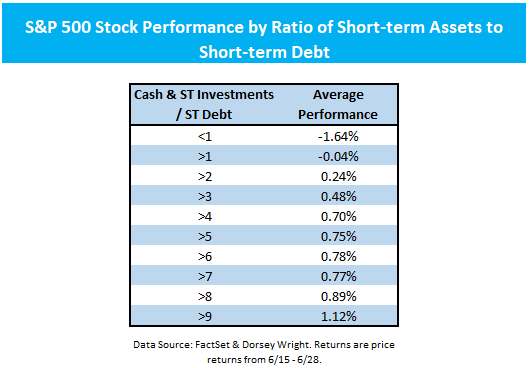
Over the same period, there has also been stronger performance by companies with stronger balance sheets. The table below shows the average (equal weighted) performance for stocks in the S&P 500 (excluding banks) broken out by their ratio of cash and short-term investments to short-term debt. We can see that generally as the ratio of cash and short-term investments to debt increases performance also rises. On average, stocks with a ratio of less than 1.0, i.e. their short-term debts exceed their short-term assets, have returned -1.64%. Meanwhile, at the other end of the spectrum, those with a ratio greater than 9.0 have returned 1.12% on average.
The items we’ve outlined above – the technology sector gaining relative strength, large/mega cap stocks outperforming their smaller counterparts, and stronger performance by firms with better debt profiles – indicate that investors may be adjusting their equity positions away from some of the more speculative areas of the market toward larger more mature stocks with more stability. Bear in mind, however, that in each case we’re talking only about very short-term events that shouldn’t be taken as an immediate call to action, but warrant our attention to see if they develop into sustained trends.
