
Most Requested Symbols

Broad emerging markets and international small cap names have each showed improvement in recent weeks.
Today's featured stock is ProLogis (PLD).
NTGR, ASND, CHD, FND, A, FSLR, OKTA, OMI, RCL, & WMS
Call: Garmin (GRMN), Put: Delta Air Lines (DAL), Covered Write: Qorvo (QRVO)
Monday Market Update Webinar Replay: Missed Monday's (8/17) webcast? Click the link(s) below for a recap:
As we have seen in this pandemic, numerous Americans have shifted work and school into their homes. Coupled with low interest rates, this has encouraged many people to re-enter the housing market searching for properties in the suburbs hoping for more space. Earlier this week, the housing starts report came out showing that there was an increase of 22.6% in July compared to June, signaling the rise in demand in the housing industry. These numbers are actually tracked on our research platform under the symbol HOUSESTARTS. It is an index that tracks total housing starts (measured in thousands) and is updated on a monthly basis as data becomes available. This chart has reversed into X’s in June and continued higher in July with the most recent number released, after having hit a multi-year low in April. It is worth noting that the home building activity is only about 7% away from the pre-coronavirus high, and the chart is about 10% away from giving a buy signal. If you are interested in getting notified on changes of this indicator, we recommend that you utilize the Set Alert function for column and signal changes. If you want to access other economic indicator charts that we track, they can be found under Security Selection > Chart Lists > Economic Indicator Charts (bottom left).


Each week the analysts at DWA review and comment on all major asset classes in the global markets. Shown below is the summary or snapshot of the primary technical indicators we follow for multiple areas. Should there be changes mid-week we will certainly bring these to your attention via the report.
| Universe | BP Col & Level (actual) | BP Rev Level | PT Col & Level (actual) | PT Rev Level | HiLo Col & Level (actual) | HiLo Rev Level | 10 Week Col & Level (actual) | 10 Week Rev Level | 30 Week Col & Level (actual) | 30 Week Rev Level |
|---|---|---|---|---|---|---|---|---|---|---|
| ALL |
|
52% |
|
44% |
|
84% |
|
62% |
|
54% |
| NYSE |
|
62% |
|
50% |
|
86% |
|
68% |
|
54% |
| OTC |
|
48% |
|
40% |
|
84% |
|
58% |
|
52% |
| World |
|
54% |
|
42% |
|
|
|
56% |
|
50% |
The gap between fixed income and domestic equity continues to narrow as there are just five signals separating the two asset classes. Just this month alone, domestic equity has picked up 15 new buy signals while fixed income has lost three. As the market has recovered from the COVID-19 induced selloff, domestic equity is close to moving back to the top of the asset class ranks. The last time domestic equity was number one was from August 2016 until March 12, 2020.
With that said, we have seen another notable achievement come from the domestic equity Cash Percentile Rank. To briefly review, the Cash Percentile Rank is an indicator that measures the position of a cash proxy within a specific asset class matrix. To measure this, we have constructed comprehensive RS matrices specific to each of the asset classes and included a cash proxy as a member of each. We evaluate these matrices on a daily basis to see where cash resides and then display the results, using a traffic light of sorts, assigning the specific asset class either a green, yellow, or red light. If cash resides in the bottom third of the matrix, this suggests poor RS for cash versus others in the matrix, so it gets a green light. As cash rises in the matrix and moves into the middle third, the light turns yellow. This would suggest that members of the asset class are starting to falter and that we should move towards a more cautious or hedged approach to that asset class. Once cash ascends to the top third of the matrix, the light will turn red, indicating that on an aggregate basis, the asset class has weakened enough to merit cash as a better overall investment choice relative to that particular asset class. As mentioned above, the domestic equities asset class has just shifted to a green light for the Cash Percentile Rank, suggesting a more offensive posture toward domestic equities as an asset class.
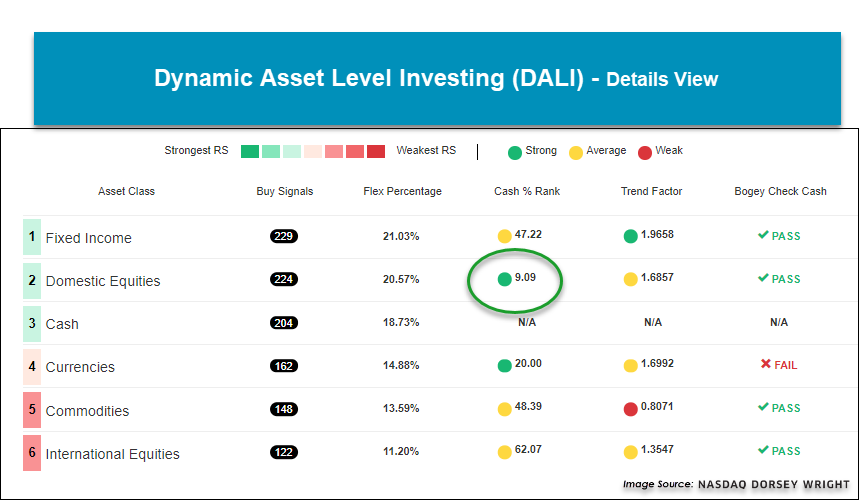
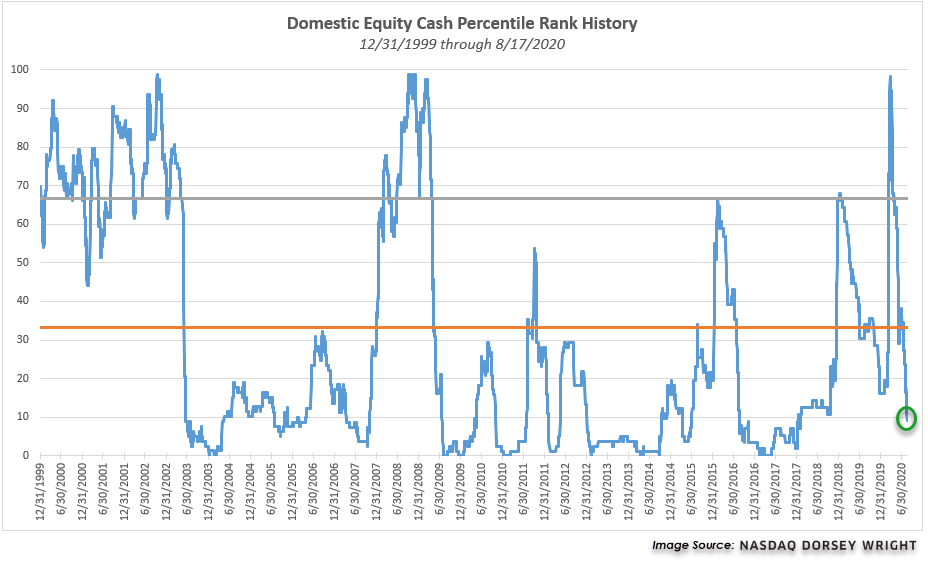
Just this week we have seen the Cash Percentile Rank for domestic equity fall below the 10% level with a current reading of 9.09%, which simply means that the cash proxy is stronger than just 9% of the domestic equity representatives in the relative strength matrix ranking. This reading comes after a high reading of 98% in the throws of the market selloff back in March. The reading ultimately fell below the 33% reading on July 14, 2020, officially turning the light from yellow to green for domestic equity. Similarly, the Cash Percentile Rank for domestic equity fell below 10% back in August 2016 and remained below 10% until January 2018. Time will tell how this trip below 10% plays out, but suffice it to say that the vast majority of the domestic equity market is ranking higher than cash these days.

| Symbol | Name | Price | Yield | PnF Trend | RS Signal | RS Col. | Fund Score | 200 Day MA | Weekly Mom |
|---|---|---|---|---|---|---|---|---|---|
| DIA | SPDR Dow Jones Industrial Average ETF Trust | 278.20 | 2.15 | Positive | O | 4.07 | 262.80 | +4W | |
| EEM | iShares MSCI Emerging Markets ETF | 44.75 | 2.00 | Positive | Sell | O | 5.11 | 40.84 | -2W |
| EFA | iShares MSCI EAFE ETF | 65.25 | 2.50 | Positive | Sell | O | 3.02 | 62.73 | -1W |
| FM | iShares MSCI Frontier 100 ETF | 24.56 | 3.23 | Negative | Sell | O | 0.39 | 25.90 | +1W |
| IJH | iShares S&P MidCap 400 Index Fund | 193.50 | 1.66 | Positive | Buy | O | 3.20 | 182.81 | +4W |
| IJR | iShares S&P SmallCap 600 Index Fund | 74.70 | 1.58 | Positive | Buy | O | 2.79 | 71.87 | +4W |
| QQQ | Invesco QQQ Trust | 277.97 | 0.59 | Positive | Buy | X | 5.86 | 223.16 | -2W |
| RSP | Invesco S&P 500 Equal Weight ETF | 110.39 | 1.94 | Positive | Buy | X | 4.04 | 104.60 | +4W |
| SPY | SPDR S&P 500 ETF Trust | 338.64 | 1.69 | Positive | O | 4.24 | 306.40 | +5W | |
| XLG | Invesco S&P 500 Top 50 ETF | 263.85 | 1.38 | Positive | O | 5.65 | 229.69 | +6W |
Over the last week of market action, seven of the major market ETFs covered in this report finished in positive territory while three finished in the red. The top two performing funds for the week were the Invesco QQQ Trust QQQ and the Invesco S&P 500 Top 50 ETF XLG with gains of 4.82% and 2.77%, respectively, as we continue to witness those stocks in the large and mega-cap camps march higher. Small-caps struggled this week as the three worst-performing funds included the Invesco S&P 500 Equal Weight ETF RSP, iShares S&P MidCap 400 Index Fund IJH, and the iShares S&P SmallCap 600 Index Fund IJR with respective losses of -0.15%, -0.38%, and -1.32%. Today, we'll walk through how to use smaller scales/box sizes to identify tighter support levels on those charts that may be trading on a stem, such as the QQQ and the XLG.
When tracking the price action of a security over time using the Point & Figure methodology, we can target a shorter-term picture that is more sensitive to price movements by using a smaller box size to view the chart. In the images below, we look at both the default charts for the QQQ and XLG versus their respective 2-point per box charts.


In both cases, the default charts have been on a long stem of X's that have been intact since April of this year. As the indexes continue to better their highs, new X's are added to these columns, moving them further from potential support levels for those who may be entering new positions or holding open positions. When we look at the more sensitive 2-point per box charts, we can identify better areas of support and resistance. For example, the 2-point chart for the QQQ shows a pullback and subsequent reversal up into X's that occurred just this month. With yesterday's market action, this chart broke a double top at $276 before pushing higher to $278, marking the second consecutive buy signal for the fund in addition to printing a new record high. This price action also establishes support at the $266 level as a result of the QQQ's brief exhale, with additional support offered at $252. We find that these support levels are much more manageable when compared to the QQQ's default chart support, which sits at $182, more than -34.5% away from where the fund is trading today.
Concerning XLG, the 2-point per box chart reveals a total of eight consecutive buy signals that have occurred over the last four months as well as a recent rally to new all-time highs at $264. In terms of support levels for the XLG, we can identify $246 as initial support, with additional support coming in at $244 and $232. In comparison, the default chart for the XLG offers initial support at $188, over -28% away from where XLG trades today. Overall, both the QQQ and XLG offer bullish technical pictures with scores over the strong 5.50-level. Although at first glance they may appear too overbought for new positions, the more sensitive box sizes show attractive entry points at current levels, with reasonable support nearby.
SECTOR BULLISH PERCENT CHANGES
| Reversed to X | Reversed to O |
|---|---|
| 0 | 1 (BPPROT | 60), |
| To Xs | To Os |
|---|---|
| Metals Non Ferrous ( 0.97 to 54 ) | None |
Average Level
62.20
| Sector |
|---|
| None |
| Sector |
|---|
| Oil (46%) - Bear Correction |
| Oil Service (42%) - Bull Alert |
| Savings & Loans (48%) - Bull Confirmed |
| Sector |
|---|
| Internet (56%) - Bull Correction |
| Precious Metals (56%) - Bull Correction |
| Protection Safety Eq (60%) - Bear Alert |
| Software (56%) - Bear Confirmed |
SECTOR INDICATOR CHART CHANGES
PT is the percentage of stocks within a sector that are trading above their bullish support lines. RSX is the percentage of stocks within a sector whose relative strength charts are in a column of Xs. RSP is the percentage of stocks within a sector whose relative strength charts are on a buy signal. The strongest sectors, i.e. market leaders, will have most of these indicators positive and moving higher in a column of Xs.
|
There were only rising sector PT charts this week, with 13 rising and none moving lower. The following sector charts rose: Autos and Parts [^PTAUTO], Building [^PTBUIL], Chemicals [^PTCHEM], Food Beverages/Soap [^PTFOOD], Forest Prods/Paper [^PTFORE], Leisure [^PTLEIS], Metals Non Ferrous [^PTMETA], Restaurants [^PTREST], Retailing [^PTRETA], Telephone [^PTTELE], Transports/Non Air [^PTTRAN], Wall Street [^PTWALL]-Rev. , Waste Management [^PTWAST]. There were 1 that reversed to X. |
|
| ^PT Charts Reversing Up - | ^PT Charts Reversing Down - |
|
|
| ^PT Charts Moving Higher - | ^PT Charts Moving Lower - |
|
|
|
There were mostly falling sector RSX charts this week, with 9 falling and 7 rising. The following sector charts rose: Aerospace Airline [^RSXAERO]-Rev. , Gaming [^RSXGAME], Leisure [^RSXLEIS]-Rev. , Machinery and Tools [^RSXMACH]-Rev. , Protection Safety Equipment [^RSXPROT]-Rev. , Restaurants [^RSXREST], Transports/Non Air [^RSXTRAN]-Rev. . The following sector charts fell: Banks [^RSXBANK], Biomedics/Genetics [^RSXBIOM], Drugs [^RSXDRUG], Utilities/Electricity [^RSXEUTI]-Rev. , Healthcare [^RSXHEAL], Internet [^RSXINET], Metals Non Ferrous [^RSXMETA]-Rev. , Precious Metals [^RSXPREC], Software [^RSXSOFT]. There were no sector RSX charts that moved to a buy or sell signal this week. |
|
| ^RSX Charts Reversing Up - | ^RSX Charts Reversing Down - |
| ^RSX Charts Moving Higher - | ^RSX Charts Moving Lower - |
|
There were equal amounts of rising and falling sector RSP charts this week, with 5 both rising and falling. The following sector charts rose: Autos and Parts [^RSPAUTO], Gaming [^RSPGAME]-Rev. , Metals Non Ferrous [^RSPMETA], Restaurants [^RSPREST]-Rev. , Telephone [^RSPTELE]. The following sector charts fell: Biomedics/Genetics [^RSPBIOM], Utilities/Electricity [^RSPEUTI], Forest Prods/Paper [^RSPFORE]-Rev. , Oil Service [^RSPOILS], Textiles/Apparel [^RSPTEXT]. There were 2 that reversed to X and 1 that reversed to O. |
|
| ^RSP Charts Reversing Up - | ^RSP Charts Reversing Down - |
|
|
| ^RSP Charts Moving Higher - | ^RSP Charts Moving Lower - |
FAVORED SECTOR STATUS CHANGES
A sector is considered to be Favored if it has 3 or 4 of the sector indicators (Relative Strength, RSX, RSP, & PT) positive, Average if it has 2 of the 4 indicators positive, & Unfavored if it has 0 or 1 of the indicators positive. The table below contains those sectors that have experienced a Favored Sector Status change over the past week. It is best to focus on sectors that are about 50% or lower on their Bullish Percent charts & are in Xs. Note: If a sector moves from Favored to Average, it doesn't necessarily mean that the sector in question has to be sold - it just means you need to evaluate your individual positions with exposure to that sector.
| Changes since 08/12/2020 | Full Report |
|
|
|
|
||||||
|
|
|
|
|
|
||||
|
|
|
|
|
||||
|
|
|
|
|
|
||||

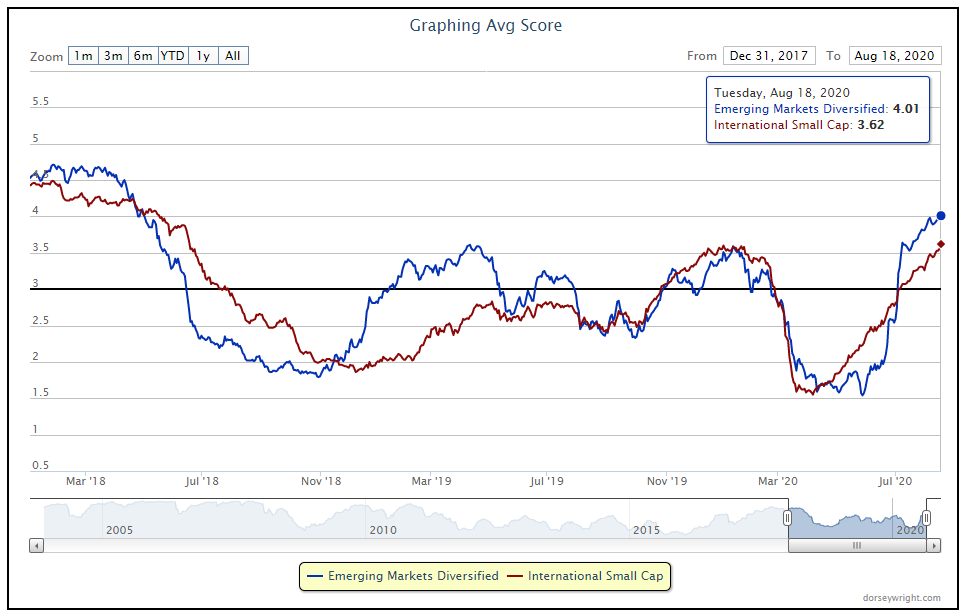
The emerging markets equity space has been the major improver for international stocks over the past few weeks, as we can see through the Asset Class Group Scores (ACGS) page. These rankings show how the score for the emerging markets diversified group has now risen back above the sought after 4 score threshold, with a recent posting of 4.01 through trading Tuesday. This marks the first time the group has been above 4.00 on an average score basis since the market decline ensued in March, which ultimately led the group to a multi-year score low of only 1.54 by the end of May. Furthermore, this recent movement also marks the highest average score for the broad emerging markets representative since May of 2018, as the space has rallied to score significantly higher than its pre-COVID readings.
Another international group that has shown noticeable strength in recent weeks is the international small cap space, which just moved to a score posting of 3.62 to notch its own highest score level since June of 2018. Furthermore, we can see that the group possesses an average score direction of 2.28, which is the 15th highest directional reading out of all 135 groups tracked on the ACGS system. Perhaps unsurprisingly, emerging markets diversified has the highest directional reading of any non-US specific group with a posting of 2.75.
In using the ideas tab directly to the left of the international small cap group name, we can see a variety of fund representatives that have shown recent improvement. Given the recent strength displayed by broader emerging markets, it makes sense to take a look at those international small-cap funds with more focused exposure toward emerging economies. One such fund is the iShares MSCI Emerging Markets Small Cap ETF EEMS, which has moved significantly higher off its March low of $27.50 to give four consecutive buy signals while ascending to its current level of $44. This fund boasts a 4.08 recent score posting, which bests the aforementioned 4.01 score for emerging markets as well as the 3.48 average score for all non-US funds. EEMS also carries a strongly positive score direction of 3.79, which is indicative of the recent improvement from both emerging markets and specifically international small caps. The overall weight of the evidence is strong here and continues to improve, however, those looking for long exposure should note that EEMS is in a slightly elevated territory with an intraday weekly overbought/oversold reading of 78% at the time of this writing on Wednesday. Initial support can be found at $38. Note that EEMS also carries a 2.60% yield.

After completing a bearish signal reversal in last week’s trading, its first buy signal since June, the US Treasury 10YR Yield Index TNX reversed down on its default chart Wednesday when it hit 0.65%. The Five- and 10-year yield indexes remained unchanged.
In Tuesday’s trading, the NYCE U.S. Dollar Index DX/Y printed an O at $92.50 on its default chart, marking a 10-point decline since it peaked at $102.50 in March. The index has given multiple consecutive sell signals, most recently completing a bearish catapult last month and has now taken out all support it has found in the last year.

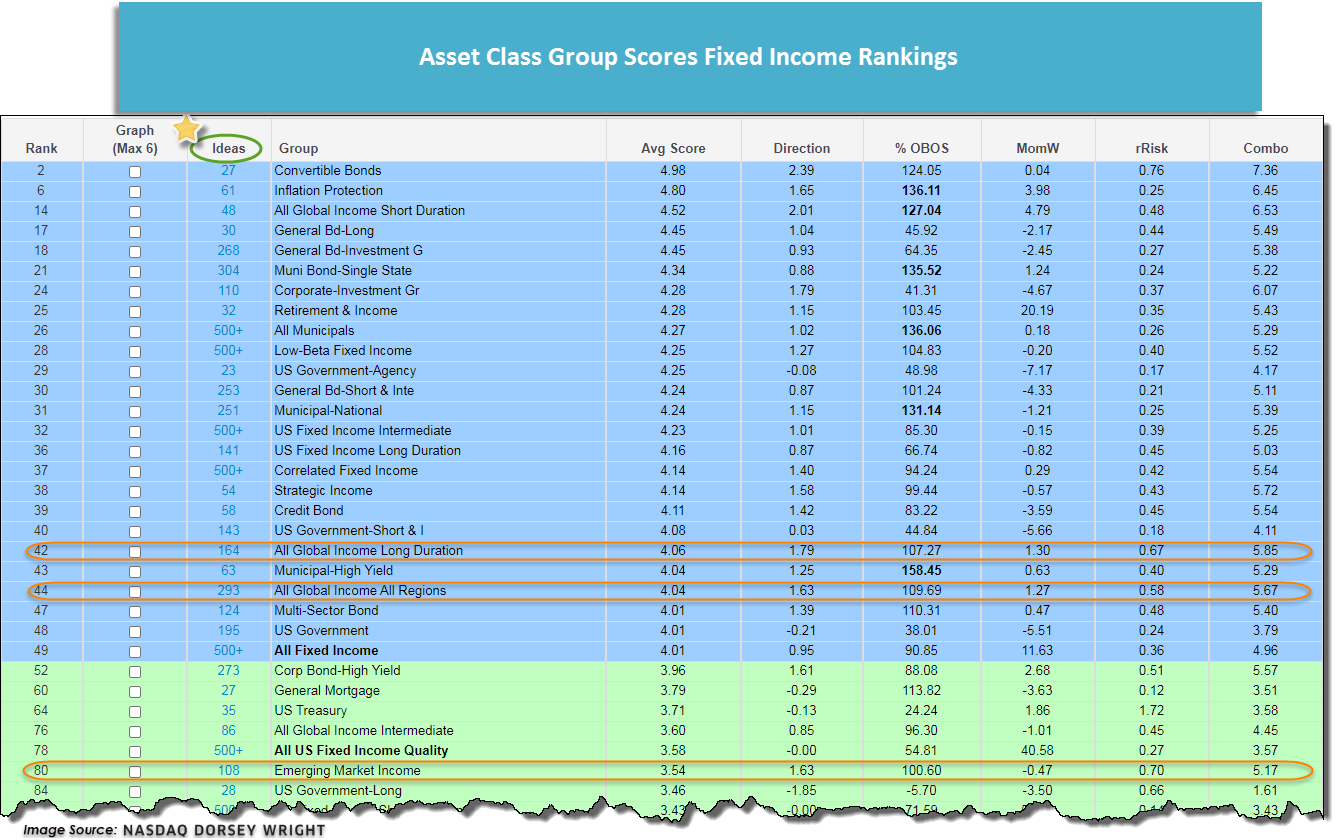
The falling dollar has been a tailwind for foreign currency-denominated fixed income and within the last month. The All Global Income Long Duration and the All Global Income All Regions groups in the Asset Class Group Scores System (ACGS) have each crossed above the 4.0 score threshold, while the Emerging Market Income group recently crossed above the 3.50 threshold and is among the top. Each of the three groups is among the top 10 most improved fixed income groups over the last 30 days (through 8/18).
Those interested in adding exposure to foreign bonds given their recent strength and the negative trend of the US dollar have several options. You can find a list of ideas for each of the foreign fixed income groups by clicking the blue number in the “Ideas” column next to the group’s name on the Asset Class Group Scores page.
Remember, these are technical comments only. Just as you must be aware of fundamental data for the stocks we recommend based on technical criteria in the report, so too must you be aware of important data regarding delivery, market moving government releases, and other factors that may influence commodity pricing. We try to limit our technical comments to the most actively traded contracts in advance of delivery, but some contracts trade actively right up to delivery while others taper off well in advance. Be sure you check your dates before trading these contracts. For questions regarding this section or additional coverage of commodities email james.west@dorseywright.com.
Data represented in the table below is through 8/18/20:
Broad Market Commodities Report
| Symbol | Name | Price | PnF Trend | RS Signal | RS Col. | 200 Day MA | Weekly Mom |
|---|---|---|---|---|---|---|---|
| CL/ | Crude Oil Continuous | 42.57 | Positive | Buy | X | 42.37 | -7W |
| DBLCIX | Deutsche Bank Liquid Commodities Index | 282.00 | Negative | Sell | O | 278.45 | +19W |
| DWACOMMOD | DWA Continuous Commodity Index | 511.17 | Positive | Buy | O | 462.00 | -184W |
| GC/ | Gold Continuous | 2012.50 | Positive | Buy | X | 1663.24 | +7W |
| HG/ | Copper Continuous | 2.97 | Positive | Buy | X | 2.60 | -3W |
| ZG/ | Corn (Electronic Day Session) Continuous | 327.00 | Negative | Buy | O | 350.10 | -5W |
Similar to the equity markets we note broadening upside participation in the alternative assets space, recently demonstrated by positive advances from lumber LBS/.
Akin to large cap growth and technology carrying the equity markets higher, precious and industrial metals were a lone bright spot in the commodities space for an extended period. However, as of lately we find increased participation from agricultural and energy-related spaces, manifesting in broad commodity tracking ETFs like the Invesco DB Commodity Index DBC giving four consecutive buy signals and reentering a positive trend. DBC also boasts a healthy fund score of 3.28 atop a strongly positive score direction of 2.90, adding to the favorable technical picture. Furthermore, the ETF is now experiencing a flip to positive monthly momentum after being negative for six months, suggesting the potential for additional appreciation. Supplementary confirmation can be found on the Asset Class Group Scores (ACGS) page as the Commodities group as a whole is just below the sought-after 3.00 average score line, an area last (briefly) visited in May of 2018.
All this said, the leaders are still leading. Darlings like Gold GC/ and Silver SI/ remain technically robust, each trading on Point and Figure buy signals near the top of their ten-week trading band. In fact, SI/ completed a bullish triangle just yesterday (8/18) and the industrial metal Copper HG/ resides just one box away from breaking a spread quadruple top to reach a 52-week high on its default chart. As for “new participants” in the commodities space, apart from a few soft commodities highlighted last week we find Lumber LBS/ demonstrating technical strength. Take for example the iShares S&P Global Timber & Forestry ETF WOOD and its largest holding Weyerhaeuser Company WY, each of which are nearing heavily overbought territory as a result of recent price appreciation. Thematically speaking, Home Depot HD even mentioned the shortage in lumber on a recent conference call and how respective prices consequently climbed (Source: wsj.com).
At the end of the day, supply and demand remain the driver of prices and temporary imbalances can lead to reversions (whether to the upside or downside). Sustained periods of demand or supply will thus lead to defined leaders and laggards, so if and when those trends change in the alternative assets space we will be sure to highlight them here.

Average Level
37.71
| AGG | iShares US Core Bond ETF |
| USO | United States Oil Fund |
| DIA | SPDR Dow Jones Industrial Average ETF |
| DVY | iShares Dow Jones Select Dividend Index ETF |
| DX/Y | NYCE U.S.Dollar Index Spot |
| EFA | iShares MSCI EAFE ETF |
| FXE | Invesco CurrencyShares Euro Trust |
| GLD | SPDR Gold Trust |
| GSG | iShares S&P GSCI Commodity-Indexed Trust |
| HYG | iShares iBoxx $ High Yield Corporate Bond ETF |
| ICF | iShares Cohen & Steers Realty ETF |
| IEF | iShares Barclays 7-10 Yr. Tres. Bond ETF |
| LQD | iShares iBoxx $ Investment Grade Corp. Bond ETF |
| IJH | iShares S&P 400 MidCap Index Fund |
| ONEQ | Fidelity Nasdaq Composite Index Track |
| QQQ | Invesco QQQ Trust |
| RSP | Invesco S&P 500 Equal Weight ETF |
| IWM | iShares Russell 2000 Index ETF |
| SHY | iShares Barclays 1-3 Year Tres. Bond ETF |
| IJR | iShares S&P 600 SmallCap Index Fund |
| SPY | SPDR S&P 500 Index ETF Trust |
| TLT | iShares Barclays 20+ Year Treasury Bond ETF |
| GCC | WisdomTree Continuous Commodity Index Fund |
| VOOG | Vanguard S&P 500 Growth ETF |
| VOOV | Vanguard S&P 500 Value ETF |
| EEM | iShares MSCI Emerging Markets ETF |
| XLG | Invesco S&P 500 Top 50 ETF |
Relative strength is a measure of how a stock is performing when compared to something else, in this case the S&P 500 Equal Weighted Index (SPXEWI). Each day the stock's closing price is divided by that of the SPXEWI, the resulting numbers decimal is moved two places and then plotted on a Point & Figure chart. Whenever the relative strength chart shows a double top buy signal (e.g. RS Buy or Positive Relative Strength), it suggests the stock is likely to outperform the market for the foreseeable future. Conversely, whenever the relative strength chart gives a double bottom sell signal (e.g. RS Sell or Negative Relative Strength) it suggests the stock will under-perform the market. Relative strength signals tend to last roughly 18 to 24 months on average. Consequently, changes from buy signals to sell signals (and vice versa) are important to be aware of as they are longer-term implications of a stock's likely performance versus the indices. Using the Point & Figure chart along with the relative strength chart will allow you to better ascertain risk-reward and other trade management tools, but we always want to over-weight our portfolios toward those stocks that are on RS buy signals, giving us the best chance of outperforming the broader market.
In the Optionable Universe, this week we saw 12 relative strength buy signals compared to 28 last week. On the sell side, there were 16 relative strength sell signals compared to 35 last week.
| Symbol | Company | Sector | Price | RS vs Market Signal | RS vs Market Column | RS vs Peer Signal | RS vs Peer Column | Tech Attrib |
|---|---|---|---|---|---|---|---|---|
| BELFB | Bel Fuse Inc - CL B | Industrial Goods & Svcs | 12.180 | Buy | X | Sell | X | 4 |
| GIL | Gildan Activewear | Cyclical Goods and Services | 20.260 | Buy | X | Buy | X | 4 |
| GLNG | Golar LNG Ltd | Industrial Goods & Svcs | 10.320 | Buy | X | Buy | X | 4 |
| HVT | Haverty Furniture Companies, Inc. | Retail | 20.030 | Buy | X | Sell | X | 4 |
| AOSL | Alpha & Omega Semiconductor Ltd. | Semiconductors | 13.790 | Buy | X | Sell | X | 4 |
| NGS | Natural Gas Services Group | Oil Drilling, Equipment Svcs | 8.240 | Buy | X | Sell | X | 3 |
| PRAA | Portfolio Recovery Associates, Inc. | Financial Services | 44.480 | Buy | X | Buy | X | 5 |
| NOA | North American Energy Partners, Inc. | Oil Drilling, Equipment Svcs | 7.730 | Buy | X | Buy | X | 4 |
| CBMG | Cellular Biomedicine Group, Inc | Biotechnology | 18.390 | Buy | X | Buy | X | 5 |
| GCP | GCP Applied Technologies Inc | Chemicals | 26.850 | Buy | X | Buy | X | 5 |
| REDU | RISE Education Cayman Ltd Sponsored ADR | Retail | 7.450 | Buy | X | Buy | X | 5 |
| KRO.TR | Kronos Worldwide, Inc. TR | Chemicals | 13.495 | Buy | X | Buy | X | 5 |
| Symbol | Company | Sector | Price | RS vs Market Signal | RS vs Market Column | RS vs Peer Signal | RS vs Peer Column | Tech Attrib |
|---|---|---|---|---|---|---|---|---|
| FLIR | Flir Systems Inc | Industrial Goods & Svcs | 37.605 | Sell | O | Sell | O | 0 |
| MDP | Meredith Corporation | Media | 13.130 | Sell | O | Sell | O | 0 |
| MRLN | Marlin Business Services Inc. | Industrial Goods & Svcs | 6.940 | Sell | O | Buy | O | 1 |
| NI | Nisource, Inc. | Electric Utilities | 23.580 | Sell | O | Sell | O | 1 |
| STRA | Strategic Education Inc | Noncyclical Goods and Svcs | 113.560 | Sell | O | Sell | O | 0 |
| SFUN | Fang Holdings Ltd | Technology Services | 12.115 | Sell | O | Sell | O | 0 |
| NYCB | New York Community Bancorp, Inc. | Banks | 9.620 | Sell | O | Buy | O | 1 |
| PTCT | PTC Therapeutics Inc | Biotechnology | 49.130 | Sell | O | Buy | O | 1 |
| CTSO | Cytosorbents Corp. | Biotechnology | 8.900 | Sell | O | Sell | O | 1 |
| TRHC | Tabula Rasa Healthcare Inc | Software | 47.740 | Sell | O | Sell | O | 0 |
| DCPH | Deciphera Pharmaceuticals, Inc. | Biotechnology | 44.610 | Sell | O | Sell | O | 0 |
| OXY.TR | Occidental Petroleum Corporation TR | Oil Companies Secondary | 16.209 | Sell | O | Buy | O | 1 |
| LX | Lexinfintech Holdings Ltd. Sponsored ADR Class A | Financial Services | 8.180 | Sell | O | Buy | O | 1 |
| PAYS | Paysign, Inc. | Financial Services | 6.910 | Sell | O | Sell | O | 0 |
| HRC.TR | Hill-Rom Holdings, Inc. TR | Medical Products | 93.399 | Sell | O | Sell | O | 1 |
| NYCB.TR | New York Community Bancorp, Inc. TR | Banks | 10.243 | Sell | O | Buy | O | 2 |
| Symbol | Company | Sector | Current Price | Action Price | Target | Stop | Notes |
|---|---|---|---|---|---|---|---|
| NOW | Servicenow Inc | Software | $437.58 | low 440s to upper 460s | $588 | $344 | 4 for 5'er, 8 consec buy signals, pullback from AT high, LT makret RS buy signal |
| PII | Polaris Inc. | Leisure | $103.90 | low $100s to mid $110s | $138 | $84 | 5 for 5'er, one box from 5th consec buy signal, pos weekly mom flip, 2 mons pos month momentum, 2.36% yield |
| NRG | NRG Energy, Inc. | Utilities/Electricity | $36.09 | mid to upper 30s | $49 | $27 | 5 for 5'er, LT market RS buy signal, consec buy signals, pos mon and weekly momentum, 3.58% yield |
| CTAS | Cintas Corporation | Textiles/Apparel | $318.77 | low 300s to mid 330s | $400 | $252 | 5 for 5'er, top 25% of favored DWATEXT sector, pos mon & weekly mom, LT market/peer RS buy signals, up against ATH. |
| WMB | Williams Companies Inc. | Gas Utilities | $21.80 | 20 - 22 | 26.5 | 17 | 4 for 5'er, top 10% of GUTI sector matrix, 7.7% yield, pot. covered write |
| DXCM | Dexcom Inc. | Healthcare | $437.22 | 410s to 470s | 488 | 360 | 5 for 5'er, pullback from AT high, consec buy signals, LT market RS buy signal, top 1/3 of DWAHEAL |
| EBAY | eBay Inc. | Internet | $57.03 | mid-to-upper 50s | 100 | 46 | 5 for 5'er, top third of favored INET sector matrix, LT pos mkt RS, pullback from ATH |
| NKE | NIKE, Inc. | Textiles/Apparel | $106.97 | hi 90s - mid 100s | 112 | 89 | 4 for 5'er, top half of TEXT sector matrix, LT pos mkt RS, big base breakout to new ATH |
| DECK | Deckers Outdoor Corporation | Textiles/Apparel | $210.83 | low 200s to mid 230s | 284 | 178 | 5 for 5'er, pullback from ATH, consec buy signals, pos mon mom, top 10% of DWATEXT |
| PLD | ProLogis | Real Estate | $103.65 | hi 90s - mid 100s | 116 | 87 | 5 for 5'er, top third of REAL sector matrix, spread triple top, pos monthly mom flip, 2.2% yield |
| Symbol | Company | Sector | Current Price | Action Price | Target | Stop | Notes |
|---|---|---|---|---|---|---|---|
| THS | TreeHouse Foods, Inc. | Food Beverages/Soap | $42.66 | low to mid 40s | 36 | 53 | 0 for 5'er, consec sell signals, LT market RS sell signal, bottom quartile of DWAFOOD |
| Symbol | Company | Sector | Current Price | Action Price | Target | Stop | Notes |
|---|---|---|---|---|---|---|---|
| MS | Morgan Stanley | Wall Street | $50.92 | hi 40s - low 50s | 70 | 43 | OK to add or maintain exposure here. Abide by $43 stop. |
| Comment | |||||||
|---|---|---|---|---|---|---|---|
|
|
|||||||
PLD ProLogis R ($101.74) - Real Estate - PLD is a 5 for 5'er that ranks in the top third of the real estate matrix PLD currently sits at an all-time high on it's default chart, after breaking a spread triple top and taking out resistance dating back February in last month's trading. Meanwhile, a recent flip to positive monthly momentum is positive sign of PLD's potential for additional upside. PLD also carries a 2.2% yield. Long exposure may be added in the upper $90s to mid $100s and we will set our initial stop at $87 which would take out two levels of support on PLD's default chart. We will use the bullish price objective, $116, as our target price.
| 20 | |||||||||||||||||||||||||||||||||||||||||||||||||||||
| 106.00 | X | 106.00 | |||||||||||||||||||||||||||||||||||||||||||||||||||
| 104.00 | X | 104.00 | |||||||||||||||||||||||||||||||||||||||||||||||||||
| 102.00 | X | 102.00 | |||||||||||||||||||||||||||||||||||||||||||||||||||
| 100.00 | • | X | 100.00 | ||||||||||||||||||||||||||||||||||||||||||||||||||
| 99.00 | X | • | X | 99.00 | |||||||||||||||||||||||||||||||||||||||||||||||||
| 98.00 | X | O | • | X | X | X | 98.00 | ||||||||||||||||||||||||||||||||||||||||||||||
| 97.00 | X | O | • | X | X | O | X | O | X | X | Mid | 97.00 | |||||||||||||||||||||||||||||||||||||||||
| 96.00 | X | X | O | • | X | O | X | O | X | O | X | O | X | 96.00 | |||||||||||||||||||||||||||||||||||||||
| 95.00 | X | O | X | O | • | X | O | X | O | X | X | O | 7 | O | X | 95.00 | |||||||||||||||||||||||||||||||||||||
| 94.00 | X | O | X | O | X | • | X | 6 | O | X | O | X | O | X | O | X | O | X | 94.00 | ||||||||||||||||||||||||||||||||||
| 93.00 | X | O | X | O | X | O | • | X | O | X | O | O | X | O | X | O | X | X | O | 93.00 | |||||||||||||||||||||||||||||||||
| 92.00 | X | X | X | 2 | O | X | O | • | X | X | O | X | O | X | O | X | O | X | O | X | 92.00 | ||||||||||||||||||||||||||||||||
| 91.00 | X | O | X | O | X | O | X | O | • | X | O | X | O | X | O | O | O | X | O | X | 91.00 | ||||||||||||||||||||||||||||||||
| 90.00 | X | O | X | O | 1 | O | X | O | • | X | O | X | X | X | O | X | X | O | O | X | 90.00 | ||||||||||||||||||||||||||||||||
| 89.00 | X | O | B | C | X | O | X | O | • | X | O | X | O | X | O | X | O | X | O | X | O | X | 89.00 | ||||||||||||||||||||||||||||||
| 88.00 | X | O | X | O | X | O | X | O | • | X | O | X | O | X | O | X | O | X | O | X | O | • | 88.00 | ||||||||||||||||||||||||||||||
| 87.00 | A | O | X | O | O | X | O | • | X | O | X | O | X | O | O | X | O | X | • | 87.00 | |||||||||||||||||||||||||||||||||
| 86.00 | X | O | O | X | O | X | X | O | X | O | X | 5 | O | X | • | 86.00 | |||||||||||||||||||||||||||||||||||||
| 85.00 | 9 | X | O | X | O | X | O | X | O | O | X | O | X | • | 85.00 | ||||||||||||||||||||||||||||||||||||||
| 84.00 | X | O | X | O | 3 | O | X | O | X | O | O | X | • | 84.00 | |||||||||||||||||||||||||||||||||||||||
| 83.00 | X | X | X | O | X | O | X | O | X | X | O | X | O | X | • | 83.00 | |||||||||||||||||||||||||||||||||||||
| 82.00 | X | X | O | X | O | X | O | O | X | O | X | O | X | O | X | O | X | • | Bot | 82.00 | |||||||||||||||||||||||||||||||||
| 81.00 | X | O | 7 | O | X | O | X | O | O | X | O | X | O | O | • | 81.00 | |||||||||||||||||||||||||||||||||||||
| 80.00 | X | O | X | O | 8 | X | O | X | O | X | • | 80.00 | |||||||||||||||||||||||||||||||||||||||||
| 79.00 | X | O | X | O | X | O | X | O | X | • | 79.00 | ||||||||||||||||||||||||||||||||||||||||||
| 78.00 | X | O | O | O | X | X | O | X | • | 78.00 | |||||||||||||||||||||||||||||||||||||||||||
| 77.00 | X | O | X | O | X | O | X | • | 77.00 | ||||||||||||||||||||||||||||||||||||||||||||
| 76.00 | 6 | • | O | X | O | X | O | X | X | • | 76.00 | ||||||||||||||||||||||||||||||||||||||||||
| 75.00 | X | • | O | X | O | X | 4 | X | O | X | • | 75.00 | |||||||||||||||||||||||||||||||||||||||||
| 74.00 | X | • | O | X | O | X | O | X | O | X | • | 74.00 | |||||||||||||||||||||||||||||||||||||||||
| 73.00 | • | O | X | O | X | X | O | X | O | X | • | 73.00 | |||||||||||||||||||||||||||||||||||||||||
| 72.00 | • | O | X | O | X | O | X | O | X | O | • | 72.00 | |||||||||||||||||||||||||||||||||||||||||
| 71.00 | • | O | X | O | X | O | X | O | X | • | 71.00 | ||||||||||||||||||||||||||||||||||||||||||
| 70.00 | • | O | X | O | X | O | X | O | X | • | 70.00 | ||||||||||||||||||||||||||||||||||||||||||
| 69.00 | • | O | X | O | X | O | X | O | • | 69.00 | |||||||||||||||||||||||||||||||||||||||||||
| 68.00 | • | O | X | O | X | O | X | • | 68.00 | ||||||||||||||||||||||||||||||||||||||||||||
| 67.00 | • | O | X | O | X | O | X | • | 67.00 | ||||||||||||||||||||||||||||||||||||||||||||
| 66.00 | • | O | X | O | X | O | X | • | 66.00 | ||||||||||||||||||||||||||||||||||||||||||||
| 65.00 | • | O | X | O | O | X | • | 65.00 | |||||||||||||||||||||||||||||||||||||||||||||
| 64.00 | • | O | X | O | X | • | 64.00 | ||||||||||||||||||||||||||||||||||||||||||||||
| 63.00 | • | O | O | X | • | 63.00 | |||||||||||||||||||||||||||||||||||||||||||||||
| 62.00 | • | O | X | • | 62.00 | ||||||||||||||||||||||||||||||||||||||||||||||||
| 61.00 | • | O | X | • | 61.00 | ||||||||||||||||||||||||||||||||||||||||||||||||
| 60.00 | • | O | • | 60.00 | |||||||||||||||||||||||||||||||||||||||||||||||||
| 20 |
| A Agilent Technologies, Inc ($97.91) - Electronics - After forming a double top at $99, shares of A moved to a sell signal with today’s market action. This sets the chart up for a potential shakeout pattern. From here, the action point of the shakeout would trigger with a reversal up into Xs and the shakeout would complete with a triple top breakout at $100. A is a perfect 5 for 5’er within the favored electronics sector. From here, further support sits at $94. |
| ASND Ascendis Pharma A/S ($147.00) - Biomedics/Genetics - Shares of ASND moved higher Wednesday to break a triple top at $150. This 5 for 5'er moved back to a positive trend in April and has been on an RS buy signal against the market since early-2017. Weekly and monthly momentum also recently flipped positive, suggesting the potential for further upside from here. Initial support may be found at $140, which is also the current location of the bullish support line. Note that earnings are expected on 8/27. |
| CHD Church & Dwight Company ($96.47) - Household Goods - CHD advanced Wednesday to break a triple top at $96, marking a seventh consecutive buy signal and a new all-time high. This 5 for 5'er moved to a positive trend in April and ranks in the top third of the favored household goods sector RS matrix. The stock has also been on an RS buy signal against the market since late-2000. The weight of the technical evidence is positive, however, CHD has entered heavily overbought territory so those looking to add exposure would be best served to wait for a pullback or normalization of the trading band. Initial support can be found at $93, with further support offered at $92. |
| FND Floor & Decor Holdings Inc ($72.27) - Retailing - FND moved higher Wednesday to complete a shakeout pattern with a triple top break at $72. which also marked a new all-time high. This 5 for 5'er moved to a positive trend in May and ranks in the top quartile of the favored retailing sector RS matrix. The technical picture is strong and continues to improve, however, the recent movement has led FND to an intraday weekly overbought/oversold reading north of 80% so those looking to add exposure would be best served to wait for a pullback or normalization of the trading band. Initial support can be found at $65. |
| FSLR First Solar, Inc. ($76.20) - Semiconductors - FSLR completed a bullish triangle pattern with a double top breakout at $77. This stock is a solid 4 for 5’er within the favored semiconductors sector that ranks 2nd out of 64 names in the sector stock matrix. From here, initial support sits at $73, while FSLR faces resistance at $78. |
| NTGR NETGEAR, Inc. ($34.12) - Computers - Shares of NTGR advanced higher on Wednesday, breaking a double top at $34 to give a fourth consecutive buy signal. The 3 for 5'er ranks in the top quartile of the favored computers stock sector matrix and reentered a positive trend just last month, demonstrating favorable relative and absolute strength, respectively. Furthermore, weekly and monthly momentum are now both positive, adding to the favorable technical picture. The weight of the evidence is positive; however, those looking to initiate new long exposure may best wait for a pullback or price normalization as NTGR is approaching heavily overbought territory. Additional bullish confirmation would come with a move past current resistance around $34 while initial support is offered at $29. |
| OKTA Okta Inc ($205.78) - Software - OKTA returned to a buy signal on Wednesday at $208. This stock is a perfect 5 for 5’er within the favored software sector that ranks in the top half of the sector stock matrix. From here, initial support sits at $196 while OKTA faces resistance at $224. Earnings are expected on 8/27. |
| OMI Owens & Minor Incorporated ($17.11) - Healthcare - OMI broke a double top at $17.50, marking a new 52 week high in addition to the stock’s fifth consecutive buy signal. OMI is a perfect 5 for 5’er within the favored healthcare sector that moved back into a positive trend in late July. From here, initial support sits at $13. |
| RCL Royal Caribbean Cruises Ltd. ($61.54) - Leisure - RCL broke a double top at $63 before moving higher to $64 on Wednesday. This marks the second consecutive buy signal for the stock, which just moved back into a positive trend last week. Monthly momentum just flipped positive, suggesting the potential for higher prices and RCL has 3 out of 5 attributes in its favor. Demand is in control. From here, support sits at $56 with resistance at $66. Note RCL offers a yield of 5.17%. |
| WMS Advanced Drainage Systems Inc. ($59.47) - Machinery and Tools - WMS broke a double top at $60 before moving higher to $61. As a result, WMS is now trading at new all-time highs. The chart has given three consecutive buy signals, confirming that demand is in control. WMS is a perfect 5 for 5’er within the machinery and tools sector that has experienced three weeks of positive weekly momentum. Initial support sits at $56. |
| Name | Option Symbol | Action | Stop Loss |
|---|---|---|---|
| Garmin Ltd. - $103.99 | GRMN2016J97.5 | Buy the October 97.50 calls at 8.50 | 94.00 |
| Name | Option | Action |
|---|---|---|
| Home Depot, Inc. ( HD) | Sep. 250.00 Calls | Stopped at 34.05 (CP: 33.00) |
| Applied Materials, Inc. ( AMAT) | Oct. 60.00 Calls | Initiate an option stop loss of 5.50 (CP: 7.50) |
| Carmax Group ( KMX) | Oct. 92.50 Calls | Stopped at 14.70 (CP: 14.10) |
| D.R. Horton, Inc. ( DHI) | Nov. 60.00 Calls | Raise the option stop loss to 13.70 (CP: 15.70) |
| Honeywell International, Inc. ( HON) | Dec. 145.00 Calls | Stopped at 17.70 (CP: 17.00) |
| Name | Option Symbol | Action | Stop Loss |
|---|---|---|---|
| Delta Air Lines Inc. - $27.67 | DAL2018L30 | Buy the December 30.00 puts at 5.40 | 34.00 |
| Name | Option | Action |
|---|---|---|
|
|
||
| Name | Option Sym. | Call to Sell | Call Price | Investment for 500 Shares | Annual Called Rtn. | Annual Static Rtn. | Downside Protection |
|---|---|---|---|---|---|---|---|
| Qorvo Inc. $132.61 | QRVO2020K135 | Nov. 135.00 | 10.20 | $61,843.30 | 31.70% | 27.84% | 6.62% |
| Name | Action |
|---|---|
| Wendy's Company (WEN) - 21.59 | Sell the November 22.00 Calls. |
| Lennar Corporation (LEN) - 77.17 | Sell the November 75.00 Calls. |
| Teradyne, Inc. (TER) - 91.23 | Sell the January 97.50 Calls. |
| eBay Inc. (EBAY) - 57.03 | Sell the January 60.00 Calls. |
| Discover Financial Services (DFS) - 50.94 | Sell the January 60.00 Calls. |
| PulteGroup, Inc. (PHM) - 46.61 | Sell the January 50.00 Calls. |
| Pennymac Mortgage Investment Trust (PMT) - 17.76 | Sell the January 20.00 Calls. |
| Electronic Arts Inc. (EA) - 142.58 | Sell the December 150.00 Calls. |
| Name | Covered Write |
|---|---|
|
|
|
Daily Equity & Market Analysis
Loading, Please Wait...
