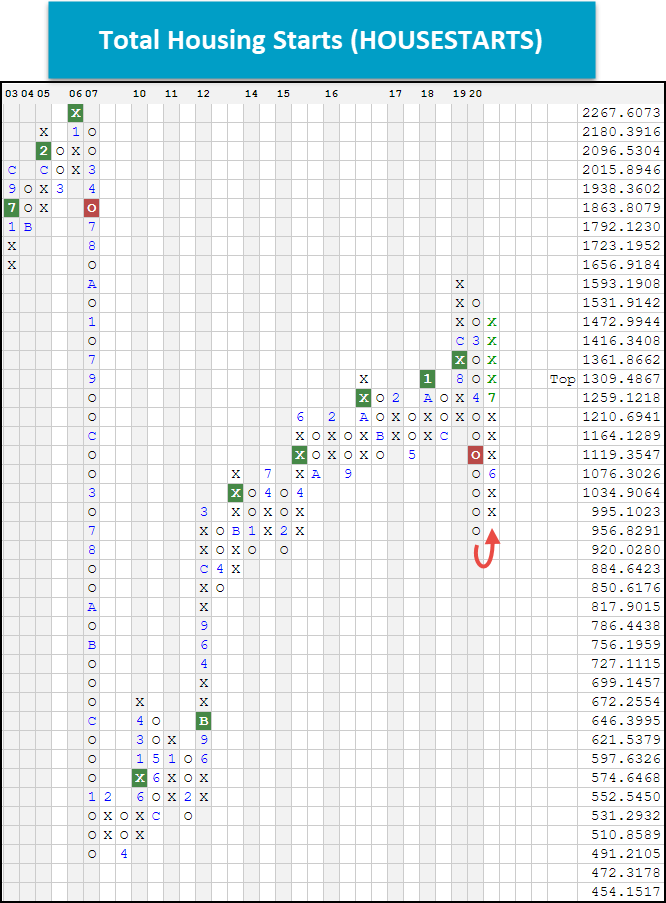
Earlier this week, the housing starts report came out showing that there was an increase of 22.6% in July compared to June. We take a look at this reading on the NDW Platform via the Total Housing Starts chart.
Monday Market Update Webinar Replay: Missed Monday's (8/17) webcast? Click the link(s) below for a recap:
As we have seen in this pandemic, numerous Americans have shifted work and school into their homes. Coupled with low interest rates, this has encouraged many people to re-enter the housing market searching for properties in the suburbs hoping for more space. Earlier this week, the housing starts report came out showing that there was an increase of 22.6% in July compared to June, signaling the rise in demand in the housing industry. These numbers are actually tracked on our research platform under the symbol HOUSESTARTS. It is an index that tracks total housing starts (measured in thousands) and is updated on a monthly basis as data becomes available. This chart has reversed into X’s in June and continued higher in July with the most recent number released, after having hit a multi-year low in April. It is worth noting that the home building activity is only about 7% away from the pre-coronavirus high, and the chart is about 10% away from giving a buy signal. If you are interested in getting notified on changes of this indicator, we recommend that you utilize the Set Alert function for column and signal changes. If you want to access other economic indicator charts that we track, they can be found under Security Selection > Chart Lists > Economic Indicator Charts (bottom left).

