Weekly DALI and US Equity Overview
The gap between fixed income and domestic equity continues to narrow as there are just five signals separating the two asset classes. Just this month alone, domestic equity has picked up 15 new buy signals while fixed income has lost three. As the market has recovered from the COVID-19 induced selloff, domestic equity is close to moving back to the top of the asset class ranks. The last time domestic equity was number one was from August 2016 until March 12, 2020.
With that said, we have seen another notable achievement come from the domestic equity Cash Percentile Rank. To briefly review, the Cash Percentile Rank is an indicator that measures the position of a cash proxy within a specific asset class matrix. To measure this, we have constructed comprehensive RS matrices specific to each of the asset classes and included a cash proxy as a member of each. We evaluate these matrices on a daily basis to see where cash resides and then display the results, using a traffic light of sorts, assigning the specific asset class either a green, yellow, or red light. If cash resides in the bottom third of the matrix, this suggests poor RS for cash versus others in the matrix, so it gets a green light. As cash rises in the matrix and moves into the middle third, the light turns yellow. This would suggest that members of the asset class are starting to falter and that we should move towards a more cautious or hedged approach to that asset class. Once cash ascends to the top third of the matrix, the light will turn red, indicating that on an aggregate basis, the asset class has weakened enough to merit cash as a better overall investment choice relative to that particular asset class. As mentioned above, the domestic equities asset class has just shifted to a green light for the Cash Percentile Rank, suggesting a more offensive posture toward domestic equities as an asset class.
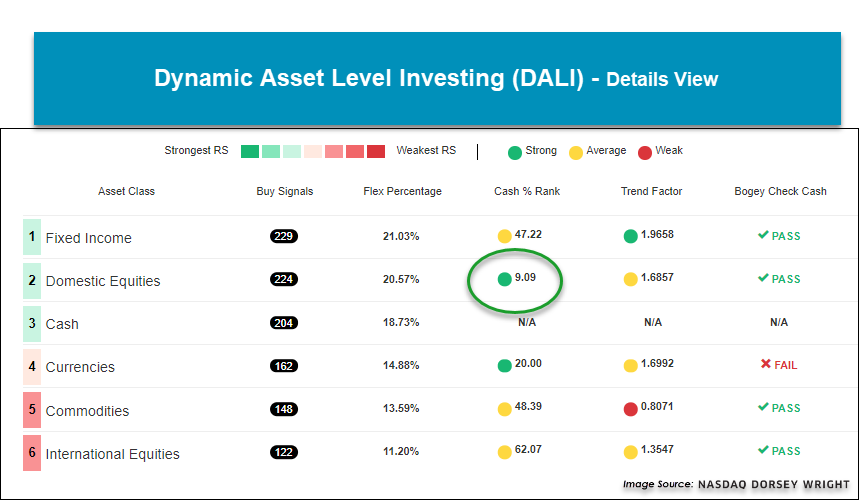
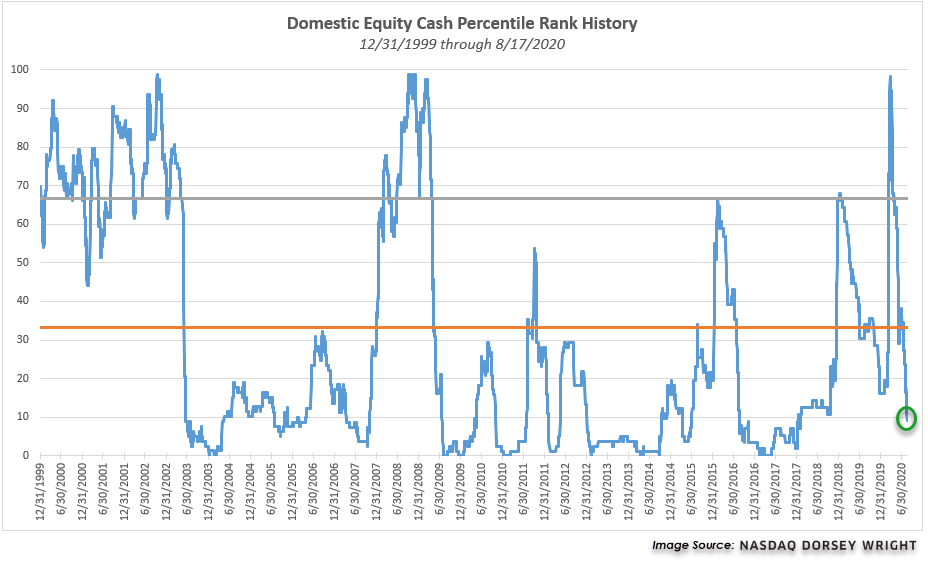
Just this week we have seen the Cash Percentile Rank for domestic equity fall below the 10% level with a current reading of 9.09%, which simply means that the cash proxy is stronger than just 9% of the domestic equity representatives in the relative strength matrix ranking. This reading comes after a high reading of 98% in the throws of the market selloff back in March. The reading ultimately fell below the 33% reading on July 14, 2020, officially turning the light from yellow to green for domestic equity. Similarly, the Cash Percentile Rank for domestic equity fell below 10% back in August 2016 and remained below 10% until January 2018. Time will tell how this trip below 10% plays out, but suffice it to say that the vast majority of the domestic equity market is ranking higher than cash these days.