
Most Requested Symbols

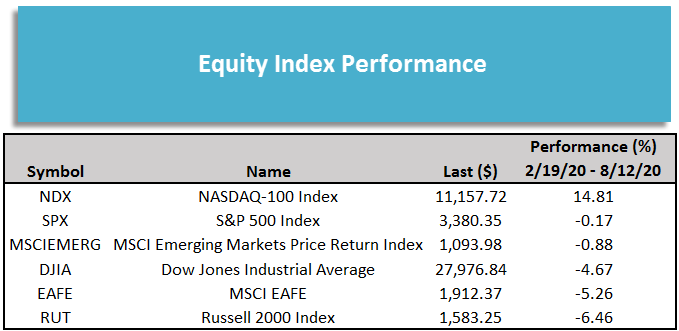
The S&P 500 has come within five points of its all-time high in two consecutive trading sessions this week. Today, we take a look at how several other areas of the market have fared since the S&P peaked back in February.
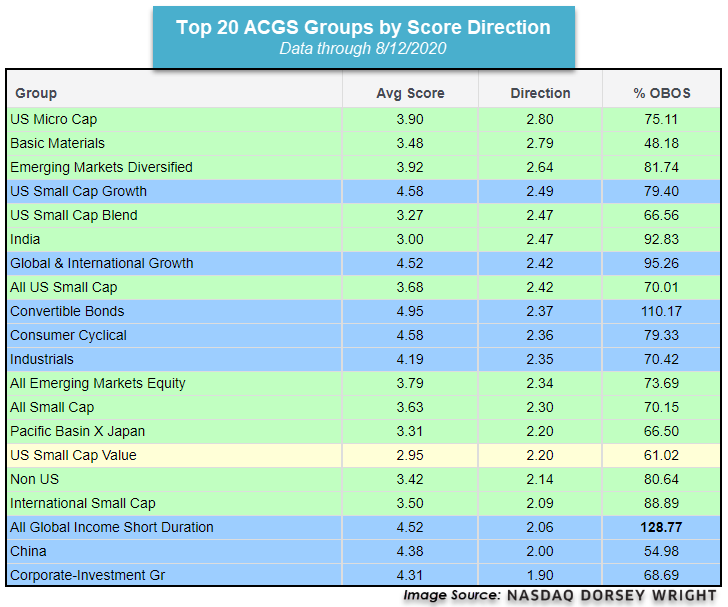
As the major domestic equity indices continue to either near or surpass new all-time highs, we have also continued to see a more risk-on approach from the two main percentile ranks found on the Asset Class Group Scores (ACGS) page.
The average distribution reading is 37.37% overbought.
Today's featured stock is Dexcom Inc. (DXCM)
BLD, CHDN, DOOR, GRMN, IIPR, NSTG, PENN, RH, TTEC, & YUMC
Call: eBay (EBAY), Put: Walgreens Boots Alliance (WBA), Covered Write: PulteGroup (PHM)
Beginners Series Webinar - Join us on Friday, August 14th, at 2 PM (ET) for our NDW Beginners Series Webinar. This week's topic is Utilizing the Models Page. Register here.
Upcoming KKM webinar: Join KKM on Wednesday, August 19th at 3 pm ET for a webinar focusing on models powered by Nasdaq Dorsey Wright methodology. The topic will be on "Dynamic & Active: Time to revisit two investment themes (powered by Nasdaq Dorsey Wright) for 2020", which is hosted by KKM and sponsored by Adhesion Wealth. Click here to register.
There is a variety of information available when examining the technical strength of a security through its point & figure chart page on the NDW research platform. One of the readings available under the Stock Data header is the Weekly Overbought/Oversold (OBOS) percentage, which depicts where the last closing price of the security sits relative to the 10-week trading band that is shown on the actual point & figure chart. This trading band, which is shown through the Top, Mid and Bot (Bottom), indications on the right-hand side of a trend chart, takes trading data throughout the past 10 weeks and essentially puts it on a distribution curve with the 10-week moving average being the “Mid” point on the chart. This distribution curve is then flipped vertically to align with the price data, with the “Top” of the trading band corresponding with a weekly OBOS reading of 100% (100% overbought), and the “Bot” corresponding with a reading of -100% (100% oversold). When examining a security to understand its recent price movement, this reading is best used for timing your trade. You may want to wait for a pullback to purchase a position that is in overbought territory (typically viewed at or above 70%), and may want to wait to sell a position that is heavily oversold (typically viewed at or below -70%) as it could have the potential for a near-term rally.
One of the recent additions to the NDW platform is the opportunity to view how the current intraday information may affect this OBOS reading. This can be viewed by clicking on the Weekly OBOS reading on the chart page, which brings up the historical view of the week-to-week change in the reading. At the top of this pop-up, you will now see what the OBOS reading would be if the price remained it the level depicted on the delayed quote found above the normal trend chart.
As an example below, we can see that today’s price movement for Cisco Systems CSCO resulted in a decline of about 11%, which led the stock to reverse down into a column of Os from $48 to $43. Prior to this move, CSCO had a weekly OBOS reading of 29%, and after this move, CSCO sits at an intraday weekly OBOS reading of -69% at the time of this writing, shifting it to near heavily oversold conditions.


In each of the last two trading days, the S&P 500 SPX has come within five points of reaching the all time of 3080 it established on 2/19 before the coronavirus induced sell off. If you had fallen into a Rip Van Winkle-style slumber for the last few months, looking at just the index levels you could think that that market had fallen asleep as well and remained virtually unchanged. The actuality of course is that the last few months have been anything but restful. While the S&P 500 is in the same place it was at the in February, other assets and segments of the market are in very different places than they were when the S&P last peaked back in February. With the S&P making headlines as flirts with hitting a new all-time high, we expect that you may be receiving calls from clients asking about their portfolios and where other parts of the market currently stand. With that in mind, today we wanted to give you some talking points about what has transpired in the between the S&P’s (almost) peaks.
While the S&P 500 is now roughly flat, down just -0.17% from 2/19 through 8/12, the story is very different for other equity indices. Technology stocks, especially large cap names, have been amongst the best performers during the pandemic as a result, the tech-heavy Nasdaq-100 NDX surpassed its previous all-time high in June and has made a series of new highs since then and barely missed making a new high watermark in Thursday’s trading, as a result NDX has gained 14.81% since SPX peaked on 2/19. The Dow DJIA, with its heavier exposure to financials and industrials, has lagged both the S&P and is down -4.67% over the same period (DJIA actually peaked slightly earlier as it hit an all-time on its P&F chart on 2/12). Small cap stocks have lagged large cap stocks as the Russell 2000 RUT is down -6.46% since 2/19, unlike the large cap indices which were trading at or near all-time highs in February, RUT still had not gotten back to the high it reached in August 2018.
Internationally, emerging market equities have led the way as the MSCI Emerging Markets Index MSCIEMERG is down just -0.88%, while the MSCI EAFE Index EAFE is -5.26%; it is worth noting that international markets hit peaks and troughs at various times, influenced heavily by the timeline of the coronavirus - Chinese equities for example, which make up a significant portion of MSCIEMERG peaked and bottomed before the US and most other markets.
While the major equity indices are, for the most part, within a few percentage points of where they were pre-pandemic, the same is not true for domestic interest rates. The US Treasury 10YR Yield Index TNX was already near historically low levels in mid-to-late February when it sat about 1.6%. TNX fell to a low of 0.4% on its P&F chart and currently sits at 0.675%, far below the lowest level it had ever hit prior to the COVID-19 and the Fed’s market intervention. The fall in rates has been a boon for many bondholders – the iShares Barclays 20+ Year Treasury Bond ETF TLT has gained 13.78% on a price return basis since the S&P peaked, trailing the Nasdaq-100 by only about 1%.
There has been wide dispersion within real assets – gold GC/ and silver SI/ have had historic rallies gaining 19.44% and 40.66% respectively, easily outperforming equities. Crude oil CL/ on the other hand is down -20.13% over the same period. While a 20% intra-year loss is certainly enough to grab your attention, like S&P, looking at just the performance of crude oil in over this period glosses over truly unprecedented volatility as the front month oil contract fell below zero.

As mentioned above regarding the Nasdaq-100, tech stocks, especially large caps, have been among the best performers this year; and each of the “FAANG” stocks, except Alphabet GOOG have posted double digit gains since the S&P’s peak in February. Aside from GOOG, which is down -1.31% over the period, the FAANGs’ gains have ranged from 11.70% (Microsoft MSFT) to 45.71% (Amazon AMZN). They have all been outdone by another big name, however, as Tesla TSLA is up just under 70%.

As the major domestic equity indices continue to either near or surpass new all-time highs, we have also continued to see a more risk-on approach from the two main percentile ranks found on the Asset Class Group Scores (ACGS) page. The Money Market Percentile Rank (MMPR) has fallen to 6.34%, marking its lowest level since the March decline. This reading climbed as high as 54.93% on March 23rd, before beginning to move lower as global equities marched higher. In looking at this indicator from a historical perspective, we can see that timeframes of major growth for domestic equities have largely coincided with MMPR readings south of 10%, where we sit today. As you may assume, the lower the better for this reading, and so it is certainly a positive sign for risk-oriented assets that we have seen a further dampening of this percentile rank.

On the flip side, we have also seen the US Equity Core Percentile Rank (CorePR) move higher, notching a recent level of 93.66%. This reading fell as low as 57.04% on March 12th and moved sharply higher soon thereafter to remain above 75% for the remainder of the market rally. While this recent movement is certainly a positive indication for the broad domestic equity market, this is not quite the highest level we have seen for the CorePR over the past few months, as the reading got to 96.48% at the beginning of June. Nonetheless, the continued recent ascent of the CorePR speaks to the strength of the large-cap space within the domestic equity market, as these assets have been the bellwether groups that have led the market higher through its recent rally. In looking at the historical perspective of this indicator, the reading is not a stranger to high field position, although we do not typically see it remain at levels above 90% for a prolonged period of time. This is not to say that a reading above 90% should be viewed as a bad omen, but rather that we typically see other, more focused areas climb above the core market during extended periods of growth, and so we should not be surprised if other areas begin to creep above the core.

While this has not happened yet, there is a multitude of areas that have that potential simply by nature of the 47 groups that currently possess group scores north of 4.00. This amount of names speaks to the breadth of strength we are seeing from a variety of areas within the markets, and not only those associated with equities, as many fixed income areas continue to score in relatively high field position.
In order to view those areas that have shown more recent improvement, the ACGS page can be sorted by score direction, which now reveals that US micro-cap has the highest score direction of any group on the page at a recent reading of 2.80 leading to a group score of 3.90. We covered this area in a more in-depth fashion in Tuesday’s ETF Spotlight but is still worth mentioning given its continued improvement. We also see international and global equities demonstrating recent strength from a directional perspective, with a focus on emerging market equities in the Asia region. Europe has also shown recent strength on the international side, with its score moving above the 3 score threshold for the first time since February at a recent reading of 3.03.

Average Level
37.37
| AGG | iShares US Core Bond ETF |
| USO | United States Oil Fund |
| DIA | SPDR Dow Jones Industrial Average ETF |
| DVY | iShares Dow Jones Select Dividend Index ETF |
| DX/Y | NYCE U.S.Dollar Index Spot |
| EFA | iShares MSCI EAFE ETF |
| FXE | Invesco CurrencyShares Euro Trust |
| GLD | SPDR Gold Trust |
| GSG | iShares S&P GSCI Commodity-Indexed Trust |
| HYG | iShares iBoxx $ High Yield Corporate Bond ETF |
| ICF | iShares Cohen & Steers Realty ETF |
| IEF | iShares Barclays 7-10 Yr. Tres. Bond ETF |
| LQD | iShares iBoxx $ Investment Grade Corp. Bond ETF |
| IJH | iShares S&P 400 MidCap Index Fund |
| ONEQ | Fidelity Nasdaq Composite Index Track |
| QQQ | Invesco QQQ Trust |
| RSP | Invesco S&P 500 Equal Weight ETF |
| IWM | iShares Russell 2000 Index ETF |
| SHY | iShares Barclays 1-3 Year Tres. Bond ETF |
| IJR | iShares S&P 600 SmallCap Index Fund |
| SPY | SPDR S&P 500 Index ETF Trust |
| TLT | iShares Barclays 20+ Year Treasury Bond ETF |
| GCC | WisdomTree Continuous Commodity Index Fund |
| VOOG | Vanguard S&P 500 Growth ETF |
| VOOV | Vanguard S&P 500 Value ETF |
| EEM | iShares MSCI Emerging Markets ETF |
| XLG | Invesco S&P 500 Top 50 ETF |
| Symbol | Company | Sector | Current Price | Action Price | Target | Stop | Notes |
|---|---|---|---|---|---|---|---|
| BLK | BlackRock, Inc. | Wall Street | $590.24 | mid 530s - low 600s | $680 | $448 | 4 for 5'er, pullback from ATH, consec buy signals, pos weekly & mon mom, 2.52% yield |
| SNPS | Synopsys Inc | Software | $194.34 | mid 190s to low 210s | 228 | 162 | 5 for 5'er, consec buy signals, pullback from ATH, pos mon mom, LT market RS buy signal Earnings 8/19 |
| MS | Morgan Stanley | Wall Street | $52.38 | hi 40s - low 50s | 70 | 43 | 5 for 5'er, top quartile of WALL sector matrix, LT pos mkt RS, 2.9% yield, good R-R |
| NOW | Servicenow Inc | Software | $427.13 | low 440s to upper 460s | $588 | $344 | 4 for 5'er, 8 consec buy signals, pullback from AT high, LT makret RS buy signal |
| PII | Polaris Inc. | Leisure | $107.16 | low $100s to mid $110s | $138 | $84 | 5 for 5'er, one box from 5th consec buy signal, pos weekly mom flip, 2 mons pos month momentum, 2.36% yield |
| NRG | NRG Energy, Inc. | Utilities/Electricity | $35.26 | mid to upper 30s | $49 | $27 | 5 for 5'er, LT market RS buy signal, consec buy signals, pos mon and weekly momentum, 3.58% yield |
| CTAS | Cintas Corporation | Textiles/Apparel | $319.89 | low 300s to mid 330s | $400 | $252 | 5 for 5'er, top 25% of favored DWATEXT sector, pos mon & weekly mom, LT market/peer RS buy signals, up against ATH. |
| WMB | Williams Companies Inc. | Gas Utilities | $21.61 | 20 - 22 | 26.5 | 17 | 4 for 5'er, top 10% of GUTI sector matrix, 7.7% yield, pot. covered write |
| SQ | Square Inc | Software | $139.02 | high $130s - low $140s | $156 | $116 | 5 for 5'er, #2 of 113 names in favored SOFT sector matrix, pullback from ATH, pot. covered write, |
| DXCM | Dexcom Inc. | Healthcare | $427.89 | 410s to 470s | 488 | 360 | 5 for 5'er, pullback from AT high, consec buy signals, LT market RS buy signal, top 1/3 of DWAHEAL |
| Symbol | Company | Sector | Current Price | Action Price | Target | Stop | Notes |
|---|---|---|---|---|---|---|---|
| THS | TreeHouse Foods, Inc. | Food Beverages/Soap | $43.30 | low to mid 40s | 36 | 53 | 0 for 5'er, consec sell signals, LT market RS sell signal, bottom quartile of DWAFOOD |
| Symbol | Company | Sector | Current Price | Action Price | Target | Stop | Notes |
|---|---|---|---|---|---|---|---|
| PAGS | PagSeguro Digital Ltd. Class A | Business Products | $39.14 | hi 30s - low 40s | 53 | 33 | See follow comment below. |
| Comment |
|---|
| SPTN SpartanNash Co. R ($20.23) - Retailing - SPTN hit our stop with today's session. We will close our position. |
| PAGS PagSeguro Digital Ltd. Class A R ($39.80) - Business Products - Okay to add new exposure here. We will maintain our $33 stop. |
DXCM Dexcom Inc. R ($435.11) - Healthcare - DXCM is a perfect 5 for 5’er that ranks in the top third of the favored healthcare sector RS matrix. In late March, DXCM moved back into a positive trend. After returning to a buy signal in June at $384, this stock has now given a total of four consecutive buy signals, confirming that demand is in control. After reaching a new all-time high of $456 this month, DXCM pulled back slightly to support at $408; however, with today’s market action, it has reversed back up into Xs to $432. Okay to initiate new long positions in the 410s to $470s. We will set our initial stop loss at $360 and will use DXCM’s bullish price objective of $488 as our near-term price target.
| 20 | ||||||||||||||||||||||||||||||||||||||||||||||||||||||
| 456.00 | X | 456.00 | ||||||||||||||||||||||||||||||||||||||||||||||||||||
| 448.00 | 8 | O | 448.00 | |||||||||||||||||||||||||||||||||||||||||||||||||||
| 440.00 | X | X | O | 440.00 | ||||||||||||||||||||||||||||||||||||||||||||||||||
| 432.00 | X | O | X | X | O | x | 432.00 | |||||||||||||||||||||||||||||||||||||||||||||||
| 424.00 | X | X | X | O | X | O | X | O | x | 424.00 | ||||||||||||||||||||||||||||||||||||||||||||
| 416.00 | X | O | X | O | 7 | O | X | O | X | O | x | 416.00 | ||||||||||||||||||||||||||||||||||||||||||
| 408.00 | X | O | X | O | X | X | O | X | O | O | Mid | 408.00 | ||||||||||||||||||||||||||||||||||||||||||
| 400.00 | X | O | O | X | O | X | O | X | 400.00 | |||||||||||||||||||||||||||||||||||||||||||||
| 396.00 | X | O | X | O | X | O | X | 396.00 | ||||||||||||||||||||||||||||||||||||||||||||||
| 392.00 | X | O | X | O | X | O | X | 392.00 | ||||||||||||||||||||||||||||||||||||||||||||||
| 388.00 | X | O | X | X | O | X | O | X | 388.00 | |||||||||||||||||||||||||||||||||||||||||||||
| 384.00 | X | O | X | O | X | O | X | O | 384.00 | |||||||||||||||||||||||||||||||||||||||||||||
| 380.00 | X | O | X | X | O | X | O | X | 380.00 | |||||||||||||||||||||||||||||||||||||||||||||
| 376.00 | X | O | X | 6 | O | X | O | X | O | 376.00 | ||||||||||||||||||||||||||||||||||||||||||||
| 372.00 | X | O | X | O | X | O | X | O | X | 372.00 | ||||||||||||||||||||||||||||||||||||||||||||
| 368.00 | X | O | X | O | X | O | X | O | X | 368.00 | ||||||||||||||||||||||||||||||||||||||||||||
| 364.00 | X | O | X | O | O | X | O | 364.00 | ||||||||||||||||||||||||||||||||||||||||||||||
| 360.00 | X | O | X | O | X | 360.00 | ||||||||||||||||||||||||||||||||||||||||||||||||
| 356.00 | X | O | X | O | X | 356.00 | ||||||||||||||||||||||||||||||||||||||||||||||||
| 352.00 | X | O | X | O | X | 352.00 | ||||||||||||||||||||||||||||||||||||||||||||||||
| 348.00 | X | X | O | X | O | X | 348.00 | |||||||||||||||||||||||||||||||||||||||||||||||
| 344.00 | X | X | O | X | O | X | O | X | 344.00 | |||||||||||||||||||||||||||||||||||||||||||||
| 340.00 | X | O | X | O | X | O | O | 340.00 | ||||||||||||||||||||||||||||||||||||||||||||||
| 336.00 | X | O | X | 5 | X | 336.00 | ||||||||||||||||||||||||||||||||||||||||||||||||
| 332.00 | X | O | X | O | 332.00 | |||||||||||||||||||||||||||||||||||||||||||||||||
| 328.00 | X | X | O | X | 328.00 | |||||||||||||||||||||||||||||||||||||||||||||||||
| 324.00 | X | O | X | O | X | 324.00 | ||||||||||||||||||||||||||||||||||||||||||||||||
| 320.00 | X | O | X | O | X | 320.00 | ||||||||||||||||||||||||||||||||||||||||||||||||
| 316.00 | X | O | X | O | 316.00 | |||||||||||||||||||||||||||||||||||||||||||||||||
| 312.00 | X | O | X | 312.00 | ||||||||||||||||||||||||||||||||||||||||||||||||||
| 308.00 | • | X | O | 308.00 | ||||||||||||||||||||||||||||||||||||||||||||||||||
| 304.00 | X | • | • | X | Bot | 304.00 | ||||||||||||||||||||||||||||||||||||||||||||||||
| 300.00 | X | O | X | • | X | • | 300.00 | |||||||||||||||||||||||||||||||||||||||||||||||
| 296.00 | X | O | X | O | • | X | • | 296.00 | ||||||||||||||||||||||||||||||||||||||||||||||
| 292.00 | X | O | X | O | • | • | X | • | 292.00 | |||||||||||||||||||||||||||||||||||||||||||||
| 288.00 | X | O | X | O | X | X | • | X | • | 288.00 | ||||||||||||||||||||||||||||||||||||||||||||
| 284.00 | X | O | X | O | X | O | X | O | • | X | • | 284.00 | ||||||||||||||||||||||||||||||||||||||||||
| 280.00 | X | O | X | O | 3 | O | X | O | X | • | X | X | X | • | 280.00 | |||||||||||||||||||||||||||||||||||||||
| 276.00 | X | O | O | X | O | O | X | O | • | X | O | X | O | X | • | 276.00 | ||||||||||||||||||||||||||||||||||||||
| 272.00 | X | O | X | O | X | O | • | X | O | X | O | X | • | 272.00 | ||||||||||||||||||||||||||||||||||||||||
| 268.00 | X | O | O | X | O | • | X | O | X | O | X | • | 268.00 | |||||||||||||||||||||||||||||||||||||||||
| 264.00 | X | O | X | O | • | X | O | X | O | X | • | 264.00 | ||||||||||||||||||||||||||||||||||||||||||
| 260.00 | X | O | O | • | X | 4 | X | O | X | • | 260.00 | |||||||||||||||||||||||||||||||||||||||||||
| 256.00 | X | O | X | • | • | X | O | X | O | X | • | 256.00 | ||||||||||||||||||||||||||||||||||||||||||
| 252.00 | X | O | X | O | X | • | X | O | O | • | 252.00 | |||||||||||||||||||||||||||||||||||||||||||
| 248.00 | 2 | O | X | O | X | O | X | • | 248.00 | |||||||||||||||||||||||||||||||||||||||||||||
| 244.00 | X | O | X | O | X | O | X | • | 244.00 | |||||||||||||||||||||||||||||||||||||||||||||
| 240.00 | X | X | X | O | X | O | X | O | • | 240.00 | ||||||||||||||||||||||||||||||||||||||||||||
| 236.00 | X | O | X | O | X | O | X | O | X | • | 236.00 | |||||||||||||||||||||||||||||||||||||||||||
| 232.00 | X | O | X | O | X | O | X | O | X | • | 232.00 | |||||||||||||||||||||||||||||||||||||||||||
| 228.00 | O | X | O | O | O | X | O | X | • | 228.00 | ||||||||||||||||||||||||||||||||||||||||||||
| 224.00 | O | 1 | O | X | O | X | X | • | 224.00 | |||||||||||||||||||||||||||||||||||||||||||||
| 220.00 | O | X | O | X | O | X | O | X | X | • | 220.00 | |||||||||||||||||||||||||||||||||||||||||||
| 216.00 | O | X | O | O | X | O | X | O | X | • | 216.00 | |||||||||||||||||||||||||||||||||||||||||||
| 212.00 | O | X | O | X | O | X | O | X | • | 212.00 | ||||||||||||||||||||||||||||||||||||||||||||
| 208.00 | O | X | O | X | O | X | O | X | • | 208.00 | ||||||||||||||||||||||||||||||||||||||||||||
| 204.00 | O | X | O | X | O | X | O | X | • | 204.00 | ||||||||||||||||||||||||||||||||||||||||||||
| 200.00 | O | O | X | O | X | O | X | • | 200.00 | |||||||||||||||||||||||||||||||||||||||||||||
| 198.00 | O | X | O | X | O | • | 198.00 | |||||||||||||||||||||||||||||||||||||||||||||||
| 196.00 | O | X | O | X | • | 196.00 | ||||||||||||||||||||||||||||||||||||||||||||||||
| 194.00 | O | X | O | X | • | 194.00 | ||||||||||||||||||||||||||||||||||||||||||||||||
| 192.00 | O | X | O | • | 192.00 | |||||||||||||||||||||||||||||||||||||||||||||||||
| 190.00 | O | X | • | 190.00 | ||||||||||||||||||||||||||||||||||||||||||||||||||
| 188.00 | O | X | • | 188.00 | ||||||||||||||||||||||||||||||||||||||||||||||||||
| 186.00 | • | O | X | • | 186.00 | |||||||||||||||||||||||||||||||||||||||||||||||||
| 184.00 | • | O | • | 184.00 | ||||||||||||||||||||||||||||||||||||||||||||||||||
| 20 |

| BLD Topbuild Corp. ($151.71) - Building - BLD broke a double top at $152 on Thursday, marking the stock’s fourth consecutive buy signal since July. BLD is now trading at new all-time highs with 5 positive attributes in its favor. Monthly momentum has been positive for two months, suggesting the potential for higher prices. From here, initial support sits at $144. |
| CHDN Churchill Downs Inc ($176.20) - Gaming - CHDN broke a double top at $176 on Thursday and is now trading at new all-time highs. Today’s breakout completes a bullish catapult pattern for this 4 for 5’er within the favored gaming sector. Monthly momeutm just flipped positive, suggesting the potential for higher prices. From here, inintial support sits at $168. |
| DOOR Masonite International Corp ($93.43) - Building - DOOR broke a double top at $94 on Thursday and is now trading at new all-time highs. This stock is a 4 for 5’er that moved back into a positive trend in May. Monthly momentum has been positive for two months, suggesting the potential for higher prices. From here, initial support sits at $90. |
| GRMN Garmin Ltd. ($103.64) - Electronics - GRMN broke a triple top at $104 on Thursday and is now testing resistance from February of this year. GRMN is a 5 for 5’er within the favored electronics sector that has maintained a long-term market RS buy signal since March 2019. From current levels, initial support sits at $98 with further support at $95. GRMN provides a yield of 2.4%. |
| IIPR Innovative Industrial Properties Inc ($119.86) - Real Estate - IIPR broke a double top at $120 on Thursday, marking the fifth consecutive buy signal on the chart for this perfect 5 for 5’er. IIPR is showing long-term strength versus the market, evidenced by its market RS buy signal that dates to April 2018. Additionally, monthly momentum has been positive for two months, while weekly momentum has been positive for three weeks. From here, initial support sits at $112. IIPR provides a yield of 3.72%. |
| NSTG Nanostring Technologies Inc. ($39.02) - Biomedics/Genetics - NSTG returned to a buy signal on Thursday with a double top breakout at $38 before breaking through resistance on its way to $39. As a result, NSTG is now trading at new all-time highs with 5 out of 5 attributes in its favor as its peer RS chart reversed up into Xs after yesterday's trading session. Monthly momentum just flipped positive, suggesting the potential for higher prices. From here, initial support sits at $33. |
| PENN Penn National Gaming Inc ($54.07) - Gaming - PENN broke a double top at $52 before moving higher to $54 on Thursday, marking the stock’s fourth consecutive buy signal in addition to a new all-time high. PENN is a perfect 5 for 5’er that ranks #1 in the gaming sector RS matrix, confirming the stock’s strength relative to its peers. Weekly momentum has been positive for two weeks, adding to the overall positive weight of the evidence. From here, initial support sits at $46. Note PENN is trading in heavily overbought territory here, so those looking to initiate new long positions may best be served on a pullback or upon normalization of the trading band. |
| RH RH ($320.68) - Retailing - RH broke a double top at $320, marking the stock’s sixth consecutive buy signal on the chart as well as a new all-time high. RH is a perfect 5 for 5’er as all of its trending and RS characteristics are positive here. Monthly momentum has been positive for two months, and RH ranks in the top decile of the favored retailing sector RS matrix. From here, initial support sits at $304. Note earnings are expected 9/8. |
| TTEC TTEC Holdings Inc ($58.75) - Business Products - TTEC broke a double top at $60 on Thursday and is now trading at new all-time highs. This stock is a perfect 5 for 5’er that ranks 6th out of 100 names in the favored business products sector. Additionally, weekly momentum has been positive for two weeks, while monthly momentum has been positive for three months. From here, initial support sits at $54. Note TTEC is heavily overbought at current levels. |
| YUMC Yum China Holdings Inc ($54.80) - Restaurants - YUMC is a 4 for 5’er within the restaurants sector that has four positive attributes in its favor. With Thursday’s market action, YUMC broke a fourth consecutive buy signal at $55, marking a new all-time high on the chart. Weekly momentum has been positive for two weeks, suggesting the potential for higher prices. From here, initial support sits at $40, YUMC’s bullish support line. |
| Name | Option Symbol | Action | Stop Loss |
|---|---|---|---|
| eBay Inc. - $56.28 | EBAY2115A50 | Buy the January 50.00 calls at 9.10 | 53.00 |
| Name | Option | Action |
|---|---|---|
| Home Depot, Inc. ( HD) | Sep. 250.00 Calls | Raise the option stop loss to 31.10 (CP: 33.10) |
| Cisco Systems, Inc. ( CSCO) | Sep. 40.00 Calls | Stopped at 43.00 (CP: 42.52) |
| Best Buy Co., Inc. ( BBY) | Oct. 85.00 Calls | Raise the option stop loss to 19.90 (CP: 21.90) |
| Cisco Systems, Inc. ( CSCO) | Oct. 45.00 Calls | Stopped at 43.00 (CP: 42.52) |
| D.R. Horton, Inc. ( DHI) | Nov. 60.00 Calls | Raise the option stop loss to 11.90 (CP: 13.90) |
| Name | Option Symbol | Action | Stop Loss |
|---|---|---|---|
| Walgreens Boots Alliance Inc. - $41.00 | WBA2115M42.5 | Buy the January 42.50 puts at 5.00 | 45.00 |
| Name | Option | Action |
|---|---|---|
| Baxter International Inc. (BAX) | Nov. 87.50 Puts | Stopped at 6.70 (CP: 6.20) |
| Name | Option Sym. | Call to Sell | Call Price | Investment for 500 Shares | Annual Called Rtn. | Annual Static Rtn. | Downside Protection |
|---|---|---|---|---|---|---|---|
| PulteGroup, Inc. $45.44 | PHM2115A50 | Jan. 50.00 | 3.10 | $21,453.10 | 36.43% | 14.35% | 5.74% |
| Name | Action |
|---|---|
| JD.COM INC (JD) - 62.90 | Sell the October 65.00 Calls. |
| Lennar Corporation (LEN) - 74.29 | Sell the November 75.00 Calls. |
| Teradyne, Inc. (TER) - 89.65 | Sell the January 97.50 Calls. |
| eBay Inc. (EBAY) - 55.49 | Sell the January 60.00 Calls. |
| Discover Financial Services (DFS) - 54.49 | Sell the January 60.00 Calls. |
| Name | Covered Write |
|---|---|
| NIKE, Inc. ( NKE - 105.22 ) | January 110.00 covered write. |
Daily Equity & Market Analysis
Loading, Please Wait...
