
The S&P 500 has come within five points of its all-time high in two consecutive trading sessions this week. Today, we take a look at how several other areas of the market have fared since the S&P peaked back in February.
In each of the last two trading days, the S&P 500 SPX has come within five points of reaching the all time of 3080 it established on 2/19 before the coronavirus induced sell off. If you had fallen into a Rip Van Winkle-style slumber for the last few months, looking at just the index levels you could think that that market had fallen asleep as well and remained virtually unchanged. The actuality of course is that the last few months have been anything but restful. While the S&P 500 is in the same place it was at the in February, other assets and segments of the market are in very different places than they were when the S&P last peaked back in February. With the S&P making headlines as flirts with hitting a new all-time high, we expect that you may be receiving calls from clients asking about their portfolios and where other parts of the market currently stand. With that in mind, today we wanted to give you some talking points about what has transpired in the between the S&P’s (almost) peaks.
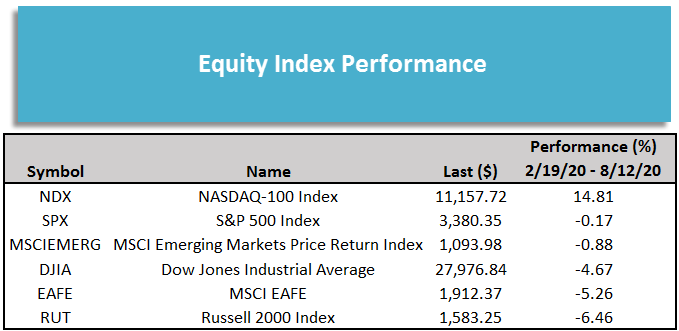
While the S&P 500 is now roughly flat, down just -0.17% from 2/19 through 8/12, the story is very different for other equity indices. Technology stocks, especially large cap names, have been amongst the best performers during the pandemic as a result, the tech-heavy Nasdaq-100 NDX surpassed its previous all-time high in June and has made a series of new highs since then and barely missed making a new high watermark in Thursday’s trading, as a result NDX has gained 14.81% since SPX peaked on 2/19. The Dow DJIA, with its heavier exposure to financials and industrials, has lagged both the S&P and is down -4.67% over the same period (DJIA actually peaked slightly earlier as it hit an all-time on its P&F chart on 2/12). Small cap stocks have lagged large cap stocks as the Russell 2000 RUT is down -6.46% since 2/19, unlike the large cap indices which were trading at or near all-time highs in February, RUT still had not gotten back to the high it reached in August 2018.
Internationally, emerging market equities have led the way as the MSCI Emerging Markets Index MSCIEMERG is down just -0.88%, while the MSCI EAFE Index EAFE is -5.26%; it is worth noting that international markets hit peaks and troughs at various times, influenced heavily by the timeline of the coronavirus - Chinese equities for example, which make up a significant portion of MSCIEMERG peaked and bottomed before the US and most other markets.
While the major equity indices are, for the most part, within a few percentage points of where they were pre-pandemic, the same is not true for domestic interest rates. The US Treasury 10YR Yield Index TNX was already near historically low levels in mid-to-late February when it sat about 1.6%. TNX fell to a low of 0.4% on its P&F chart and currently sits at 0.675%, far below the lowest level it had ever hit prior to the COVID-19 and the Fed’s market intervention. The fall in rates has been a boon for many bondholders – the iShares Barclays 20+ Year Treasury Bond ETF TLT has gained 13.78% on a price return basis since the S&P peaked, trailing the Nasdaq-100 by only about 1%.
There has been wide dispersion within real assets – gold GC/ and silver SI/ have had historic rallies gaining 19.44% and 40.66% respectively, easily outperforming equities. Crude oil CL/ on the other hand is down -20.13% over the same period. While a 20% intra-year loss is certainly enough to grab your attention, like S&P, looking at just the performance of crude oil in over this period glosses over truly unprecedented volatility as the front month oil contract fell below zero.

As mentioned above regarding the Nasdaq-100, tech stocks, especially large caps, have been among the best performers this year; and each of the “FAANG” stocks, except Alphabet GOOG have posted double digit gains since the S&P’s peak in February. Aside from GOOG, which is down -1.31% over the period, the FAANGs’ gains have ranged from 11.70% (Microsoft MSFT) to 45.71% (Amazon AMZN). They have all been outdone by another big name, however, as Tesla TSLA is up just under 70%.

