As the major domestic equity indices continue to either near or surpass new all-time highs, we have also continued to see a more risk-on approach from the two main percentile ranks found on the Asset Class Group Scores (ACGS) page.
As the major domestic equity indices continue to either near or surpass new all-time highs, we have also continued to see a more risk-on approach from the two main percentile ranks found on the Asset Class Group Scores (ACGS) page. The Money Market Percentile Rank (MMPR) has fallen to 6.34%, marking its lowest level since the March decline. This reading climbed as high as 54.93% on March 23rd, before beginning to move lower as global equities marched higher. In looking at this indicator from a historical perspective, we can see that timeframes of major growth for domestic equities have largely coincided with MMPR readings south of 10%, where we sit today. As you may assume, the lower the better for this reading, and so it is certainly a positive sign for risk-oriented assets that we have seen a further dampening of this percentile rank.

On the flip side, we have also seen the US Equity Core Percentile Rank (CorePR) move higher, notching a recent level of 93.66%. This reading fell as low as 57.04% on March 12th and moved sharply higher soon thereafter to remain above 75% for the remainder of the market rally. While this recent movement is certainly a positive indication for the broad domestic equity market, this is not quite the highest level we have seen for the CorePR over the past few months, as the reading got to 96.48% at the beginning of June. Nonetheless, the continued recent ascent of the CorePR speaks to the strength of the large-cap space within the domestic equity market, as these assets have been the bellwether groups that have led the market higher through its recent rally. In looking at the historical perspective of this indicator, the reading is not a stranger to high field position, although we do not typically see it remain at levels above 90% for a prolonged period of time. This is not to say that a reading above 90% should be viewed as a bad omen, but rather that we typically see other, more focused areas climb above the core market during extended periods of growth, and so we should not be surprised if other areas begin to creep above the core.

While this has not happened yet, there is a multitude of areas that have that potential simply by nature of the 47 groups that currently possess group scores north of 4.00. This amount of names speaks to the breadth of strength we are seeing from a variety of areas within the markets, and not only those associated with equities, as many fixed income areas continue to score in relatively high field position.
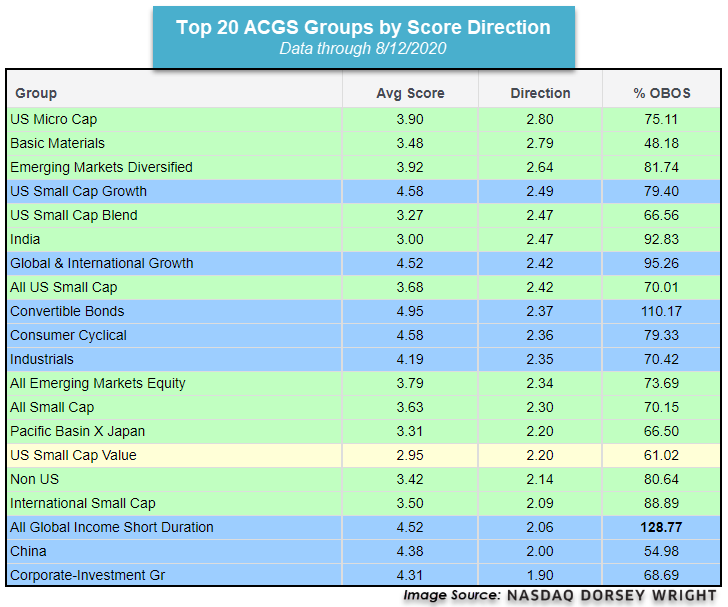
In order to view those areas that have shown more recent improvement, the ACGS page can be sorted by score direction, which now reveals that US micro-cap has the highest score direction of any group on the page at a recent reading of 2.80 leading to a group score of 3.90. We covered this area in a more in-depth fashion in Tuesday’s ETF Spotlight but is still worth mentioning given its continued improvement. We also see international and global equities demonstrating recent strength from a directional perspective, with a focus on emerging market equities in the Asia region. Europe has also shown recent strength on the international side, with its score moving above the 3 score threshold for the first time since February at a recent reading of 3.03.