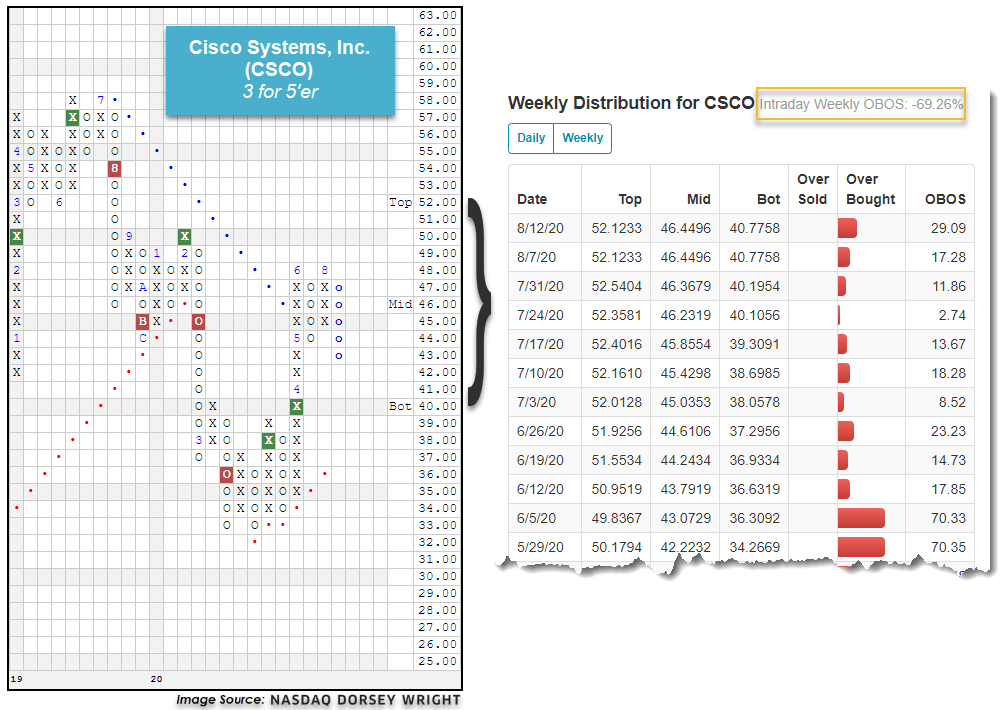
One of the recent additions to the NDW platform is the opportunity to view how the current intraday information may affect this OBOS reading.
Beginners Series Webinar - Join us on Friday, August 14th, at 2 PM (ET) for our NDW Beginners Series Webinar. This week's topic is Utilizing the Models Page. Register here.
Upcoming KKM webinar: Join KKM on Wednesday, August 19th at 3 pm ET for a webinar focusing on models powered by Nasdaq Dorsey Wright methodology. The topic will be on "Dynamic & Active: Time to revisit two investment themes (powered by Nasdaq Dorsey Wright) for 2020", which is hosted by KKM and sponsored by Adhesion Wealth. Click here to register.
There is a variety of information available when examining the technical strength of a security through its point & figure chart page on the NDW research platform. One of the readings available under the Stock Data header is the Weekly Overbought/Oversold (OBOS) percentage, which depicts where the last closing price of the security sits relative to the 10-week trading band that is shown on the actual point & figure chart. This trading band, which is shown through the Top, Mid and Bot (Bottom), indications on the right-hand side of a trend chart, takes trading data throughout the past 10 weeks and essentially puts it on a distribution curve with the 10-week moving average being the “Mid” point on the chart. This distribution curve is then flipped vertically to align with the price data, with the “Top” of the trading band corresponding with a weekly OBOS reading of 100% (100% overbought), and the “Bot” corresponding with a reading of -100% (100% oversold). When examining a security to understand its recent price movement, this reading is best used for timing your trade. You may want to wait for a pullback to purchase a position that is in overbought territory (typically viewed at or above 70%), and may want to wait to sell a position that is heavily oversold (typically viewed at or below -70%) as it could have the potential for a near-term rally.
One of the recent additions to the NDW platform is the opportunity to view how the current intraday information may affect this OBOS reading. This can be viewed by clicking on the Weekly OBOS reading on the chart page, which brings up the historical view of the week-to-week change in the reading. At the top of this pop-up, you will now see what the OBOS reading would be if the price remained it the level depicted on the delayed quote found above the normal trend chart.
As an example below, we can see that today’s price movement for Cisco Systems CSCO resulted in a decline of about 11%, which led the stock to reverse down into a column of Os from $48 to $43. Prior to this move, CSCO had a weekly OBOS reading of 29%, and after this move, CSCO sits at an intraday weekly OBOS reading of -69% at the time of this writing, shifting it to near heavily oversold conditions.

