
Most Requested Symbols

A guide to risk management via guided models and ETFs that offer the ability to systematically raise cash when needed.
Highlighting recent movers on the Asset Class Group Score rankings, and how to set up your own "model-of-models"
Today's featured stock is Denny's Corporation (DENN).
ARCH, CHRS, CNI, FTNT, PSB, ROKU, SNE, SR, THO & WEC
Call: Accenture (ACN), Put: Medtronic (MDT), Covered Write: Autodesk, Inc. (ADSK)

Please join us next Wednesday, May 22nd at 1pm EST for the next webinar in our Options Education Series! On Wednesday, Tony Zhang, Chief Strategiest at OptionsPlay, will discuss LEAPs as a stock replacement strategy. If you can't join the live call, we will have a replay available which we'll feature in this section of the report next week. Click here to register. The first five webinar replays in the Options Education Series are all linked below along with the future webinars we have scheduled through the end of July. As a reminder, if you took advantage of our free 45-day OptionsPlay trial, the trial period has come to an end. If you have subscription questions or would like more information, please contact sales@dorseywright.com or call our sales team at 212-312-0333.

Although the CBOE SPX Volatility Index VIX remains well below its long-term average of 18.34 (source: CBOE), recent market volatility has provided an opportune backdrop for advisors who tactically manage risk to tell their story. While we have not seen enough of a change to the landscape to merit significant shifts in a tactical allocation, having the ability to do so remains a point of differentiation for many of you. To that end, those of you using one of our strategies (whether a model or an ETF) that has the ability to raise cash can use this time to remind clients or prospects that you follow a rules-based, systematic approach, that can help manage downside risk. Such a conversation can help you accomplish two important tasks. First, you can explain that despite the increased volatility this year, we have yet to see enough of a change to merit a truly defensive stance against equity exposure. Second, you can reassure them that you have a proactive plan in place that will adapt when necessary.
Today we will highlight four strategies that are accessible both as guided models and through ETF products that have the ability to raise cash on the Nasdaq Dorsey Wright platform, as well as two additional single CUSIP solutions. It is important to keep in mind that the main objective of each of these strategies is to provide a path to being invested versus reacting to the first sign of market turbulence. They are designed to respond to material changes in risk, helping take the psychological process out of the equation so you don’t have to think twice about hitting the sell button. That being said, nothing is perfect nor works all the time; but in the grand scheme, these types of strategies help us ride out corrections with relative frequency and limit losses in bear markets.
Below we have put together some bullet points outlining how each strategy works. You’ll notice there are some Nasdaq Dorsey Wright driven strategies that offer both a guided ETF model approach as well as an ETF that tracks the same index. For more information, please find the linked fact sheet/info file for each model and/or fund.
Pacer Trendpilot 100 ETF PTNQ

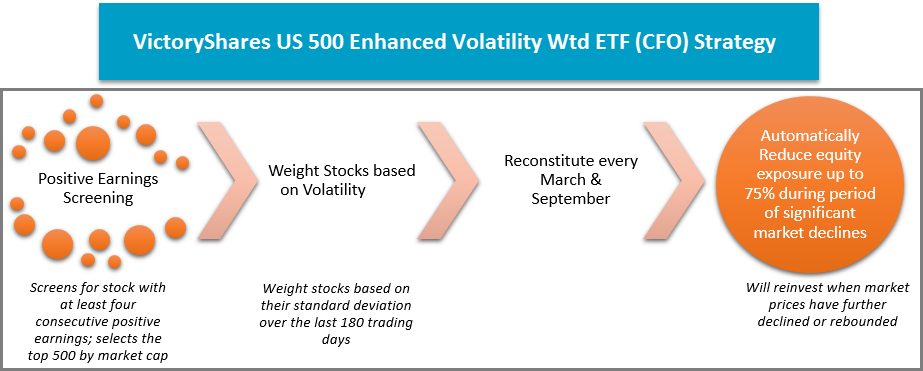
VictoryShares US 500 Enhanced Volatility Wtd ETF CFO
DWA Sector 4 Model POWER4

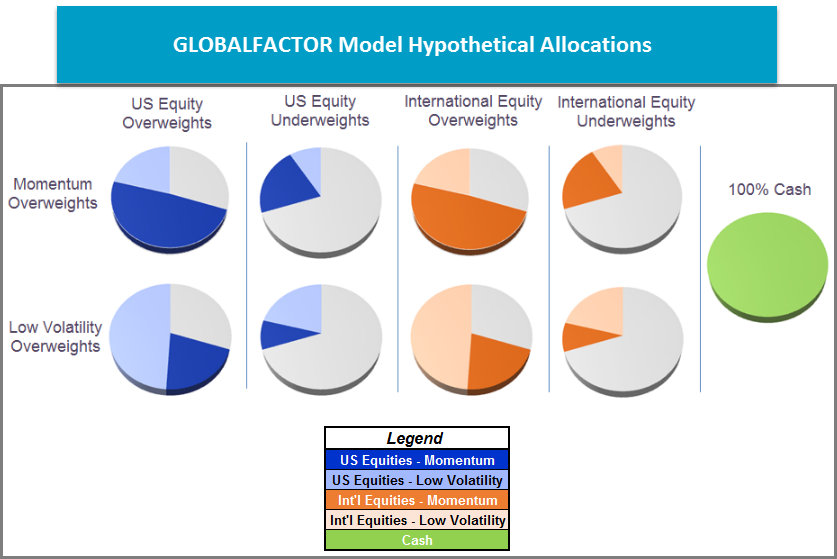
Invesco Global Factor Model GLOBALFACTOR
DWA People’s Portfolio PEOPLESPORT

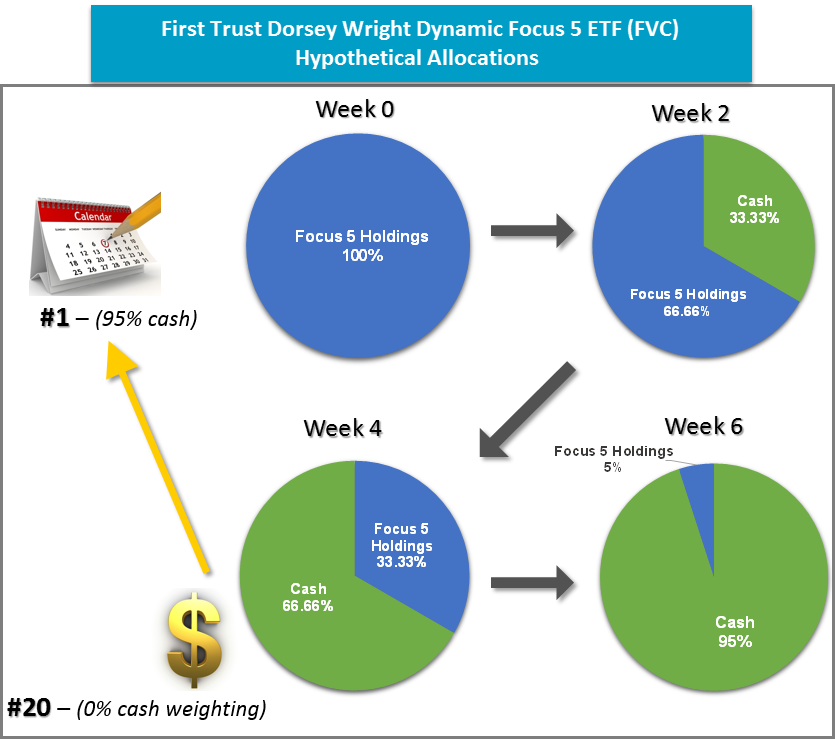
First Trust Dorsey Wright Dynamic Focus 5 ETF FVC
For your reference, below we have compared both the Guided Model and ETF approach so you may determine which solution is the best fit for you and your clients. The Guided Model approach does provide an opportunity for a touch point with clients upon changes, and generally speaking, individual ETFs do offer lower expense ratios on average than the ETFs that seek to track the models. However, those running the model do create taxable events upon a change and ticket charges could apply. On the other hand, someone using one of the ETFs isn’t always made aware of the change because the trades will occur within the ETF. By doing this, the ETFs offer tax efficiencies that the model itself does not afford. Both approaches have their benefits and often we find that it depends on what each individual advisor wants. In any case, the sector rotation and adaptation the strategy delivers will be provided. Typically we see advisors take advantage of the model approach when working in a non-taxable account while the ETF route tends to be used more often in a taxable account.

Regardless of how you wish to approach these strategies, we hope this piece has equipped you with an understanding of how these strategies work and what they can potentially look like during different market environments. These strategies allow both money to be invested in strong trends and come with an embedded process to manage the fear of a correction. If your clients understand the process, you both may be able to endure choppy market cycles without running into as many potholes or unsettling scenarios where the sell button begins to look friendly. Disciplined investing is not always easy, but it offers clients clarity and peace of mind about what is happening with their money and the opportunity for advisors to offer rules-based risk management within portfolios. The key here is to manage the emotions resulting from a sharp sell-off along with the reality that the weight of technical evidence (via the indicators) supports putting money to work at this time. If you need assistance understanding these models more in-depth or have a question about a certain methodology, please do not hesitate to give our office a call at (804)-320-8511.
A preference or bias in investing is normal. After all, we are all human and have individual preferences, risks, and goals to keep in mind when we are selecting what allocations, funds or securities we choose. Some advisors are still dye-in-the-wool users of mutual funds and do not trust ETF’s, while others prefer to only pull income like dividends and interest from the account. One preference that has been discussed extensively is the preference to invest in your home market. Simply put, people in the U.S. have an overweight in U.S. stock relative to global market share. One reason we often hear advisors mention is that “The large companies have enough non-U.S. exposure.” While it is true it may not be as much as you may think, Below is a chart that is published by S&P every month showing statistics on each sector and market cap segment.

Source: S&P Global Indexes
For large caps, a very large portion of the revenue still comes from U.S. consumers, especially when looking at the more defensive and higher dividend sectors. Technology and Materials derive a large portion of their revenue from outside the U.S., which is not surprising when you look at Google, Apple, Facebook or Qualcomm. So when your portfolio becomes more defensive and shifts from your growth sectors and you need diversification or differentiated alpha, is exactly the time you will be losing the benefit.
For the last 10 years owning just U.S. equities has worked out great as the U.S. large cap (specifically mega cap) market has had an amazing run. Prior to the great run up that we have had, however, this was not the case, and many investors have forgotten the lost decade for the S&P. During the 2000’s if you bought anything outside of the S&P, you made more money. Unfortunately some clients forget that diversification works over time, not every time. The question for investors is are we likely to have another decade of U.S. domination or will other areas of the market begin to revert back up to historical valuations relative to U.S. equities?

The recent market volatility has led to little change in the broader rankings of the Asset Class Group Scores (ACGS) system, with the US Equity Core Percentile rank still above 95% and the Money Market Percentile Rank still below 10% (through 5/16/19). The Group Score Report for all groups shows that recent improvements have come largely from fixed income, with six of the seven groups that have crossed above the 3 score line over the past 30 days coming from that space. The actual score improvement of these groups has been relatively muted, with no groups increasing in average score by more than a point over the trailing month. The upper end of the ACGS rankings still drastically favors domestic equities, leading this recent improvement in fixed income to be indicative of the recent pullback across equity markets. Nonetheless, it is still a point to monitor as we head towards the midpoint of the year.
On the domestic equity side of the coin, you can see on the Group Scores Report that Consumer Non-Cyclical and Real Estate are among the most improved scores over the past 30 days, and are the only groups with an average score above 4.00 on that list. Real Estate’s recent average score of 4.32 and the 4.01 average posted by Consumer Non-Cyclical are both the highest average scores seen by either group since 2016. This improvement has not led to enough strength to move these sectors in favor on our relative strength based D.A.L.I. rankings, but this is another point to watch for further development.

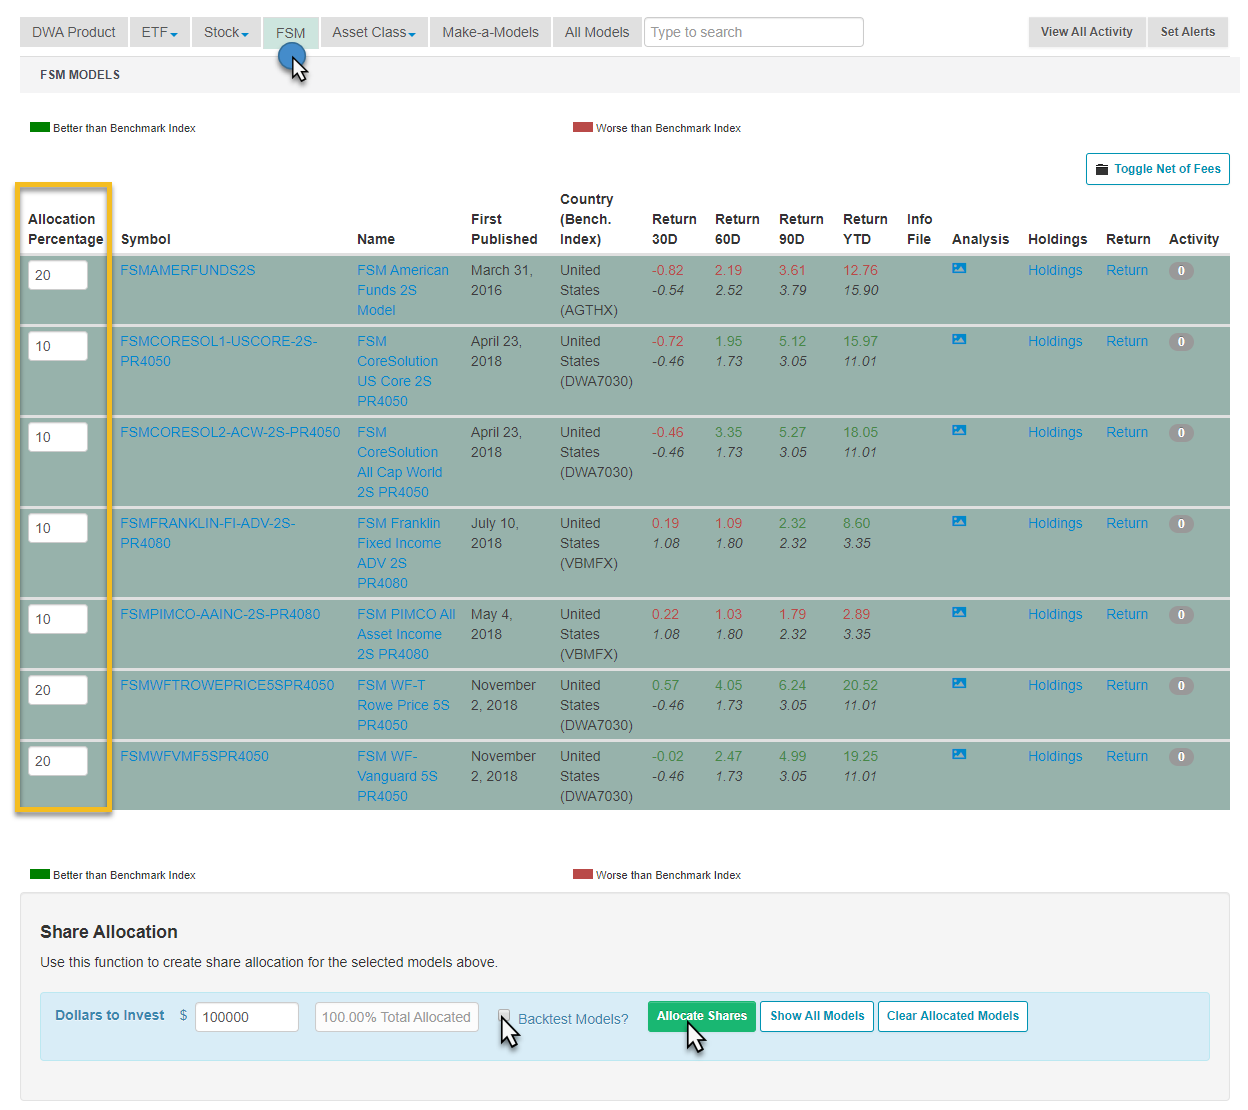
Earlier this week we launched a new Fund Score Method (FSM) Model, FSM The Tortoise & Hare 80-20, which we introduced in yesterday’s Fund Score Overview. As always, we appreciate all feedback on the new models or tools we make available and are always happy to answer questions on any strategy, old or new. Many of the questions we received over the past few days have dealt with applying the same “model-of-models” methodology to your own selection of FSM models, whether it be differing providers or more sensitive cash triggers. In order to set up your own guidelines, you can use the Allocation Percentage column found on the FSM models page, setting your own allocations for each of the models you would like to use. This would allow you to designate personal “sleeves” for each of the funds, and setting alerts on these models will let you know when to make a change. You can also delve deeper into the strategy by checking the “Backtest Models?” checkbox before allocating the strategy, which will run a hypothetical growth of how a portfolio would have done over time using the criteria you set. After choosing the models and the thresholds you find most appealing, you would make sure the alerts for each of these models are set and then simply wait for an email to make a change.
Average Level
7.06
The average Bullish Percent reading this week is 46.28% down 2.78% from the previous week
| AGG | iShares US Core Bond ETF |
| CL/ | Crude Oil Continuous |
| DJIA | Dow Jones Industrial Average |
| DVY | iShares Dow Jones Select Dividend Index |
| DX/Y | NYCE U.S.Dollar Index Spot |
| EFA | iSharesMSCI EAFE Index Fund |
| FXE | CurrencyShares Euro Trust |
| GC/ | Gold Continuous |
| GSG | iShares S&P GSCI Commodity-Indexed Trust |
| HYG | iShares iBoxx $ High Yield Corporate Bond ETF |
| ICF | iShares Cohen & Steers Realty Index |
| IEF | iShares Barclays 7-10 Yr. Tres. Bond Fund |
| LQD | iShares iBoxx $ Investment Grade Corp. |
| MID | S&P 400 MidCap Index |
| NASD | Nasdaq Composite |
| NDX | NASDAQ-100 Index |
| RSP | Guggenheim S&P 500 Equal Weight ETF |
| RUT | Russell 2000 Index |
| SHY | iShares Barclays 1-3 Year Tres. Bond Fund |
| SML | S&P 600 Small Cap Index |
| SPX | S & P 500 Index |
| TLT | iShares Barclays 20+ Year Treasury Bond Fund |
| UV/Y | Continuous Commodity Index |
| VOOG | Vanguard S&P 500 Growth ETF |
| VOOV | Vanguard S&P 500 Value ETF |
| EEM | iShares MSCI Emerging Markets ETF |
| XLG | Invesco S&P 500 Top 50 ETF |

| Symbol | Company | Sector | Current Price | Action Price | Target | Stop | Notes |
|---|---|---|---|---|---|---|---|
| DKS | Dick's Sporting Goods, Inc. | Retailing | $36.05 | $38 - $42 | $61 | $32 | 3 for 5’er, consec buy signals, pos mon mom, top half of RETA matrix, 3.03% yield, Earn. 5/29 |
| WDAY | Workday Inc. | Software | $212.00 | hi 190s - low 210s | 236 | 174 | 5 for 5'er, top 20% of favored SOFT sector matrix, bullish catapult to new all-time high, potential covered write opp, Raised Stop. Earn. 5/28 |
| BAX | Baxter International Inc. | Healthcare | $76.90 | mid-70s to low-80s | 132 | 61 | 4 for 5'er, pullback from all-time high, one box from peer RS buy, R-R>2.0 |
| CE | Celanese Corporation | Chemicals | $101.81 | $97 - $108 | $138.50 | $92 | 4 for 5’er, 5 consec buy signals, pos mon mom, 2.32% yield |
| CCI | Crown Castle International Corp. | Real Estate | $127.53 | 120 - 130 | 145 | 102 | 5 for 5'er, top 20% of REAL sector matrix, 3.6% yield, long-term positive RS |
| XEL | Xcel Energy, Inc. | Utilities/Electricity | $57.73 | 54 - 58 | 79 | 47 | 4 for 5'er, top 25% of favored EUTI sector matrix, one box away from mkt RS buy signal, pos wkly mom flip, 2.81% yield |
| ENSG | Ensign Group, Inc. | Healthcare | $57.16 | 53 - 58 | 75 | 46 | 5 for 5'er, top 10% in HEAL sector matrix, LT pos trend, pos wkly & mnthly mom flips |
| WEX | WEX Inc. | Business Products | $202.74 | $196 - $212 | $224 | $170 | 5 for 5’er, 4 consec buy signals, top 33% of BUSI matrix, pullback from all-time high, pos mon mom |
| DENN | Denny's Corporation | Restaurants | $19.54 | 18 - 20 | 27.50 | 16.50 | 5 for 5'er, top third of REST sector matrix, triple top breakout, LT positive trend. R-R > 2.5 |
| Symbol | Company | Sector | Current Price | Action Price | Target | Stop | Notes |
|---|---|---|---|---|---|---|---|
| AA | Alcoa Inc. | Metals Non Ferrous | $24.98 | mid-to-upper 20s | 20 | 32 | 0 for 5'er, dead last in META sector matrix, negative trend |
| NOV | National-Oilwell, Inc. | Oil Service | $24.75 | (24 - 27) | 20 | 30 | 1 for 5'er, bottom 25% of unfavored OILS sector matrix, bearish triangle, neg. wkly mom |
| Symbol | Company | Sector | Current Price | Action Price | Target | Stop | Notes |
|---|---|---|---|---|---|---|---|
| PAYC | Paycom Software Inc | Software | $212.05 | $194-$210 | $232 | $168 | 5 for 5'er, top 10% of fav SOFT matrix, consec buy signals, pullback from all-time high, pos week & mon mom |
| Comment |
|---|
| PAYC Paycom Software Inc R ($213.32) - Software - PAYC has moved above our ideal action range. OK to hold here. Raise stop to $174. |
| BLL Ball Corporation R ($62.70) - Business Products - BLL reversed down in Friday's trading after peaking at $65. We will, therefore, raise our stop to $56 in order to protect profits. |
DENN Denny's Corporation R ($19.60) - Restaurants - DENN is a 5 for 5'er that ranks in the top third of the Restaurants sector matrix. The stock has given three consecutive buy signals, most recently breaking a triple top at $19 late last month and has been trading in a positive trend more than a decade. Long exposure may be added in the $18 - $20 range and we will set our initial stop at $16.50, a potential triple bottom break on DENN's default chart. We will use the bullish price objective of $27.50 as our target price, giving us a reward-to-risk ratio in excess of 2.5.
| 05 | 06 | 07 | 08 | 09 | 10 | 11 | 12 | 16 | 17 | 18 | 19 | ||||||||||||||||||||||||||||||||||||||||||
| 20.00 | X | 20.00 | |||||||||||||||||||||||||||||||||||||||||||||||||||
| 19.50 | 5 | 19.50 | |||||||||||||||||||||||||||||||||||||||||||||||||||
| 19.00 | X | 19.00 | |||||||||||||||||||||||||||||||||||||||||||||||||||
| 18.50 | X | X | X | 18.50 | |||||||||||||||||||||||||||||||||||||||||||||||||
| 18.00 | X | X | O | X | O | X | Mid | 18.00 | |||||||||||||||||||||||||||||||||||||||||||||
| 17.50 | X | X | O | 1 | O | X | O | X | 17.50 | ||||||||||||||||||||||||||||||||||||||||||||
| 17.00 | X | O | X | O | X | 3 | 4 | 17.00 | |||||||||||||||||||||||||||||||||||||||||||||
| 16.50 | 4 | O | 6 | X | B | X | 16.50 | ||||||||||||||||||||||||||||||||||||||||||||||
| 16.00 | 3 | 5 | X | O | X | C | 16.00 | ||||||||||||||||||||||||||||||||||||||||||||||
| 15.50 | X | O | X | O | X | 15.50 | |||||||||||||||||||||||||||||||||||||||||||||||
| 15.00 | X | O | 7 | X | Bot | 15.00 | |||||||||||||||||||||||||||||||||||||||||||||||
| 14.50 | X | O | X | 14.50 | |||||||||||||||||||||||||||||||||||||||||||||||||
| 14.00 | X | 1 | 9 | X | 14.00 | ||||||||||||||||||||||||||||||||||||||||||||||||
| 13.50 | 2 | O | B | A | 13.50 | ||||||||||||||||||||||||||||||||||||||||||||||||
| 13.00 | C | O | A | 13.00 | |||||||||||||||||||||||||||||||||||||||||||||||||
| 12.50 | 8 | X | 3 | 8 | 12.50 | ||||||||||||||||||||||||||||||||||||||||||||||||
| 12.00 | 3 | 7 | O | B | O | X | 12.00 | ||||||||||||||||||||||||||||||||||||||||||||||
| 11.50 | X | O | X | O | 7 | 5 | X | 11.50 | |||||||||||||||||||||||||||||||||||||||||||||
| 11.00 | 1 | O | X | 9 | 5 | 6 | 11.00 | ||||||||||||||||||||||||||||||||||||||||||||||
| 10.50 | C | 4 | B | 2 | 10.50 | ||||||||||||||||||||||||||||||||||||||||||||||||
| 10.00 | X | O | X | 10.00 | |||||||||||||||||||||||||||||||||||||||||||||||||
| 9.50 | X | O | X | • | 9.50 | ||||||||||||||||||||||||||||||||||||||||||||||||
| 9.00 | B | 1 | • | 9.00 | |||||||||||||||||||||||||||||||||||||||||||||||||
| 8.50 | X | • | 8.50 | ||||||||||||||||||||||||||||||||||||||||||||||||||
| 8.00 | A | • | 8.00 | ||||||||||||||||||||||||||||||||||||||||||||||||||
| 7.50 | X | • | 7.50 | ||||||||||||||||||||||||||||||||||||||||||||||||||
| 7.00 | B | • | 7.00 | ||||||||||||||||||||||||||||||||||||||||||||||||||
| 6.50 | • | A | • | 6.50 | |||||||||||||||||||||||||||||||||||||||||||||||||
| 6.00 | 7 | • | • | 5 | • | 6.00 | |||||||||||||||||||||||||||||||||||||||||||||||
| 5.50 | X | O | • | • | • | X | • | • | 2 | • | 5.50 | ||||||||||||||||||||||||||||||||||||||||||
| 5.00 | 2 | X | O | X | • | X | • | 4 | • | 1 | O | X | • | • | 9 | • | 5.00 | ||||||||||||||||||||||||||||||||||||
| 4.75 | 1 | O | X | 9 | X | O | X | O | X | O | B | O | X | O | X | • | 7 | • | 4.75 | ||||||||||||||||||||||||||||||||||
| 4.50 | X | O | X | O | X | O | 2 | O | X | O | X | 2 | X | O | A | O | • | 2 | • | 4.50 | |||||||||||||||||||||||||||||||||
| 4.25 | X | 4 | 6 | O | X | C | X | 3 | 6 | X | O | 5 | X | O | • | X | 3 | 1 | • | 4.25 | |||||||||||||||||||||||||||||||||
| 4.00 | O | X | O | X | O | X | O | A | 7 | X | B | X | • | 2 | O | X | O | C | • | 4.00 | |||||||||||||||||||||||||||||||||
| 3.75 | O | X | B | 1 | • | O | 9 | 8 | O | X | O | • | X | X | O | X | O | X | • | 3.75 | |||||||||||||||||||||||||||||||||
| 3.50 | 5 | • | O | X | • | 1 | 5 | O | • | X | O | B | O | 8 | X | • | 3.50 | ||||||||||||||||||||||||||||||||||||
| 3.25 | • | 7 | X | • | O | 4 | 6 | • | X | O | A | 9 | • | 3.25 | |||||||||||||||||||||||||||||||||||||||
| 3.00 | • | O | X | • | O | X | O | 8 | • | 5 | A | 3 | 5 | X | • | • | 3.00 | ||||||||||||||||||||||||||||||||||||
| 2.75 | • | O | X | • | 3 | X | O | X | O | • | X | O | X | O | X | 6 | X | • | 2.75 | ||||||||||||||||||||||||||||||||||
| 2.50 | • | 8 | • | O | 7 | X | O | X | X | O | X | O | X | O | • | 2.50 | |||||||||||||||||||||||||||||||||||||
| 2.25 | • | • | O | X | A | X | O | X | 4 | O | O | • | • | 2.25 | |||||||||||||||||||||||||||||||||||||||
| 2.00 | • | O | O | X | O | C | O | X | • | 2.00 | |||||||||||||||||||||||||||||||||||||||||||
| 1.75 | • | O | O | X | O | X | • | 1.75 | |||||||||||||||||||||||||||||||||||||||||||||
| 1.50 | O | X | 1 | X | • | 1.50 | |||||||||||||||||||||||||||||||||||||||||||||||
| 1.25 | O | 3 | • | 1.25 | |||||||||||||||||||||||||||||||||||||||||||||||||
| 05 | 06 | 07 | 08 | 09 | 10 | 11 | 12 | 16 | 17 | 18 | 19 |
| ARCH Arch Coal Inc ($90.94) - Oil - ARCH shares reversed into a column of Os today, breaking a double bottom at $91 to mark a third consecutive sell signal. The move also results in a negative trend reversal for the stock, demoting it to a 3 for 5’er. ARCH has been posting lower tops and lower bottoms in recent weeks, suggesting supply is in control. Those with open exposure may wish to reevaluate the position with the negative trend change. From here, support is found at $85, while initial overhead resistance is found at $95. |
| CHRS Coherus Biosciences Inc ($18.55) - Biomedics/Genetics - CHRS broke a double top at $18.50, marking the third consecutive buy signal on the chart. This 5 for 5'er ranks 2nd out of 83 names in the Biomedics/Genetics sector RS matrix, and moved back to a positive trend in March. Weekly and monthly momentum are both positive, and the bullish price objective of $27 suggests the potential for further upside from here. Initial support can be found at $16.50, with overhead resistance at $20. |
| CNI Canadian National Railway ($93.99) - Transports/Non Air - CNI broke a double top at $95 on Friday, marking a new all-time high as well as the second consecutive buy signal on the chart. This 5 for 5'er ranks 8th out of 46 names in the Transports/Non Air sector RS matrix, and moved back to a positive trend in February. The bullish price objective of $121 also suggests the potential for higher prices, however, those looking to add exposure would be best served to wait for a pullback as CNI is entering overbought territory. Initial support can be found at $91 with further support at $81. Note CNI offers a yield of 1.70%. |
| FTNT Fortinet Inc. ($83.08) - Software - Fortinet returned to a buy signal when it broke a double top with an advance to $84 during Friday's action. FTNT is a 5 for 5'er and has been in a positive trend since February 2014 and has been on a market RS buy signal since February 2018, confirming long-term absolute and relative strength to the broader market. Monthly momentum has recently flipped positive, suggesting the potential for further gains. From here, support is found at $80, while initial overhead resistance resides at $94. |
| PSB PS Business Parks, Inc. ($160.55) - Real Estate - PS Business Parks broke a double top with an advance to an all-time high of $160, marking a third consecutive buy signal. PSB is a perfect 5 for 5’er that has been trading in a positive trend since October 2015. The stock ranks in the top decile of the Real Estate sector matrix. Weekly momentum recently flipped positive, implying the potential for additional upside. Okay to add exposure here. The first sign of trouble would come with a move to $142. Note that PSB has a yield of 2.61%. |
| ROKU Roku, Inc. Class A ($84.01) - Media - Shares of ROKU reversed back into a column of Xs and completed a bullish triangle pattern Friday at $85, before continuing to $87 intraday, marking a new all-time high. This 5 for 5'er moved to a positive trend in February and has maintained an RS buy signal against the market since last August. The recently flip to positive weekly and monthly momentum suggest the potential for additional upside, however, those looking for long exposure may be best served to wait for a pullback as ROKU is heavily overbought at current levels. Initial support can be found at $81 with further support at $79. |
| SNE Sony Corporation (Japan) ADR ($52.61) - Electronics - Shares of SNE rose Friday to break a double top at $53. This 4 for 5'er moved to a positive trend earlier this month and has maintained an RS buy signal against the market since 2015. The recent flip to positive monthly momentum and the bullish price objective of $73 suggest the potential for higher prices, however, those looking to add exposure would be best served to wait for a pullback as SNE is overbought. Initial support can be found at $48. |
| SR Spire Inc. ($86.11) - Gas Utilities - SR continued higher Friday to break a double top at $87, marking a new all-time high. This 4 for 5'er moved to a positive trend in January and currently ranks 9th out of 25 names in the Gas Utilities sector RS matrix. Weekly momentum recently flipped positive, and the bullish price objective of $111 indicates the potential for further price appreciation, however, recent movement has led SR to overbought territory, so those looking to add exposure would be best served to wait for a pullback or normalization of the trading band. Initial support can be found at $83 with further support at the bullish support line, which currently sits at $76. SR also carries a 2.73% yield. |
| THO Thor Industries, Inc. ($56.47) - Leisure - Thor Industries broke a spread triple bottom during Friday’s action, declining to $57 to return to a sell signal. THO is a 0 for 5’er that has been in a negative trend since September 2018. The stock ranks in the bottom quartile of the Leisure sector matrix. Additionally, THO has been on a market RS sell signal since May 2018, confirming long-term weakness relative to the broader market. Supply is in control. Avoid long exposure. Short sellers should note that THO is approaching heavily oversold levels and has a yield of 2.76%. |
| WEC WEC Energy Group Inc ($80.90) - Utilities/Electricity - WEC broke a double top at $81 on Friday and is now trading at new all-time highs. This stock is a perfect 5 for 5’er within the favored utilities/electricity sector that has been in a positive trend since August 2009. In addition, weekly momentum recently flipped positive, suggesting the potential for higher prices. Demand is in control and the technical picture is strong. From here, initial support lies at $76. |
| Name | Option Symbol | Action | Stop Loss |
|---|---|---|---|
| Accenture PLC - $178.32 | O:ACN 19I170.00D20 | Buy the September 170.00 calls at 14.60 | 170.00 |
| Name | Option | Action |
|---|---|---|
| Analog Devices, Inc. ( ADI) | Sep. 110.00 Calls | Stopped at 102.00 (CP: 100.45) |
| Name | Option Symbol | Action | Stop Loss |
|---|---|---|---|
| Medtronic PLC - $87.73 | O:MDT 19U90.00D20 | Buy the September 90.00 puts at 5.60 | 91.00 |
| Name | Option | Action |
|---|---|---|
| Big Lots, Inc. (BIG) | Jul. 45.00 Puts | Raise the option stop loss to 11.10 (CP: 13.10) |
| Brunswick Corporation (BC) | Sep. 55.00 Puts | Initiate an option stop loss of 6.00 (CP: 8.00) |
| Name | Option Sym. | Call to Sell | Call Price | Investment for 500 Shares | Annual Called Rtn. | Annual Static Rtn. | Downside Protection |
|---|---|---|---|---|---|---|---|
| Autodesk, Inc. $176.68 | O:ADSK 19J180.00D18 | Oct. 180.00 | 13.85 | $81,180.90 | 23.20% | 17.47% | 6.87% |
| Name | Action |
|---|---|
| Liveramp Holdings Inc. (RAMP) - 57.09 | Sell the August 60.00 Calls. |
| Advanced Micro Devices, Inc. (AMD) - 28.01 | Sell the October 29.00 Calls. |
| Workday Inc. (WDAY) - 212.00 | Sell the September 210.00 Calls. |
| Twitter, Inc (TWTR) - 38.30 | Sell the September 40.00 Calls. |
| Iridium Communications, Inc. (IRDM) - 24.54 | Sell the October 28.00 Calls. |
| Okta Inc (OKTA) - 109.71 | Sell the August 110.00 Calls. |
| Wayfair Inc. (W) - 148.26 | Sell the August 155.00 Calls. |
| Twilio Inc (TWLO) - 142.37 | Sell the October 140.00 Calls. |
| Atlassian Corp. PLC (TEAM) - 129.74 | Sell the August 130.00 Calls. |
| Five Below Inc (FIVE) - 127.24 | Sell the August 130.00 Calls. |
| Name | Covered Write |
|---|---|
|
|
|
Daily Equity & Market Analysis
Loading, Please Wait...
