Most Requested Symbols

Upcoming Events with OppenheimerFunds
Please join OppenheimerFunds and Nasdaq Dorsey Wright for an engaging discussion on portfolio construction best practices using technical analysis. We will focus the discussion on Relative Strength investing and how it can be applied to a portfolio, revenue weighting and why it matters as well as implementing these processes in a model portfolio. This will be a great opportunity to hear from one of our industry’s leaders in the field of investment research and technical analysis.
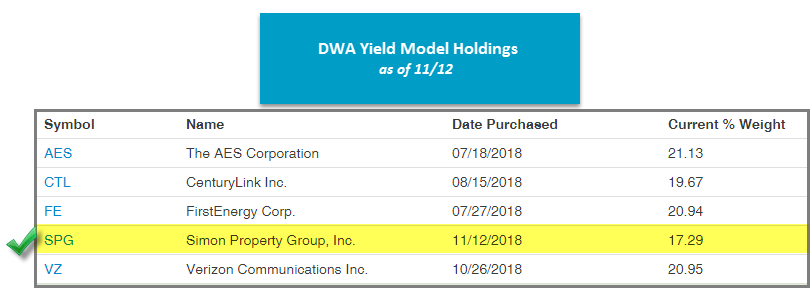
There was a change to DWA Yield Portfolio SPX500YLD: Sell – QUALCOMM Incorporated QCOM, Buy – Simon Property Group, Inc. SPG. Recall that the DWA Yield Portfolio is designed to provide a turn-key U.S. equity income solution within client accounts, while also taking advantage of a relative strength-based strategy that has the potential for capital appreciation. SPX500YLD is designed to hold approximately five positions, and in order for a stock to be considered as an addition to the model, it must rank in the top 10 of the model’s relative strength matrix, have a minimum of 3 positive technical attributes in its favor, and the trend chart must be on a Point & Figure buy signal. All of the positions will be held until one of the following occurs: the stock falls below the 20th position in the matrix, technical attributes fall below 3, or the stock gives two consecutive sell signals. As a result of yesterday’s market action, QCOM fell to the 25th position in the model matrix, warranting its removal from the model. In its place, SPG has been added as it is the highest ranked stock in the model matrix that is on a Point & Figure buy signal with 4 technical attributes in its favor at this time. SPG offers a yield of 4.28%. Note: to see this model, you must have the matrix tool as apart of your subscription.

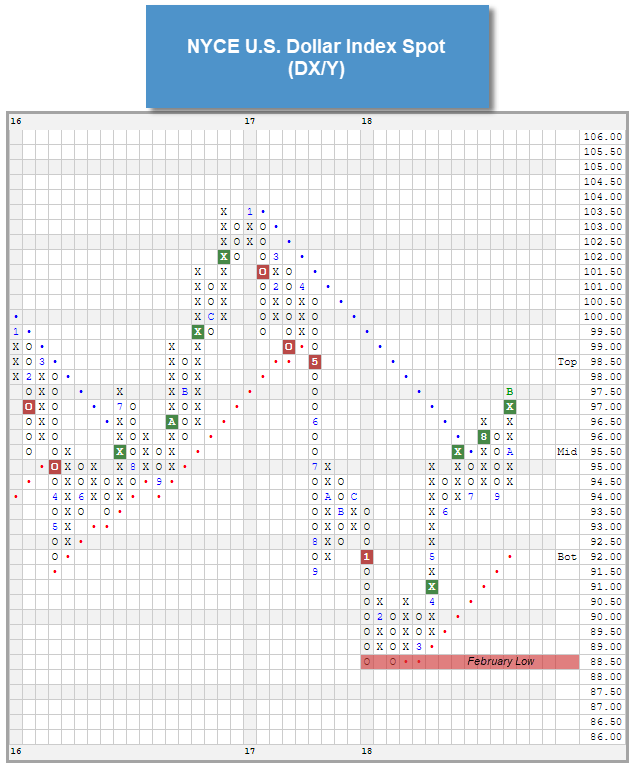
Throughout 2018, the strengthening of the U.S. Dollar has been among the primary themes in focus. Coming into 2018, investors found themselves within a falling dollar environment, as the NYCE U.S. Dollar Spot Index DX/Y had reached a multi-year low in February. The greenback has since strengthened over the last nine months, so today we will provide a broad update on the technical picture of the U.S. Dollar and also discuss the Dollar’s impact on the broad asset classes.
What is the US Dollar Index (DX/Y)?
To begin, we should first explain that the US Dollar Index DX/Y is priced in terms of a weighted basket of major foreign currencies. When we refer to moves in "the dollar," it is this index to which we are referring. The US Dollar Index is a geometrically-averaged calculation of six currencies weighted against the US dollar, which has been in existence since 1973. Futures Contracts were listed on the Index back in 1985 and only one major reconstitution of the Index has taken place since that time, which was a move to include the Euro.
Today, the US Dollar Index contains six component currencies, which are "trade-weighted": the Euro, Japanese Yen, British Pound, Canadian Dollar, Swedish Krona and Swiss Franc. Prior to the formation of the Euro FX, the US Dollar Index contained 10 currencies, which also included the West German Mark, French Franc, Italian Lira, Dutch Guilder and Belgium Franc. Today the currency weights contributing to the pricing of this Index are as follows:
Currency Weights:
As of close Monday, November 12th, the NYCE U.S. Dollar Spot Index DX/Y was sitting at the $97.67 level, which is more than 10% higher than its February low of $88.26. As a result, we are now effectively in a rising dollar environment. Prior to this transition, the U.S. Dollar had been in a falling dollar environment since January 3rd, 2017. After coming off its bottom, DX/Y broke through the bearish resistance line on August 10th, 2018, and has continued to move incrementally higher since that time. The Dollar also continued to rise throughout the US market turbulence experienced throughout the month of October, which speaks to the enhanced deterioration of international equities. As we’ll discuss in the U.S. Dollar Study below, certain asset classes fair better than others during rising vs falling dollar environments, while others aren’t impacted to a significant degree.
a/o 11/12/2018
Our data on this NYCE U.S. Dollar Spot Index goes back to the point in time when a liquid market was created for this calculation of the Dollar with the inception of futures contracts on the U.S. Dollar Index (in 1985). Since that time, we have seen many significant moves for the Dollar, and today we would like to focus on identifying any meaningful correlation between other major asset classes and moves in the underlying currency markets. In other words, do some assets perform better with consistency in a rising dollar market, and vice versa?
Traditional measures of correlation would look at daily or monthly returns of some security, the Dollar for example, and then match up the returns of something else (a bond index perhaps) in the same manner. If bonds were generally up during the same sessions that the Dollar posted gains, they would be considered positively correlated. If bonds were generally down during days (or months) when the Dollar was up, they would be considered inversely correlated. Such data is available elsewhere and didn't truly provide the type of research we wanted to provide to you. Before we began to study this, we set out a definition for a "rising dollar market" versus a "falling dollar market."
Study Parameters:
Over the last 33 years, there have been a total of 12 rising dollar markets and 12 falling dollar markets (including the recent "rising" stint, which began February 16th, 2018, and continues through the present-day) using our basic criteria. The average duration of a (rising or falling) cycle is 501 days, and results in an average move of about +/- 20% in each direction (keep in mind that the manner in which these trends were calculated means that no trend could have resulted in a move materially less than 10% in either direction). The average number of days for a rising dollar environment is currently at 559 days. The return for DX/Y during the previous rising environment was +41.19% (5/4/11 to 1/3/17), which is well above the +20% historical average. Below we offer you a recap of all the historical rising and falling dollar environments, as well as associated returns for DX/Y, in addition to other pertinent benchmarks.

a/o 11/12/2018
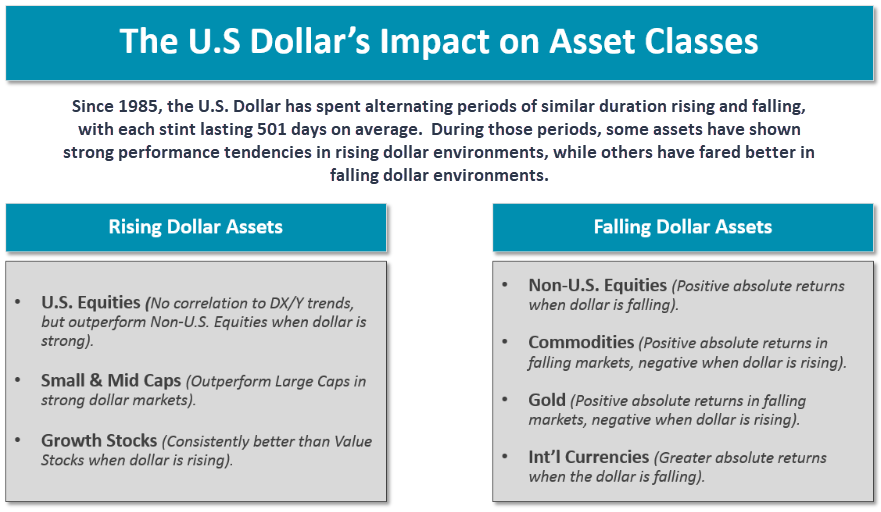
Having identified "rising dollar" and "falling dollar" environments going back to 1985, the next step was to look at various asset classes and their respective performance during these markets. To accomplish this, we chose investment vehicles representing Domestic Equity, International Equity, Emerging Markets, Domestic Fixed Income, Foreign Currency, Various Equity Styles (Large, Mid, Small, Value, and Growth), and Commodities. The results were interesting as many assets did show meaningful performance biases during either rising or falling dollar markets. The red bars in the graphics below represent average performance during all falling dollar markets, while the green bars represent the average performance by that same asset class during all rising dollar markets. For some assets, we did not have data going back to 1985, so returns reflect the average since the time at which we had data (those dates are denoted). In the bullet points below, we have highlighted the notable takeaways about falling dollar environments.
Observations:

So what does the information in the study mean for our portfolios today? At this point, we would consider it less of a call to action and more of a cause for attention. We continue to see Domestic Equities hang on to their superior relative strength over all other asset classes. While Domestic Equity indexes experienced pullbacks during the volatile month of October, they actually widened the gap based on the D.A.L.I. rankings, as just about everything else declined as well. We will continue to monitor the impact the Dollar has on both Domestic and International Equities as we look towards closing out the year.

Every week, the analysts here at DWA organize and write approximately 11 feature stories focusing within the inventories of multiple ETF providers. These articles can be found within the weekly ETF reports we conduct for those ETF families with which we provide guided model-based solutions. The weekly reports can be accessed from the Research Menu.

For the second time in 2018 there is a change to the First Trust Focus Five Model FTRUST5, and the change this week is removing the First Trust Industrials AlphaDEX ETF FXR and replacing it with the First Trust Healthcare AlphaDEX FXH. FXR had been a holding in the model for nearly two years, and... (Read more)
Most of you are familiar with our fund scoring process. Every Mutual Fund and ETF in the Dorsey Wright system is assigned a fund score between 0.00 and 6.00, with six being the best score possible. The composition of the score can be broken down into three components: Trend, Relative Strength vs. the Market, and Relative Strength vs. Peers. Two of the potential points are based on the trending characteristics of the fund, two of the potential points are given towards relative strength characteristics versus the broad market, and the remaining two potential... (Read more)
This week, we are going to take a look at the Xtrackers Russell 1000 Comprehensive Factor ETF DEUS. As a refresher, this fund seeks to follow the performance, before fees and expenses, of the Russell 1000 Comprehensive Factor Index, which filters through the Russell 1000 based on Quality, Value, Momentum, Low Volatility, and Size screens. This fund reached a new all-time high in August, before pulling back with the broader market in October, and ultimately finding support at the February low of $30.50. The fund has shown a rebound in early November with its reversal up into...(Read more)
The Distribution Report below places Major Market ETFs and Indices into a bell curve style table based upon their current location on their 10-week trading band. The middle of the bell curve represents areas of the market that are "normally" distributed, with the far right being 100% overbought on a weekly distribution and the far left being 100% oversold on a weekly distribution. The weekly distribution ranges are calculated at the end of each week, while the placement within that range will fluctuate during the week. In addition to information regarding the statistical distribution of these market indexes, a symbol that is in UPPER CASE indicates that the RS chart is on a Buy Signal. If the symbol is dark Green then the stock is on a Point & Figure buy signal, and if the symbol is bright Red then it is on a Point & Figure sell signal.
The average Bullish Percent reading this week is 34.94% up 0.72% from the previous week
| <--100 | -100--80 | -80--60 | -60--40 | -40--20 | -20-0 | 0-20 | 20-40 | 40-60 | 60-80 | 80-100 | 100-> | |||
 |
||||||||||||||
| Symbol | Name | Symbol | Name |
| AGG | iShares US Core Bond ETF | NASD | Nasdaq Composite |
| CL/ | Crude Oil Continuous | NDX | NASDAQ-100 Index |
| DJIA | Dow Jones Industrial Average | RSP | Invesco S&P 500 Equal Weight ETF |
| DVY | iShares Dow Jones Select Dividend Index | RUT | Russell 2000 Index |
| DX/Y | NYCE U.S.Dollar Index Spot | SHY | iShares Barclays 1-3 Year Tres. Bond Fund |
| EFA | iSharesMSCI EAFE Index Fund | SML | S&P 600 Small Cap Index |
| FXE | CurrencyShares Euro Trust | SPX | S & P 500 Index |
| GC/ | Gold Continuous | TLT | iShares Barclays 20+ Year Treasury Bond Fund |
| GSG | iShares S&P GSCI Commodity-Indexed Trust | UV/Y | Continuous Commodity Index |
| HYG | iShares iBoxx $ High Yield Corporate Bond ETF | VOOG | Vanguard S&P 500 Growth ETF |
| ICF | iShares Cohen & Steers Realty Index | VOOV | Vanguard S&P 500 Value ETF |
| IEF | iShares Barclays 7-10 Yr. Tres. Bond Fund | EEM | iShares MSCI Emerging Markets ETF |
| LQD | iShares iBoxx $ Investment Grade Corp. | XLG | Invesco S&P 500 Top 50 ETF |
| MID | S&P 400 MidCap Index |

| Stock | Symbol | Sector | Current Price | Action Price | Target | Stop | Notes |
|---|---|---|---|---|---|---|---|
| Norfolk Southern Corporation | NSC | Transports/Non Air | $167.01 | 160's - 170's | 186 | 140 | 5 for 5'er, top 10% of TRAN sector matrix, pullback from all-time high, 1.98% yield |
| CME Group, Inc. | CME | Wall Street | $186.45 | 180's | 216 | 152 | 5 for 5'er, #1 of 28 in WALL sector matrix, one box from triple top breakout, pos. monthly mom flip,1.54% yield |
| The Clorox Company | CLX | Household Goods | $161.07 | 146 - 158 | 170 | 130 | 4/5'er, top 25% of sector matrix, div yield of 2.5% |
| Boston Scientific Corporation | BSX | Healthcare | $36.93 | mid - high 30's | 51 | 31 | 5 for 5'er, top 20% if HEAL sector matrix, mutli consec buy signals, long term positive RS |
| Arthur J. Gallagher & Co. | AJG | Insurance | $77.66 | 72 - 78 | 99 | 62 | 4 for 5'er, top 25% of INSU sector matrix, new mkt RS buy signal, pos mnthly mom flip, 2.17% yield |
| Berkshire Hathaway Inc | BRK.B | Insurance | $215.42 | 208 - 224 | 302 | 184 | 3 for 5'er, top third of INSU sector matrix, big base breakout, pullback from all-time high, one box from mkt RS buy signal |
| Tractor Supply Company | TSCO | Retailing | $96.19 | 90's | 106 | 83 | 5 for 5'er, top 10% of RETA sector matrix, three consec buy signals, pos wkly mom flip |
| Church & Dwight Company | CHD | Household Goods | $66.01 | 60 - 66 | 91 | 54 | 4 for 5'er, top 25% of HOUS sector matrix, long-term pos RS, pullback from ATH, pos wkly mom flip |
| U G I Corp Holding Co | UGI | Gas Utilities | $56.52 | 54 - 59 | 77 | 50 | 5 for 5'er, top 20% of GUTI sector matrix, multi consec buy signals, LT pos. mkt RS, pos wkly mom flip, 1.8% yield |
| Stock | Symbol | Sector | Current Price | Action Price | Target | Stop | Notes |
|---|---|---|---|---|---|---|---|
| Criteo SA | CRTO | Internet | $20.40 | high 10's - low 20's | $13 | 26 | 0 for 5'er, bottom third of unfavored INET sector matrix, multi consec sell signals, LT negative trend |
| Sotheby's | BID | Retailing | $40.10 | 38 - 42 | 34 | 46 | 0 for 5'er, bottom 20% of RETA sector matrix, multi consec. sell signals, long-term neg. mkt RS |
| Comment |
|---|
| AMG Affiliated Managers Group R ($112.13) - Wall Street - We will now lower our buy stop to $125.50, the second potential sell signal on AMG's default chart. |
| SEDG Solaredge Technologies R ($35.81) - Machinery and Tools - We will now lower our buy stop to $42, the second potential buy signal on SEDG's default chart. |
| EQT EQT Corporation R ($20.17) - Gas Utilities - EQT had a share adjustment in Tuesday's trading as a result of a corporate action, we will abide by a $31 buy stop moving forward. The first potential buy signal on EQT's default chart. |
| LOW Lowe's Companies, Inc. R ($95.22) - Building - LOW triggered our stop when it violated its trend line in Tuesday's trading. The next level of support now lies at $92. Earnings are expected 11/20. |
UGI U G I Corp Holding Co R ($57.60) - Gas Utilities - UGI is a 5 for 5'er that ranks in the top quintile of the Gas Utilities sector matrix. UGI gave its third consecutive buy signal when it broke a triple top in Monday's trading, reaching a new all-time high. The stock has been consistently bullish, having been on a market RS buy signal for more than 13 years. A recent flip to positive weekly momentum indicates the potential for additional upside from here. The stock also offers a 1.8% yield. UGI is actionable in the $54 - $59 range and we will set our initial stop loss at $50, which would take out two levels of support on UGI's default chart. We will use the bullish price objective, $77, as our target price.
| 09 | 10 | 11 | 12 | 13 | 14 | 15 | 16 | 17 | 18 | ||||||||||||||||||||||||||||||||||||||||||||
| 58.00 | x | 58.00 | |||||||||||||||||||||||||||||||||||||||||||||||||||
| 57.00 | X | 57.00 | |||||||||||||||||||||||||||||||||||||||||||||||||||
| 56.00 | A | X | B | 56.00 | |||||||||||||||||||||||||||||||||||||||||||||||||
| 55.00 | X | O | X | O | X | 55.00 | |||||||||||||||||||||||||||||||||||||||||||||||
| 54.00 | X | X | O | X | O | X | Mid | 54.00 | |||||||||||||||||||||||||||||||||||||||||||||
| 53.00 | 7 | O | X | O | O | 53.00 | |||||||||||||||||||||||||||||||||||||||||||||||
| 52.00 | 6 | 6 | O | X | 52.00 | ||||||||||||||||||||||||||||||||||||||||||||||||
| 51.00 | X | O | X | X | 8 | 51.00 | |||||||||||||||||||||||||||||||||||||||||||||||
| 50.00 | X | X | O | X | O | X | 50.00 | ||||||||||||||||||||||||||||||||||||||||||||||
| 49.00 | 3 | O | X | O | X | O | 5 | Bot | 49.00 | ||||||||||||||||||||||||||||||||||||||||||||
| 48.00 | X | 2 | O | X | 7 | 8 | X | 48.00 | |||||||||||||||||||||||||||||||||||||||||||||
| 47.00 | 9 | O | 1 | 5 | X | 9 | X | 47.00 | |||||||||||||||||||||||||||||||||||||||||||||
| 46.00 | 8 | O | X | X | O | 1 | 4 | 46.00 | |||||||||||||||||||||||||||||||||||||||||||||
| 45.00 | X | O | X | O | X | 2 | X | 45.00 | |||||||||||||||||||||||||||||||||||||||||||||
| 44.00 | 6 | A | X | O | X | O | X | 44.00 | |||||||||||||||||||||||||||||||||||||||||||||
| 43.00 | X | O | B | X | O | 43.00 | |||||||||||||||||||||||||||||||||||||||||||||||
| 42.00 | 5 | O | 42.00 | ||||||||||||||||||||||||||||||||||||||||||||||||||
| 41.00 | 4 | 41.00 | |||||||||||||||||||||||||||||||||||||||||||||||||||
| 40.00 | X | • | 40.00 | ||||||||||||||||||||||||||||||||||||||||||||||||||
| 39.00 | C | X | • | 39.00 | |||||||||||||||||||||||||||||||||||||||||||||||||
| 38.00 | X | O | 3 | • | 38.00 | ||||||||||||||||||||||||||||||||||||||||||||||||
| 37.00 | A | O | X | B | X | • | 37.00 | ||||||||||||||||||||||||||||||||||||||||||||||
| 36.00 | 9 | 2 | 5 | O | A | O | X | • | 36.00 | ||||||||||||||||||||||||||||||||||||||||||||
| 35.00 | 8 | O | 4 | O | X | O | 2 | • | 35.00 | ||||||||||||||||||||||||||||||||||||||||||||
| 34.00 | 7 | O | X | 8 | X | O | X | • | 34.00 | ||||||||||||||||||||||||||||||||||||||||||||
| 33.00 | 6 | 3 | X | O | C | X | • | 33.00 | |||||||||||||||||||||||||||||||||||||||||||||
| 32.00 | 5 | O | O | • | 32.00 | ||||||||||||||||||||||||||||||||||||||||||||||||
| 31.00 | 4 | • | 31.00 | ||||||||||||||||||||||||||||||||||||||||||||||||||
| 30.00 | 3 | • | 30.00 | ||||||||||||||||||||||||||||||||||||||||||||||||||
| 29.00 | 1 | • | 29.00 | ||||||||||||||||||||||||||||||||||||||||||||||||||
| 28.00 | 5 | 7 | • | 28.00 | |||||||||||||||||||||||||||||||||||||||||||||||||
| 27.00 | X | O | X | • | 27.00 | ||||||||||||||||||||||||||||||||||||||||||||||||
| 26.00 | 4 | O | X | • | 26.00 | ||||||||||||||||||||||||||||||||||||||||||||||||
| 25.00 | 3 | 6 | • | 25.00 | |||||||||||||||||||||||||||||||||||||||||||||||||
| 24.00 | 2 | • | 24.00 | ||||||||||||||||||||||||||||||||||||||||||||||||||
| 23.00 | • | 1 | • | 23.00 | |||||||||||||||||||||||||||||||||||||||||||||||||
| 22.00 | 1 | • | A | • | 22.00 | ||||||||||||||||||||||||||||||||||||||||||||||||
| 21.00 | C | O | • | • | • | X | • | 21.00 | |||||||||||||||||||||||||||||||||||||||||||||
| 20.00 | X | O | 9 | • | B | • | X | • | 7 | • | 20.00 | ||||||||||||||||||||||||||||||||||||||||||
| 19.50 | A | 8 | X | O | X | O | X | O | 4 | • | 19.50 | ||||||||||||||||||||||||||||||||||||||||||
| 19.00 | X | X | O | X | O | X | O | 2 | O | X | • | 19.00 | |||||||||||||||||||||||||||||||||||||||||
| 18.50 | 6 | O | 8 | X | 7 | O | X | O | X | C | X | 3 | X | • | 18.50 | ||||||||||||||||||||||||||||||||||||||
| 18.00 | 4 | O | X | O | 2 | 4 | O | 6 | O | X | O | X | 1 | X | O | • | 18.00 | ||||||||||||||||||||||||||||||||||||
| 17.50 | X | 7 | X | O | X | O | 7 | 3 | O | X | O | • | O | X | O | • | • | 17.50 | |||||||||||||||||||||||||||||||||||
| 17.00 | X | O | 9 | X | O | X | O | 2 | 5 | X | • | A | X | • | 17.00 | ||||||||||||||||||||||||||||||||||||||
| 16.50 | O | 1 | O | 6 | O | X | O | • | O | • | 16.50 | ||||||||||||||||||||||||||||||||||||||||||
| 16.00 | A | B | X | C | O | 4 | A | X | • | • | 16.00 | ||||||||||||||||||||||||||||||||||||||||||
| 15.50 | O | X | X | X | O | X | O | X | 3 | X | B | • | 15.50 | ||||||||||||||||||||||||||||||||||||||||
| 15.00 | O | X | O | X | O | X | O | X | O | X | O | X | • | 15.00 | |||||||||||||||||||||||||||||||||||||||
| 14.50 | O | X | O | X | O | X | O | • | O | • | O | • | 14.50 | ||||||||||||||||||||||||||||||||||||||||
| 14.00 | O | X | O | O | • | • | • | • | 14.00 | ||||||||||||||||||||||||||||||||||||||||||||
| 13.50 | O | X | • | • | 13.50 | ||||||||||||||||||||||||||||||||||||||||||||||||
| 13.00 | O | X | • | 13.00 | |||||||||||||||||||||||||||||||||||||||||||||||||
| 12.50 | O | • | 12.50 | ||||||||||||||||||||||||||||||||||||||||||||||||||
| 09 | 10 | 11 | 12 | 13 | 14 | 15 | 16 | 17 | 18 |
| Comments |
|---|
| AAP Advance Auto Parts, Inc. ($182.17) - Autos and Parts - Following a morning earnings report, AAP rose 10% intraday Tuesday, breaking a double top at $176 and reaching a new all-time high at $184. This 3 for 5'er ranks 2nd out of 54 names in the Autos and Parts sector RS matrix, and has been in a positive trend since January. The bullish price objective of $190 indicates the potential for further price appreciation. Those looking to add exposure may want to wait for a pullback as AAP is entering overbought territory. Initial support can be found at $168. |
| CLB Core Laboratories N.V. ($81.35) - Oil Service - CLB broke a spread triple bottom at $82, marking a new multi-year low. This 1 for 5'er moved to a negative trend in October and ranks in the bottom quintile of the Oil Service sector RS matrix. The bearish price objective of $76 indicates the potential for further price decline from here. Long exposure should be avoided. |
| DRQ Dril-Quip ($39.50) - Oil Service - DRQ completed a bearish catapult pattern on Tuesday at $40 just one day after down ticking to a 1 for 5’er. In October, this stock moved into a negative trend and experienced a flip to negative monthly momentum. The technical picture is weak. Avoid. |
| HP Helmerich & Payne, Inc. ($58.73) - Oil Service - HP broke a spread quadruple bottom at $60 and moved lower to $59. This stock is a weak 2 for 5’er within the Oil Service sector that moved into a negative trend in late October. Additionally, weekly momentum has been negative for four weeks, suggesting the potential for lower prices. Avoid. Note earnings are expected on 11/16. Final near-term support lies at $58, the July low. |
| MGLN Magellan Health Inc. ($57.83) - Healthcare - MGLN broke a double bottom at $61 and moved lower to $58 with Tuesday’s intraday action. This is the sixth consecutive sell signal for this 1 for 5’er within the unfavored Healthcare sector. In addition, MGLN ranks in the bottom decile of the sector RS matrix, confirming its weakness relative to its peers. Avoid as there is no remaining support on the chart. |
| PETS PetMed Express, Inc. ($27.05) - Retailing - PETS moved lower Tuesday to break a double bottom at $27, marking a new 52-week low. This 0 for 5'er moved to a negative trend in March and ranks in the bottom quartile of names in the Retailing sector RS matrix. Long positions should be avoided. Those looking for short ideas should note that PETS carries a 3.97% yield. Further support can be found at $19.50, the 2017 low, with overhead resistance coming in at $33. |
| PSMT PriceSmart, Inc. ($67.20) - Retailing - PSMT broke a triple bottom at $67 on Tuesday and is now trading at new 52 week lows. This recent sell signal marked the fourth consecutive on the chart, confirming that supply is in control. PSMT is a 0 for 5’er within the Retailing sector. Avoid. |
| RCKT Rocket Pharmaceuticals Inc. ($14.68) - Biomedics/Genetics - RCKT broke a double bottom at $15 on Tuesday, marking the third consecutive sell signal on the chart. This stock is a weak 2 for 5’er within the Biomedics/Genetics sector that moved into a negative trend in early October. In addition, monthly momentum has been negative for two months, suggesting the potential for lower prices. Avoid. Further support is offered at $14, the April low. |
| SAGE SAGE Therapeutics Inc. ($111.15) - Drugs - SAGE broke a double bottom at $118 and moved lower to $110 with Tuesday’s market action. This stock is a weak 1 for 5’er that is showing both long and near term weakness relative to the market. In addition, SAGE moved into a negative trend in mid-September and ranks 43rd out of 51 names in the sector RS matrix. Avoid. |
| TLYS Tilly's Inc ($16.63) - Retailing - TLYS broke a triple bottom at $16 and is now trading in a negative trend. This is the third consecutive sell signal for the 2 for 5’er within the Retailing sector. Supply is in control. Avoid. Further support is offered at $14.50. |
| Name | Option Symbol | Action | Stop Loss |
|---|---|---|---|
| UnitedHealth Group Incorporated - $269.22 | O:UNH 19C250.00D15 | Buy the March 250.00 calls at 27.50 | 252.00 |
| Name | Option | Action |
|---|---|---|
| CME Group, Inc. ( CME) | Jan. 170.00 Calls | Stopped at 17.10 (CP: 16.40) |
| Name | Option Symbol | Action | Stop Loss |
|---|---|---|---|
| Harley-Davidson, Inc. - $41.60 | O:HOG 19N45.00D15 | Buy the February 45.00 puts at 5.05 | 48.00 |
| Name | Option | Action |
|---|---|---|
| The Hain Celestial Group, Inc. (HAIN) | Nov. 30.00 Puts | Raise the option stop loss to 5.70 (CP: 7.70) |
| Schlumberger Limited (SLB) | Jan. 65.00 Puts | Raise the option stop loss to 15.85 (CP: 17.85) |
| Tyson Foods, Inc. (TSN) | Jan. 65.00 Puts | Initiate an option stop loss of 5.00 (CP: 7.00) |
| Name | Option Sym. | Call to Sell | Call Price | Investment for 500 Shares | Annual Called Rtn. | Annual Static Rtn. | Downside Protection |
|---|---|---|---|---|---|---|---|
| Paypal Holdings Inc $83.78 | O:PYPL 19B85.00D15 | Feb. 85.00 | 5.50 | $39,758.10 | 22.67% | 22.48% | 5.47% |
| Name | Action |
|---|---|
| Shoe Carnival Inc (SCVL) - 40.56 | Sell the March 45.00 Calls. |
| Spirit Airlines Inc (SAVE) - 52.96 | Sell the March 55.00 Calls. |
| Xilinx, Inc. (XLNX) - 82.33 | Sell the March 90.00 Calls. |
| Dick's Sporting Goods, Inc. (DKS) - 37.45 | Sell the March 40.00 Calls. |
| Kohl's Corporation (KSS) - 80.75 | Sell the January 85.00 Calls. |
| Name | Covered Write |
|---|---|
|
|
|
Daily Equity & Market Analysis
Loading, Please Wait...

Create Portfolio