Most Requested Symbols

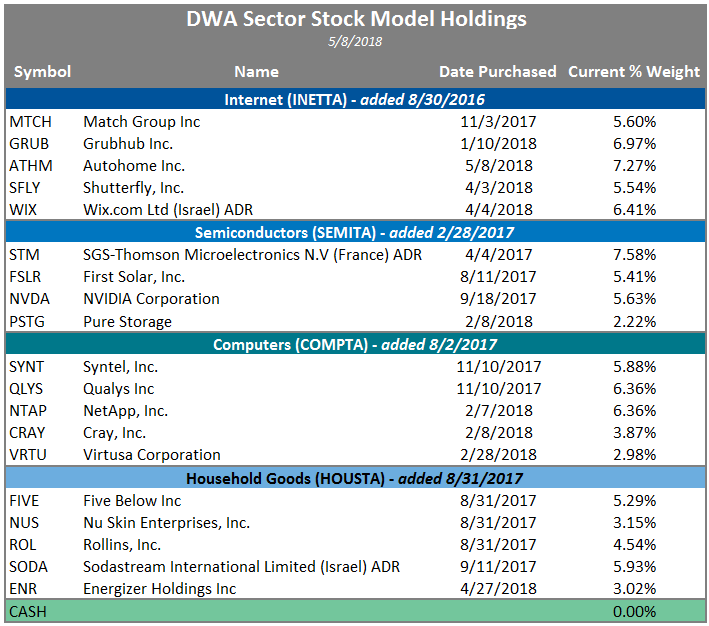
As a result of trading on 5/8/18, there was a change to the DWA Sector Stock Model STOCKMODEL. Note, in order to be able to view this model on the platform, you will need the matrix subscription. The change was within the Internet Sector Portfolio where Mercadolibre, Inc. MELI was removed because it's relative strength deteriorated enough in the matrix to warrant its removal. In it's place, the model added Autohome Inc. ATHM; ATHM. The stock broke a triple top in Tuesday's trading and bullish price objective of $116 suggests that there is potential for additional upside from here. Through the close on 5/8, the STOCKMODEL has gained 12.98% on the year, while the S&P 500 Index SPX is flat, down -0.06%.

Each week the analysts at DWA review and comment on all major asset classes in the global markets. Shown below is the summary or snapshot of the primary technical indicators we follow for multiple areas. Should there be changes mid-week we will certainly bring these to your attention via the report.
| Universe | BP Col & Level (actual) | BP Rev Level | PT Col & Level (actual) | PT Rev Level | HiLo Col & Level (actual) | HiLo Rev Level | 10 Week Col & Level (actual) | 10 Week Rev Level | 30 Week Col & Level (actual) | 30 Week Rev Level |
|---|---|---|---|---|---|---|---|---|---|---|
| ALL |
|
50% |
|
58% |
|
42% |
|
46% |
|
50% |
| NYSE |
|
44% |
|
62% |
|
46% |
|
48% |
|
48% |
| OTC |
|
52% |
|
58% |
|
46% |
|
44% |
|
44% |
| World |
|
46% |
|
52% |
|
|
|
42% |
|
44% |
Volatility has certainly picked up in the market over the past few months; however, US Equities remains the number one ranked asset class in DALI. Specifically, Growth, from an investment style perspective, and Technology, from a sector perspective continue to lead their respective groups. So, we would continue to view these areas as the current leaders in the market. However, the Energy sector has recently been the biggest mover to the upside and is an area that warrants your attention today.
Most of the headlines you will read are about Crude Oil (CL/) hitting $70 a barrel for the first time since 2014. What you will not hear is that the Point & Figure chart of Crude Oil moved back into a positive trend in July 2017 at $50 and has remained positive ever since. The improvement in Energy has not been confined to this commodity, it has spilled over to the equity markets, driving improvement in oil-related stocks as well.
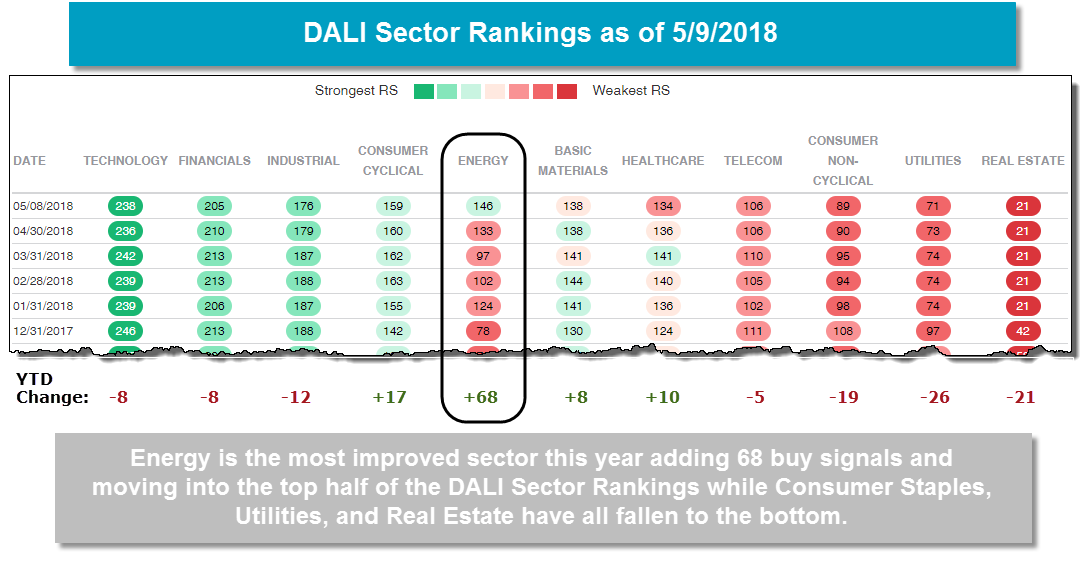
For the first time in over a year, the broad Energy sector has moved into the top half of the DALI Sector Rankings and is by far the most improved sector this year.
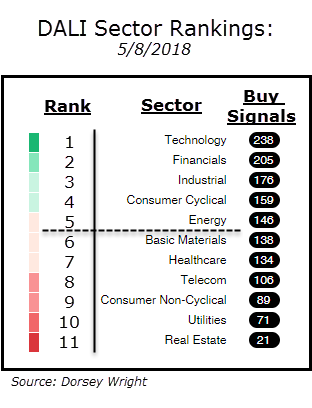
Over the course of this year, the Energy sector has added 68 tally buy signals. This is, by far, the most improvement out of all the broad sectors. The second most improved sector has been Consumer Cyclicals (+17 buy signals). On the other hand, the Utilities, Real Estate, and Consumer Staples sectors all have been the biggest movers to the downside and are currently the three lowest ranked sectors in the DALI Sector Rankings.

| Symbol | Name | Price | Yield | Trend | RS Signal | RS Col. | Score | 200 Day MA | Weekly Mom |
| DIA | SPDR Dow Jones Industrial Average ETF Trust | 243.42 | 2.02 | Positive | X | 3.44 | 237.85 | +3W | |
| EFA | iShares MSCI EAFE ETF | 70.95 | 2.54 | Positive | Sell | O | 2.76 | 69.63 | +5W |
| FRN | PowerShares Frontier Markets ETF | 15.45 | 3.49 | Positive | Sell | X | 4.01 | 15.20 | -7W |
| IJH | iShares S&P MidCap 400 Index Fund | 191.22 | 1.27 | Positive | Buy | X | 4.39 | 184.60 | +3W |
| IJR | iShares S&P SmallCap 600 Index Fund | 80.12 | 1.17 | Positive | Buy | X | 5.53 | 75.20 | +3W |
| QQQ | PowerShares QQQ Trust | 166.07 | 0.79 | Positive | Buy | X | 5.63 | 155.58 | +2W |
| RSP | PowerShares S&P 500 Equal Weight ETF | 99.93 | 1.62 | Positive | Buy | X | 4.51 | 98.54 | +3W |
| SPY | SPDR S&P 500 ETF Trust | 266.92 | 1.82 | Positive | O | 2.72 | 261.49 | +3W | |
| VWO | Vanguard FTSE Emerging Markets ETF | 45.31 | 2.37 | Positive | Sell | O | 4.58 | 45.64 | -8W |
| XLG | PowerShares S&P 500 Top 50 ETF | 190.12 | 1.84 | Positive | O | 2.58 | 186.04 | +3W |
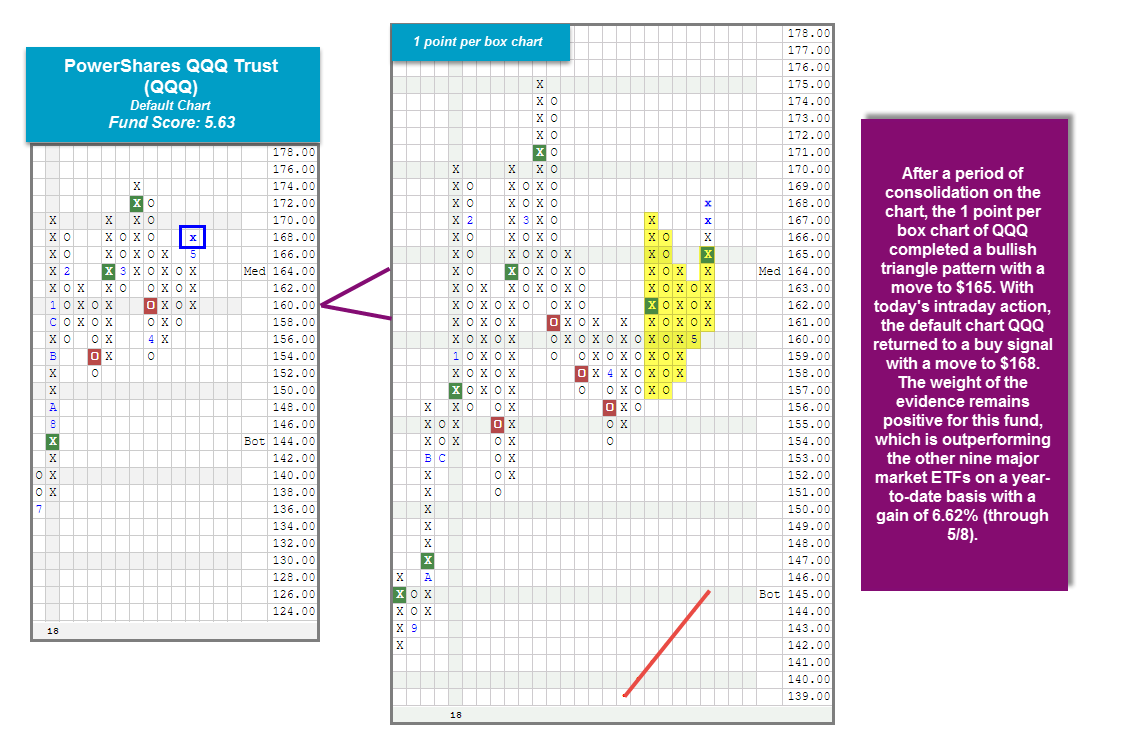
It was a mostly positive week (5/1 – 5/8) for the 10 major market ETFs covered in this report, as eight were able to finish up while just two finished in the red. The biggest mover to the downside this week was once again the PowerShares Frontier Markets ETF FRN while the biggest gainer was the iShares S&P SmallCap 600 Index Fund IJR. On a year-to-date basis, the PowerShares QQQ Trust QQQ continues to lead the pack in terms of performance with a gain of 6.62% (through 5/8). In fact, just this past week, we witnessed the more sensitive 1 point per box chart for the QQQ return to a Point & Figure buy signal as it successfully completed a bullish triangle with a move to $165. With today's (5/9) market action, demand continues to have the upper hand as QQQ was able to push higher and returned to a Point & Figure buy signal on its default chart with a move to $168. The fund continues to trade well above its bullish support line and offers an impressive fund score of 5.63 with a positive score direction of 0.51. At this juncture, QQQ remains near the middle of the 10 week trading band with an OBOS% reading of 10% and recently experienced a flip back to positive weekly momentum, suggesting the potential for higher prices. All in all, the weight of technical evidence remains positive for QQQ and new positions are welcome on this breakout. Looking to the default chart, the first sell signal from here would come with a move to $156, while further support is offered in the mid- $150s.
(The DWA Technical Indicator link, found under the Indicators menu, provides valuable insight into where positive relative strength readings and positive trend charts are concentrated. RSX is the percentage of stocks within a sector whose relative strength charts are in a column of Xs. RSP is the percentage of stocks within a sector whose relative strength charts are on a buy signal. PT is the percentage of stocks within a sector that are trading above their bullish support lines and the overall trend is positive. The strongest sectors, i.e. market leaders, will have most of these indicators positive and moving higher in a column of Xs.)
Over the past week of trading, 11 sector BP charts moved higher while 10 moved lower. BPBUIL, BPINET, and BPSEMI all reversed up into Xs while BPAUTO, BPINSU, and BPPROT reversed down into Os. At this juncture, the BP for the Machinery and Tools sector is 1% away from a reversal up into Xs while the BP for the Textiles/Apparel sector is 1% away from a reversal down into Os. The average sector BP level this week is 46.85%, up 0.37% from last week. There were five shifts on the Favored Sector Spectrum that are listed below:
| Bear Confirmed | Bear Correction | Bull Correction | Bull Confirmed |
|---|---|---|---|
| Protection Safety Eq (42 O) | Semiconductors (46 X) | Insurance (50 O) | Restaurants (70 X) |
| Autos & Parts (44 O) | Internet (48 X) | ||
| Building (50 X) |
| To Xs | To Os |
|---|---|
| Machinery and Tools ( 0.04 to 42 ) | Textiles / Apparel ( 0.83 to 70 ) |
The average Bullish Percent reading this week is 46.85% up 0.37% from the previous week
| 0-14 | 16-20 | 22-26 | 28-32 | 34-36 | 38-42 | 44-46 | 48-52 | 54-56 | 58-62 | 64-66 | 68-72 | 74-78 | 80-86 | 88-100 |
 |
||||||||||||||
| Sector |
|---|
| Household Goods (24%) - Bear Confirmed |
| Sector |
|---|
| Building (50%) - Bear Correction |
| Utilities / Electric (50%) - Bear Correction |
| Foods Beverages/Soap (48%) - Bear Correction |
| Utilities / Gas (46%) - Bear Correction |
| Internet (48%) - Bear Correction |
| Oil Service (46%) - Bull Alert |
| Precious Metals (30%) - Bull Alert |
| Real Estate (48%) - Bear Correction |
| Retailing (50%) - Bear Correction |
| Semiconductors (46%) - Bear Correction |
| Transports / Non Air (44%) - Bear Correction |
| Sector |
|---|
| Banks (66%) - Bear Confirmed |
| Insurance (50%) - Bull Correction |
| Leisure (50%) - Bear Confirmed |
| Savings & Loans (50%) - Bear Confirmed |
PERCENT RELATIVE STRENGTH & POSITIVE TREND UPDATE
(The DWA Technical Indicator link, found under the Database tab, provides valuable insight into where positive relative strength readings and positive trend charts are concentrated. RSX is the percentage of stocks within a sector whose relative strength charts are in a column of Xs. RSP is the percentage of stocks within a sector whose relative strength charts are on a buy signal. PT is the percentage of stocks within a sector that are trading above their bullish support lines and the overall trend is positive. The strongest sectors, i.e. market leaders, will have most of these indicators positive and moving higher in a column of Xs.)
|
|
| ^PT Charts Reversing Up - | ^PT Charts Reversing Down - |
|
|
|
| ^PT Charts Moving Higher - | ^PT Charts Moving Lower - |
|
|
| ^RSX Charts Reversing Up - | ^RSX Charts Reversing Down - |
|
|
| ^RSX Charts Moving Higher - | ^RSX Charts Moving Lower - |
|
|
| ^RSP Charts Reversing Up - | ^RSP Charts Reversing Down - |
|
|
|
| ^RSP Charts Moving Higher - | ^RSP Charts Moving Lower - |
|
|
|
FAVORED SECTORS LIST
Favored Sectors are those that have three of the four charts (Relative Strength, RSX, RSP, and PT) positive. The table below contains those sectors which changed their favored status over the past week. It is best to focus on those sectors that are about 50% or lower on their Bullish Percent Readings and in a column of Xs on the bullish percent chart. Should a sector move from Favored to Average, that doesn't mean the sector has to be sold.
| Changes since 05/02/2018 | Full Report |
|
|
|
|
|||||||
|
|
|
|
|
|
|||||
|
|
|
|
|
|
|||||
|
|
|
|
|
|
|||||

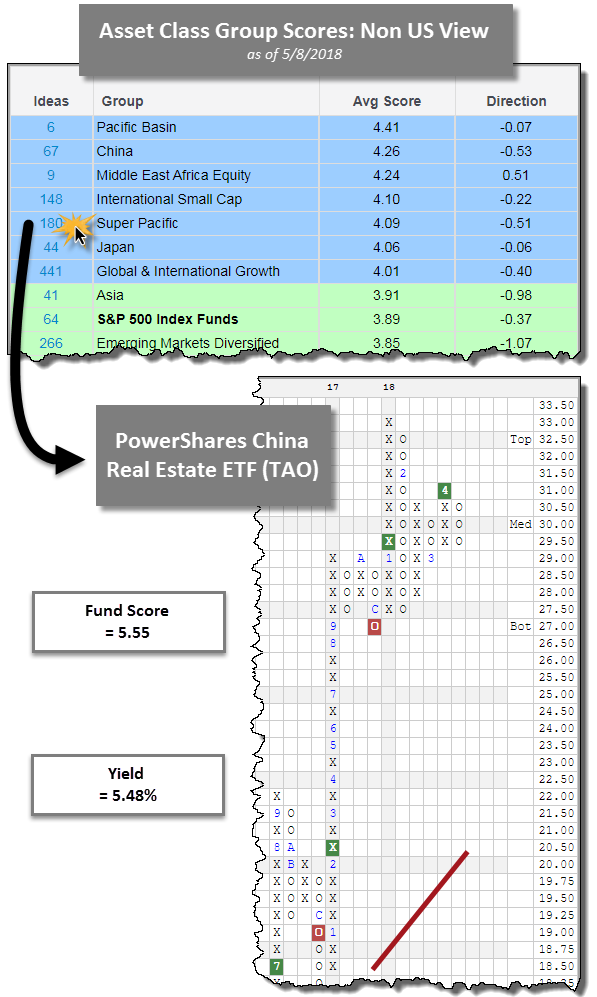
Those of you seeking exposure to more confined areas of the market, rather than just broad exposure may find tools like the Asset Class Group Scores page (found under the Indicators tab) useful. At the top of the page, we are able to check the box for Non-US and click the Set View button beneath the menu to be presented with a list of groups sorted from highest to lowest average score. Remember, this page aggregates data from every mutual fund and ETF in our database and calculates the arithmetic mean in order to produce the average score column. We tend to focus on our attention on the groups that are colored blue, as they offer an average score above 4 (recall our fund score rankings range from 0-6, with 6 being the best). What could arguably be one of the more overlooked functions on this page is its ability to assist you with idea generation. Notice the column to the left of the group name titled "Ideas". The number in this column, next to the group name, corresponds to the number of ideas available for each group. For example, if we were to click 180 next to Super Pacific, we are presented with a list of ETFs and Mutual Funds that fall into this category sorted by fund score from highest to lowest. One of the names that caught our attention from this list was the PowerShares China Real Estate ETF TAO.
The ETF offers an impressive fund score of 5.55, which tops the average Real Estate (2.55), All China (4.26), and All Global & International (3.60) scores. In addition, TAO comes with a score direction of 1.23 indicating its improvement over the past six months. So far this year, it has gained 4.78% (through 5/8) which puts it within the 100th percentile of Real Estate funds and within the top decile of all funds in our database. What is even more noticeable, is the fact that it also provides a yield of 5.48%, which is not incorporated into the performance figures referenced. TAO also comes with a bullish price objective of $45.50 suggesting it has potential to move higher from here. Those seeking exposure to International Equities with a sector twist may consider TAO at current levels as it is currently on a buy signal and trades near the middle of its 10-week trading band. Those with exposure to this fund already have support visible in the upper $20’s too.
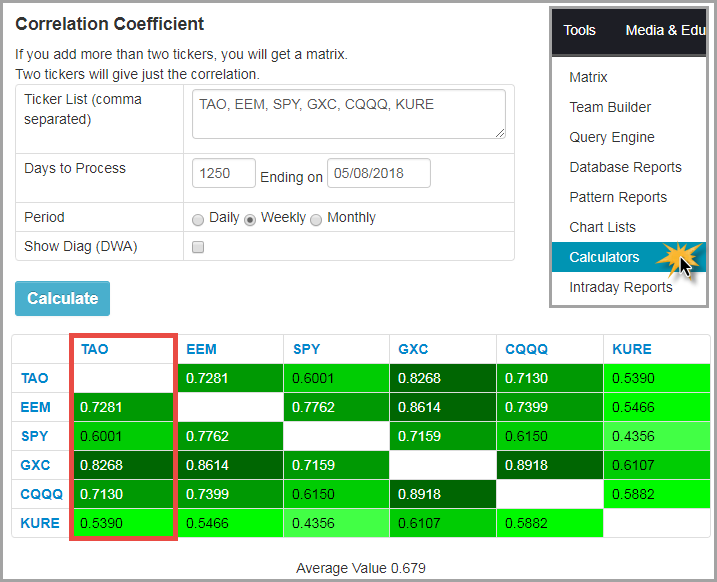
Another potentially attractive aspect of TAO is that it is not necessarily highly correlated to other International and Chinese ETFs. Recall that correlation is a statistical measurement describing the relationship between two variables. Correlations can range from +1.0 (perfect positive correlation) to -1.0 (perfect inverse correlation), with most outcomes residing in the middle. A correlation of 0.0 would indicate that there is no relationship between the two variables over the time frame studied. A correlation of -1.0, or perfect negative correlation, suggests one variable consistently goes up when the other goes down. A correlation of +1.0, or perfect positive correlation, indicates that the variables move in unison. In order to perform this task on the Dorsey Wright platform, users may hover over the Tools tab at the top of the page and then click Calculators. From there, select Correlation Coefficient on the left hand side. Upon doing so, you will be presented with the image below. Simply enter the tickers you wish to compare separated by comma. Then choose the amount of days you would like to look back. We choose 1250 because that is the equivalent of five years worth of data. After clicking calculate, the table will appear. Here we can see how TAO behaves relative to other funds. Here is a legend of the other funds included in the table:
This may be helpful to see that TAO will not necessarily mirror the returns or behavior of other Chinese related funds like GXC, CQQQ, or KURE. This provides portfolios with more diversification with a chance to also produce income for the portfolio.
On Monday (5/7/18), we saw US Preferreds & Convertibles moved ahead of International Debt to take the number one spot in the DALI Fixed Income rankings. This change is directly related to another recent development – strengthening in of the U.S. dollar.
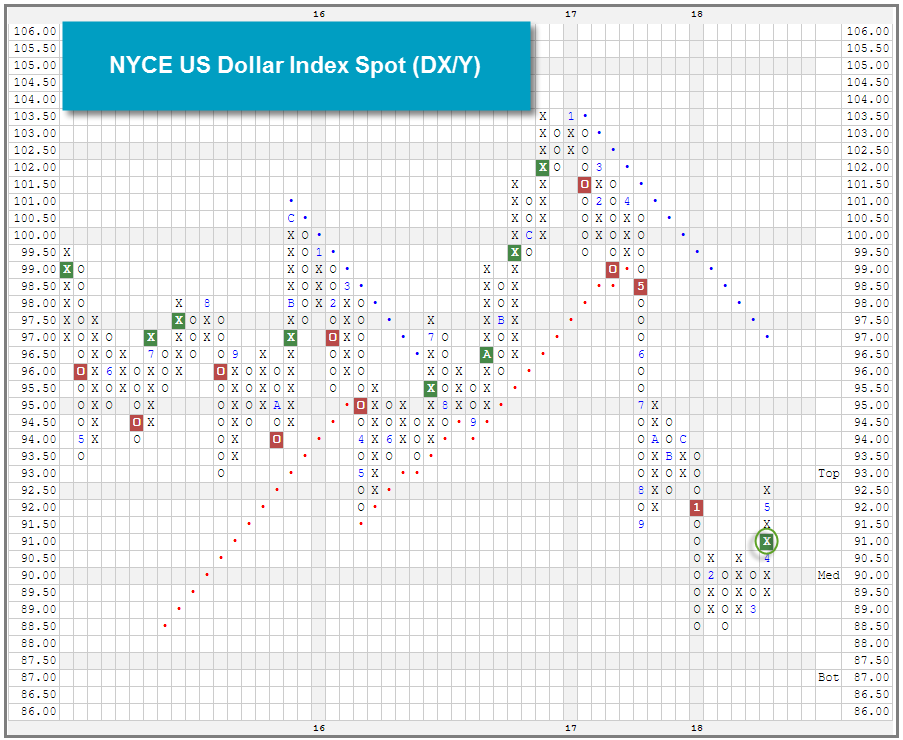
After hitting a multi-year low in February, the NYCE U.S. Dollar Spot Index DX/Y, reversed up late last month, broke a triple top, and currently sits at a 2018 high on its default chart. If this trend of a strengthening dollar continues, it may present something of a conundrum for fixed income investors – as we’ve been in a rising interest rate environment over the last several months, foreign bonds have been an area of relative safety as they are fairly insensitive to changes in domestic rates. However, the performance of foreign bonds is significantly impacted by changes in the U.S. dollar – in fact, currency return is often the largest component of the total return on foreign fixed income investments. Therefore, if we continue the U.S. dollar strengthen, investors may have fewer attractive rate-insensitive fixed income options.
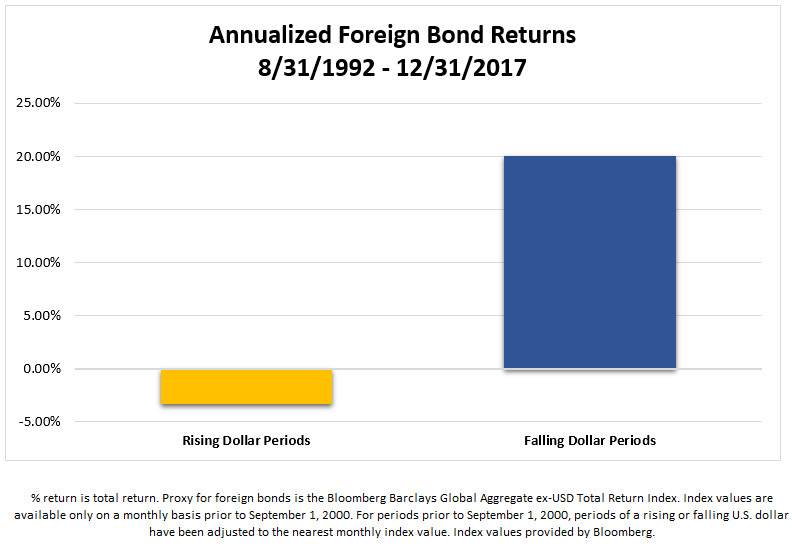
We have already begun to see the rising dollar’s effects in the Asset Class Group Scores. Over the last 30 days, the six groups with the largest score deterioration are Emerging Market Income, Global Currency, and four global income groups.

Remember, these are technical comments only. Just as you must be aware of fundamental data for the stocks we recommend based on technical criteria in the report, so too must you be aware of important data regarding delivery, market moving government releases, and other factors that may influence commodity pricing. We try to limit our technical comments to the most actively traded contracts in advance of delivery, but some contracts trade actively right up to delivery while others taper off well in advance. Be sure you check your dates before trading these contracts. For questions regarding this section or additional coverage of commodities email ben.jones@dorseywright.com.
Data represented in the table below is through 05/07/18:
Broad Market Commodities Report
| Symbol | Name | Price | Trend | RS Signal | RS Col. | 200 Day MA | Weekly Mom |
| CL/ | Crude Oil Continuous | 69.72 | Positive | Buy | X | 57.60 | +5W |
| DBLCIX | Deutsche Bank Liquid Commodities Index | 366.05 | Negative | Sell | O | 336.15 | +8W |
| DWACOMMOD | DWA Continuous Commodity Index | 479.57 | Positive | Sell | O | 464.43 | +4W |
| GC/ | Gold Continuous | 1314.70 | Negative | Buy | X | 1306.75 | -3W |
| GN/Y | S&P GSCI Index Spot | 477.01 | Positive | Sell | X | 425.61 | +5W |
| HG/ | Copper Continuous | 3.04 | Positive | Buy | X | 3.07 | +4W |
| ZG/ | Corn (Electronic Day Session) Continuous | 395.50 | Positive | Sell | X | 359.52 | -5W |
| Links to Additional Summaries |
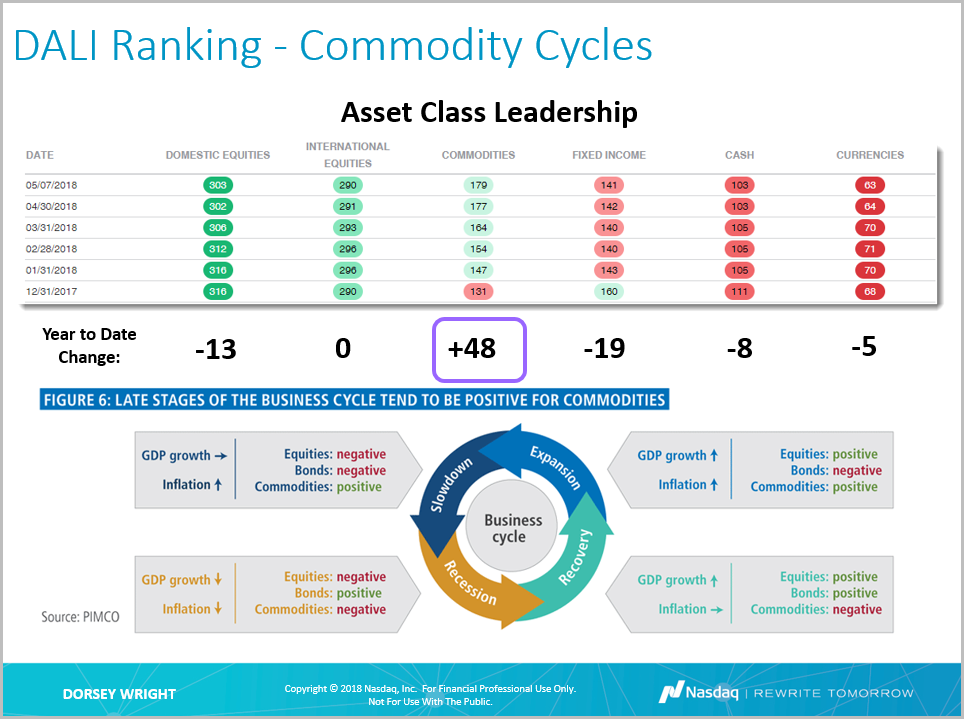
When looking at the market from a macro level this year, using the DALI Asset Class Ranking, we find that the Commodities asset class is the most improved asset class by a wide a margin. In the graphic below, we display the current DALI Tally Signal Ranking, along with monthly snapshots going back to beginning of the year. You can create a similar view using the 'History" function in the DALI Tool. When we calculate which areas have strengthened or weakened this year, we find that Commodities is the only asset class that has gained signals. In addition, it appears that all of the other asset classes have lost signals because of Commodities. Year-to-date, Commodities has gained +48 new signals, and in effect, has seen its tally signal count rise from 131 to 179. Domestic Equities, which remains in first place, lost -13 signals, dropping from 316 to 303. International Equities is flat, but it has lost 6 signals since its reached 296 at the end of February. Fixed Income has lost the most number of signals, down -19, while Cash and Currencies are down -8 and -5, respectively. That said, while Commodities has gained +48 signals, it still has a lot of ground to make up. Domestic Equities and International Equities lead Commodities by over 100 signals, so while Commodities has strengthened, it has not strengthened enough in the ranking to affect many of our asset allocation models based on DALI.
Commodities has benefited from a weaker US Dollar DX/Y, rising Crude Oil prices, and even an uptick in inflation expectations. It's also important to note that we may be entering a period that favors Commodities due to our position on the business cycle. According to PIMCO, Commodities displays positive returns in both expansion and slowdown periods. While the debate is still ongoing over which part of the cycle we're in, they both favor Commodities. From a performance standpoint, over the past five years (5/8/2013-5/9/2013), Commodities has struggled relative to equities and even bonds. The WisdomTree Continuous Commodity Index Fund GCC, which often serves as a proxy benchmark for the Commodity asset class, is down -29.07% over the past five years. Meanwhile, the S&P 500 Index ETF SPY is up 63.65%. This type of performance is fairly typical in recovery periods, however, if the recovery has shifted to expansion or maybe skipped to slowdown, Commodities may be an asset class that can continue participating in the upside. In all, given the improvement in Commodities, we'll continue to monitor this asset class for opportunities going forward.
The Distribution Report below places Major Market ETFs and Indices into a bell curve style table based upon their current location on their 10-week trading band. The middle of the bell curve represents areas of the market that are "normally" distributed, with the far right being 100% overbought on a weekly distribution and the far left being 100% oversold on a weekly distribution. The weekly distribution ranges are calculated at the end of each week, while the placement within that range will fluctuate during the week. In addition to information regarding the statistical distribution of these market indexes, a symbol that is in UPPER CASE indicates that the RS chart is on a Buy Signal. If the symbol is dark Green then the stock is on a Point & Figure buy signal, and if the symbol is bright Red then it is on a Point & Figure sell signal. Box Color indicates the Sector Status Rating. Green = Favored, Yellow = Average, and Red = Unfavored.
The average Bullish Percent reading this week is 46.85% up 0.37% from the previous week
| <--100 | -100--80 | -80--60 | -60--40 | -40--20 | -20-0 | 0-20 | 20-40 | 40-60 | 60-80 | 80-100 | 100-> | |||
|
||||||||||||||
| Symbol | Name | Symbol | Name |
| AGG | iShares US Core Bond ETF | NASD | Nasdaq Composite |
| CL/ | Crude Oil Continuous | NDX | NASDAQ-100 Index |
| DJIA | Dow Jones Industrial Average | RSP | Guggenheim S&P 500 Equal Weight ETF |
| DVY | iShares Dow Jones Select Dividend Index | RUT | Russell 2000 Index |
| DX/Y | NYCE U.S.Dollar Index Spot | SHY | iShares Barclays 1-3 Year Tres. Bond Fund |
| EFA | iSharesMSCI EAFE Index Fund | SML | S&P 600 Small Cap Index |
| FXE | CurrencyShares Euro Trust | SPX | S & P 500 Index |
| GC/ | Gold Continuous | TLT | iShares Barclays 20+ Year Treasury Bond Fund |
| GSG | iShares S&P GSCI Commodity-Indexed Trust | UV/Y | Continuous Commodity Index |
| HYG | iShares iBoxx $ High Yield Corporate Bond ETF | VOOG | Vanguard S&P 500 Growth ETF |
| ICF | iShares Cohen & Steers Realty Index | VOOV | Vanguard S&P 500 Value ETF |
| IEF | iShares Barclays 7-10 Yr. Tres. Bond Fund | VWO | Vanguard FTSE Emerging Markets ETF |
| LQD | iShares iBoxx $ Investment Grade Corp. | XLG | Guggenheim S&P 500 Top 50 ETF |
| MID | S&P 400 MidCap Index |
In the Optionable Universe, this week we saw 22 relative strength buy signals compared to 18 last week. On the sell side, there were 7 relative strength sell signals compared to 10 last week.
| Symbol | Company | Sector | Price | RS vs Market Signal | RS vs Market Column | RS vs Peer Signal | RS vs Peer Column | Trend |
|---|---|---|---|---|---|---|---|---|
| FTR | Frontier Communications Corporation | Fixed Line Communications | 9.780 | Buy | X | Buy | X | 4 |
| DGII | Digi International Inc | Communications Technology | 12.300 | Buy | X | Sell | X | 3 |
| ITGR | Greatbatch Technologies, Inc. | Industrial Goods & Svcs | 65.550 | Buy | X | Buy | X | 5 |
| GHL | Greenhill & Co. | Financial Services | 25.450 | Buy | X | Sell | X | 4 |
| HZO | Marinemax | Retail | 23.300 | Buy | X | Sell | X | 4 |
| AVAV | Aerovironment, Inc. | Industrial Goods & Svcs | 60.970 | Buy | X | Buy | X | 5 |
| GTS | Triple-S Management Corporation | Insurance | 30.560 | Buy | X | Sell | X | 4 |
| CATM | Cardtronics PLC | Financial Services | 30.290 | Buy | X | Buy | X | 4 |
| KFRC | Kforce.Com | Industrial Goods & Svcs | 33.100 | Buy | X | Buy | X | 5 |
| XCRA | Xcerra Corp. | Semiconductors | 13.240 | Buy | X | Buy | X | 5 |
| MRO | Marathon Oil Corporation | Oil Companies Major | 20.440 | Buy | X | Buy | X | 5 |
| FOXA | Twenty-First Century Fox Inc. | Media | 37.990 | Buy | X | Buy | X | 5 |
| OAS | Oasis Petroleum Inc. | Oil Companies Major | 11.540 | Buy | X | Sell | X | 3 |
| NGVC | Natural Grocers by Vitamin Cottage Inc | Food and Beverage | 9.580 | Buy | X | Buy | X | 4 |
| SNP | China Petroleum and Chemical Corporation (China) ADR | Oil Companies Major | 98.160 | Buy | X | Buy | X | 5 |
| ZBRA | Zebra Technologies Corp | Industrial Goods & Svcs | 153.240 | Buy | X | Buy | X | 5 |
| SSW | Seaspan Corp. | Industrial Goods & Svcs | 8.780 | Buy | X | Buy | X | 4 |
| CHRS | Coherus Biosciences Inc | Biotechnology | 15.250 | Buy | X | Buy | X | 5 |
| GWPH | GW Pharmaceuticals PLC (United Kingdom) ADR | Pharmaceuticals | 144.560 | Buy | X | Buy | X | 5 |
| DNOW | NOW Inc. | Oil Companies Major | 14.270 | Buy | X | Sell | X | 4 |
| SHAK | Shake Shack Inc | Cyclical Goods and Services | 59.360 | Buy | X | Buy | X | 5 |
| GKOS | Glaukos Corp. | Medical Products | 35.690 | Buy | X | Buy | X | 5 |
| Symbol | Company | Sector | Price | RS vs Market Signal | RS vs Market Column | RS vs Peer Signal | RS vs Peer Column | Trend |
|---|---|---|---|---|---|---|---|---|
| CRESY | Cresud S.A.C.I.F.y A. (Argentina) ADR | Food and Beverage | 16.470 | Sell | O | Buy | O | 1 |
| LCII | LCI Industries | Construction | 89.650 | Sell | O | Sell | O | 0 |
| PZE | Petrobras Energia S.A. (Argentina) ADR | Oil Companies Secondary | 9.620 | Sell | O | Sell | O | 1 |
| PPC | Pilgrim's Pride Corporation | Food and Beverage | 21.160 | Sell | O | Buy | O | 2 |
| ESPR | Esperion Therapeutics Inc | Biotechnology | 40.490 | Sell | O | Sell | O | 0 |
| ATUS | Altice USA, Inc. Class A | Media | 16.430 | Sell | O | N/A | O | 0 |
| AMRX | Amneal Pharmaceuticals Inc Class A | Pharmaceuticals | 14.710 | Sell | O | Sell | O | 0 |
| Comments |
|---|
| ABMD Abiomed, Inc ($358.16) - Healthcare - ABMD broke a double top at $356 and moved higher to $360 with Wednesday’s market action, marking a new all-time high. This stock is a perfect 5 for 5’er as all of its trending and RS characteristics are positive here. Additionally, weekly momentum has been positive for two weeks, suggesting the potential for higher prices from here. Okay to hold here or buy on a pullback as ABMD is overbought here. Near-term support lies at $340. |
| BIO Bio-Rad Laboratories, Inc. Cl. A ($276.42) - Healthcare - BIO broke a double top at $268 and went on further to break a spread triple top at $280 to mark a new high. The 3 for 5'er ranks in the top of the Healthcare sector matrix as well. Those interested in long exposure may initiate positions here or on a pullback. Support is offered throughout the $230s and $240s. |
| CAR Avis Budget Group, Inc. ($41.58) - Retailing - CAR broke a double bottom at $42. This is the second consecutive sell signal for the stock and it provides further confirmation of strength in supply as the stock also still trades below its bearish resistance line. Those with long exposure should exit positions here and avoid CAR moving forward. No new positions at this time. |
| CLR Continental Resources Inc. ($68.45) - Oil - CLR broke a triple top at $67 and continued higher intraday to $68. The stock now trades at multi-year highs, offers all five positive technical attributes, and ranks in the top decile of the favored Oil sector matrix. Those interested in long exposure are best served to initiate positions on a pullback from here since the stock trades at the top of its 10-week trading band. The first sign of trouble comes with a move to $62, a triple bottom break. |
| EPAM Epam Systems Inc ($123.36) - Software - EPAM broke a double top at $120, which completes a bullish triangle pattern following a positive earnings release. The stock continued higher intraday to test its peak from March at $124. The 5 for 5'er ranks in the top third of the favored Software sector and recently flipped to positive weekly momentum suggesting the potential for further price appreciation from here. New positions may be initiated at current levels. Several support levels are offered between $104 and $112. |
| FTNT Fortinet Inc. ($58.65) - Software - FTNT broke a double top at $58, the stocks fourth consecutive buy signal and new all-time high. The stock offers a technical attribute score of 5 and ranks in the top quartile of the favored Software sector matrix. New positions may be initiated on this breakout. Support is offered between $52 and $54 from here. |
| MTDR Matador Resources Company ($34.19) - Oil - MTDR completed a second consecutive buy signal on the chart with a move to $35. This stock is a perfect 5 for 5’er that has maintained a positive trend since August 2016. MTDR is within the favored Oil sector and is a current holding in the DWA Oil Sector Portfolio, confirming its strength relative to its peers. Okay to hold here or buy on a pullback. From here, support lies at $31 while the bullish support line lies at $28. |
| NICE Nice Systems LTD (Israel) ADR ($98.12) - Telephone - NICE broke a spread quadruple top with a move to $99 on Wednesday. This stock has all of its trending and RS attributes in its favor, making it a perfect 5 for 5’er. Weekly momentum has been positive for two weeks, suggesting the potential for higher prices. Additionally, NICE has a price target of $117, adding to the positive technical picture. Okay to buy or hold here as the technical picture is healthy. The first level of support lies at $94 while the bullish support line lies at $89. |
| PSTG Pure Storage ($23.13) - Semiconductors - PSTG broke a double top at $23 and is now trading at new all-time highs. This stock is a strong 4 for 5’er within the Semiconductors sector that ranks 3rd out of 61 names in the sector RS matrix. Monthly momentum just flipped positive, suggesting the potential for higher prices. Demand is in control here and the technical weight of the evidence is positive. From here, significant support lies at $18.50. Note earnings are slated for 5/22. |
| RNG RingCentral, Inc. ($73.20) - Telephone - RNG completed a bullish catapult with a move to $73 after a positive reaction to earnings on Wednesday. This stock is a perfect 5 for 5’er with in the Telephone sector that is the #1 ranked stock in the sector RS matrix. Weekly momentum just flipped positive, suggesting the potential for higher prices. Okay to initiate new positions on the breakout. From here, the first sell signal would come with a move to $68. |
| Name | Option Symbol | Action | Stop Loss |
|---|---|---|---|
| CSX Corporation - $62.25 | O:CSX 18H57.50D17 | Buy the August 57.50 calls at 6.45 | 57.00 |
| Name | Option | Action |
|---|---|---|
| Chevron Corporation ( CVX) | Jun. 115.00 Calls | Raise the option stop loss to 11.50 (CP: 13.50) |
| E*trade Group, Inc. ( ETFC) | Jul. 50.00 Calls | Raise the option stop loss to 12.20 (CP: 14.20) |
| The Charles Schwab Corporation ( SCHW) | Sep. 50.00 Calls | Raise the option stop loss to 7.70 (CP: 9.70) |
| Cisco Systems, Inc. ( CSCO) | Sep. 39.00 Calls | Raise the option stop loss to 5.60 (CP: 7.60) |
| Louisiana-Pacific Corporation ( LPX) | Aug. 29.00 Calls | Stopped at 27.00 (CP: 26.91) |
| MSCI Inc. ( MSCI) | Jun. 140.00 Calls | Raise the option stop loss to 14.50 (CP: 16.50) |
| Red Hat, Inc. ( RHT) | Sep. 155.00 Calls | Raise the option stop loss to 20.80 (CP: 22.80) |
| Palo Alto Networks Inc ( PANW) | Sep. 185.00 Calls | Initiate an option stop loss of 28.60 (CP: 30.60) |
| Adobe Systems Incorporated ( ADBE) | Sep. 220.00 Calls | Raise the option stop loss to 27.80 (CP: 29.80) |
| Name | Option Symbol | Action | Stop Loss |
|---|---|---|---|
| Edison International - $60.42 | O:EIX 18V65.00D19 | Buy the October 65.00 puts at 6.70 | 67.00 |
| Name | Option | Action |
|---|---|---|
| Capital One Financial Corporation (COF) | Sep. 95.00 Puts | Stopped at 7.10 (CP: 6.55) |
| Perrigo Co. PLC (PRGO) | Aug. 85.00 Puts | Raise the option stop loss to 10.10 (CP: 12.10) |
| Perrigo Co. PLC (PRGO) | Nov. 85.00 Puts | Raise the option stop loss to 11.20 (CP: 13.20) |
| Name | Option Sym. | Call to Sell | Call Price | Investment for 500 Shares | Annual Called Rtn. | Annual Static Rtn. | Downside Protection |
|---|---|---|---|---|---|---|---|
| Activision Blizzard, Inc. $69.61 | O:ATVI 18H72.50D17 | Aug. 72.50 | 4.00 | $34,031.55 | 19.97% | 17.41% | 4.55% |
| Name | Action |
|---|---|
| Urban Outfitters, Inc. (URBN) - 39.01 | Sell the September 43.00 Calls. |
| Weight Watchers International, Inc. (WTW) - 69.53 | Sell the October 75.00 Calls. |
| Guess Inc. (GES) - 23.21 | Sell the September 25.00 Calls. |
| Name | Covered Write |
|---|---|
| Deckers Outdoor Corporation ( DECK - 96.19 ) | September 97.50 covered write. |
| Axon Enterprise Inc. ( AAXN - 44.65 ) | September 45.00 covered write. |
| Continental Resources Inc. ( CLR - 66.22 ) | September 67.50 covered write. |
Daily Equity & Market Analysis
Loading, Please Wait...

Create Portfolio