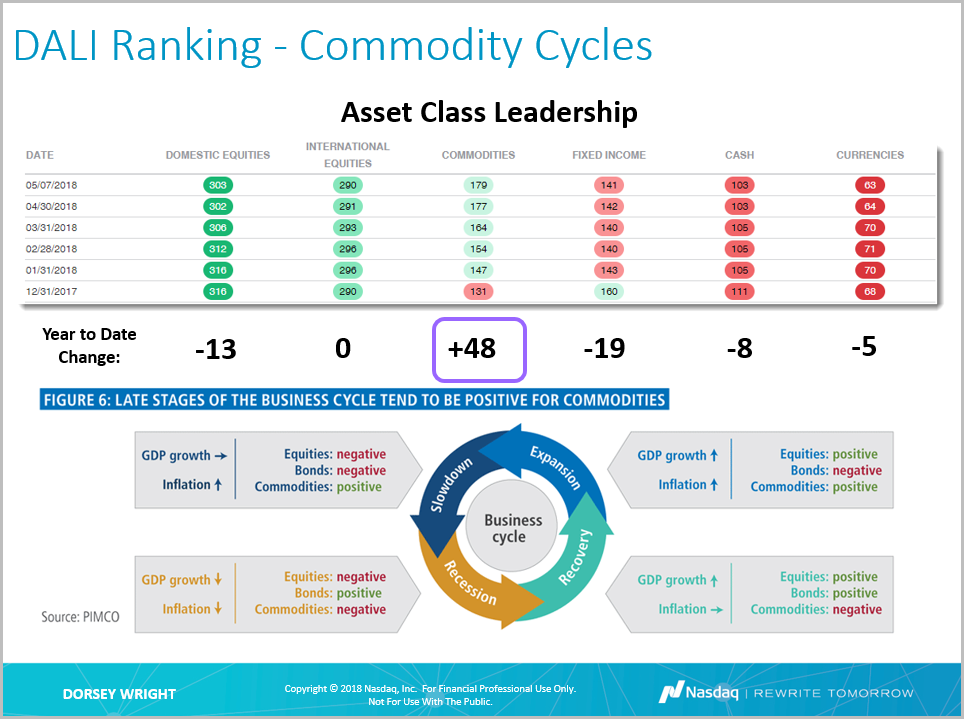
When looking at the market from a macro level this year, using the DALI Asset Class Ranking, we find that the Commodities asset class is the most improved asset class by a wide a margin. In the graphic below, we display the current DALI Tally Signal Ranking, along with monthly snapshots going back to beginning of the year.
Remember, these are technical comments only. Just as you must be aware of fundamental data for the stocks we recommend based on technical criteria in the report, so too must you be aware of important data regarding delivery, market moving government releases, and other factors that may influence commodity pricing. We try to limit our technical comments to the most actively traded contracts in advance of delivery, but some contracts trade actively right up to delivery while others taper off well in advance. Be sure you check your dates before trading these contracts. For questions regarding this section or additional coverage of commodities email ben.jones@dorseywright.com.
Data represented in the table below is through 05/07/18:
Broad Market Commodities Report
Portfolio View - Commodity Indices
| Symbol | Name | Price | Trend | RS Signal | RS Col. | 200 Day MA | Weekly Mom |
| CL/ | Crude Oil Continuous | 69.72 | Positive | Buy | X | 57.60 | +5W |
| DBLCIX | Deutsche Bank Liquid Commodities Index | 366.05 | Negative | Sell | O | 336.15 | +8W |
| DWACOMMOD | DWA Continuous Commodity Index | 479.57 | Positive | Sell | O | 464.43 | +4W |
| GC/ | Gold Continuous | 1314.70 | Negative | Buy | X | 1306.75 | -3W |
| GN/Y | S&P GSCI Index Spot | 477.01 | Positive | Sell | X | 425.61 | +5W |
| HG/ | Copper Continuous | 3.04 | Positive | Buy | X | 3.07 | +4W |
| ZG/ | Corn (Electronic Day Session) Continuous | 395.50 | Positive | Sell | X | 359.52 | -5W |
| Links to Additional Summaries |
When looking at the market from a macro level this year, using the DALI Asset Class Ranking, we find that the Commodities asset class is the most improved asset class by a wide a margin. In the graphic below, we display the current DALI Tally Signal Ranking, along with monthly snapshots going back to beginning of the year. You can create a similar view using the 'History" function in the DALI Tool. When we calculate which areas have strengthened or weakened this year, we find that Commodities is the only asset class that has gained signals. In addition, it appears that all of the other asset classes have lost signals because of Commodities. Year-to-date, Commodities has gained +48 new signals, and in effect, has seen its tally signal count rise from 131 to 179. Domestic Equities, which remains in first place, lost -13 signals, dropping from 316 to 303. International Equities is flat, but it has lost 6 signals since its reached 296 at the end of February. Fixed Income has lost the most number of signals, down -19, while Cash and Currencies are down -8 and -5, respectively. That said, while Commodities has gained +48 signals, it still has a lot of ground to make up. Domestic Equities and International Equities lead Commodities by over 100 signals, so while Commodities has strengthened, it has not strengthened enough in the ranking to affect many of our asset allocation models based on DALI.
Commodities has benefited from a weaker US Dollar DX/Y, rising Crude Oil prices, and even an uptick in inflation expectations. It's also important to note that we may be entering a period that favors Commodities due to our position on the business cycle. According to PIMCO, Commodities displays positive returns in both expansion and slowdown periods. While the debate is still ongoing over which part of the cycle we're in, they both favor Commodities. From a performance standpoint, over the past five years (5/8/2013-5/9/2013), Commodities has struggled relative to equities and even bonds. The WisdomTree Continuous Commodity Index Fund GCC, which often serves as a proxy benchmark for the Commodity asset class, is down -29.07% over the past five years. Meanwhile, the S&P 500 Index ETF SPY is up 63.65%. This type of performance is fairly typical in recovery periods, however, if the recovery has shifted to expansion or maybe skipped to slowdown, Commodities may be an asset class that can continue participating in the upside. In all, given the improvement in Commodities, we'll continue to monitor this asset class for opportunities going forward.