Utilizing the Asset Class Group Scores page for idea generation
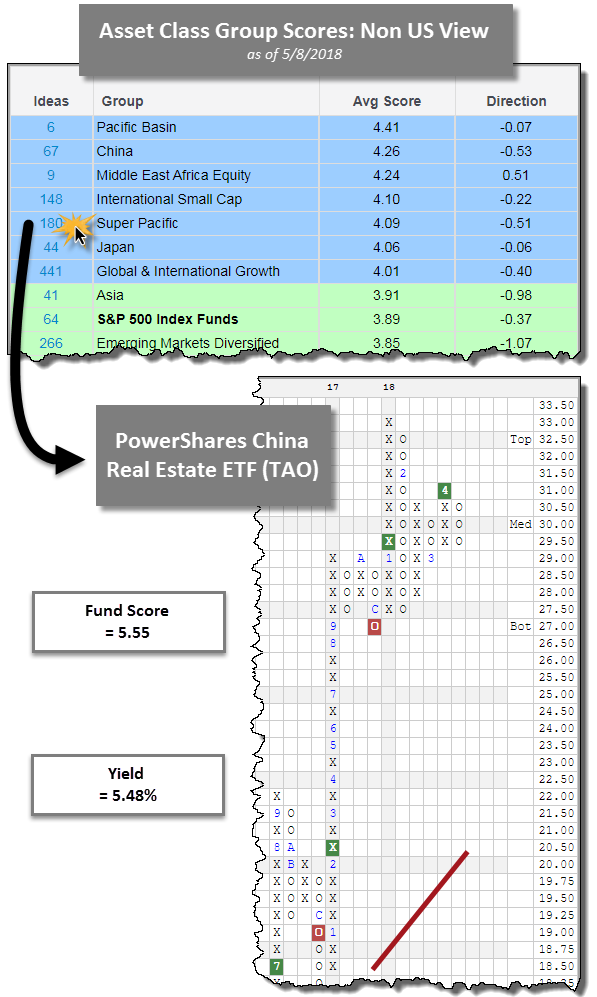
Those of you seeking exposure to more confined areas of the market, rather than just broad exposure may find tools like the Asset Class Group Scores page (found under the Indicators tab) useful. At the top of the page, we are able to check the box for Non-US and click the Set View button beneath the menu to be presented with a list of groups sorted from highest to lowest average score. Remember, this page aggregates data from every mutual fund and ETF in our database and calculates the arithmetic mean in order to produce the average score column. We tend to focus on our attention on the groups that are colored blue, as they offer an average score above 4 (recall our fund score rankings range from 0-6, with 6 being the best). What could arguably be one of the more overlooked functions on this page is its ability to assist you with idea generation. Notice the column to the left of the group name titled "Ideas". The number in this column, next to the group name, corresponds to the number of ideas available for each group. For example, if we were to click 180 next to Super Pacific, we are presented with a list of ETFs and Mutual Funds that fall into this category sorted by fund score from highest to lowest. One of the names that caught our attention from this list was the PowerShares China Real Estate ETF TAO.
The ETF offers an impressive fund score of 5.55, which tops the average Real Estate (2.55), All China (4.26), and All Global & International (3.60) scores. In addition, TAO comes with a score direction of 1.23 indicating its improvement over the past six months. So far this year, it has gained 4.78% (through 5/8) which puts it within the 100th percentile of Real Estate funds and within the top decile of all funds in our database. What is even more noticeable, is the fact that it also provides a yield of 5.48%, which is not incorporated into the performance figures referenced. TAO also comes with a bullish price objective of $45.50 suggesting it has potential to move higher from here. Those seeking exposure to International Equities with a sector twist may consider TAO at current levels as it is currently on a buy signal and trades near the middle of its 10-week trading band. Those with exposure to this fund already have support visible in the upper $20’s too.
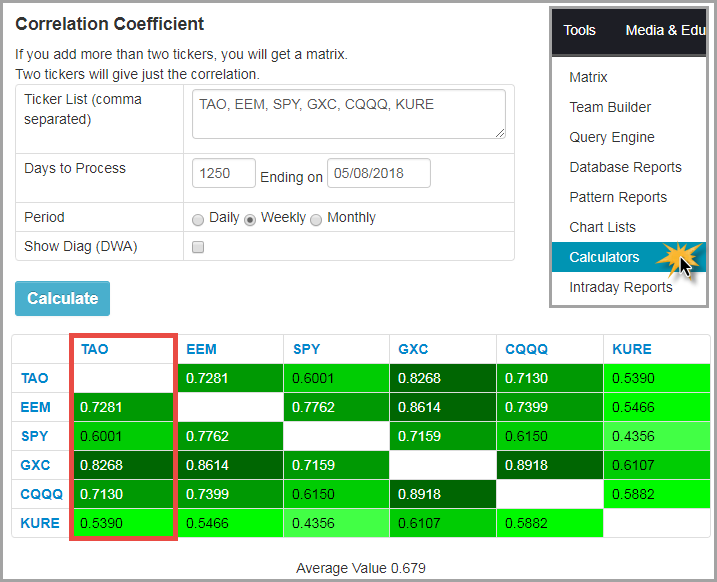
Another potentially attractive aspect of TAO is that it is not necessarily highly correlated to other International and Chinese ETFs. Recall that correlation is a statistical measurement describing the relationship between two variables. Correlations can range from +1.0 (perfect positive correlation) to -1.0 (perfect inverse correlation), with most outcomes residing in the middle. A correlation of 0.0 would indicate that there is no relationship between the two variables over the time frame studied. A correlation of -1.0, or perfect negative correlation, suggests one variable consistently goes up when the other goes down. A correlation of +1.0, or perfect positive correlation, indicates that the variables move in unison. In order to perform this task on the Dorsey Wright platform, users may hover over the Tools tab at the top of the page and then click Calculators. From there, select Correlation Coefficient on the left hand side. Upon doing so, you will be presented with the image below. Simply enter the tickers you wish to compare separated by comma. Then choose the amount of days you would like to look back. We choose 1250 because that is the equivalent of five years worth of data. After clicking calculate, the table will appear. Here we can see how TAO behaves relative to other funds. Here is a legend of the other funds included in the table:
- iShares MSCI Emerging Markets ETF EEM
- SPDRs S&P 500 ETF Trust SPY
- SPDR S&P China ETF GXC
- Guggenheim China Technology ETF CQQQ
- KraneShares MSCI All China Health Care Index ETF KURE
This may be helpful to see that TAO will not necessarily mirror the returns or behavior of other Chinese related funds like GXC, CQQQ, or KURE. This provides portfolios with more diversification with a chance to also produce income for the portfolio.