Most Requested Symbols

Participants will learn:
The new Oppenheimer US Revenue Model is Nasdaq Dorsey Wright's first value-oriented portfolio model, which may provide advisors with a more balanced approach to their equity allocation -- especially for those who are currently overweight other style factors, such as growth.
Speakers:
*Nasdaq is registered with the CFA Institute as a Sponsored Provider of Live CE Programs for CFA Charterholders.
Please join Ben Jones on Tuesday, May 8, 2018 in Oklahoma City and Tulsa for a discussion on "Technical Perspectives – Review of Trends and Relative Strength across Global Markets." There will also be speakers from Riskalyze and First Trust and their discussions will focus on the Riskalyze Platform, the AutoPilot investment tool, as well as an update on Fixed Income. CE Credits are available.
Space is limited, so please RSVP today. To RSVP, please contact: Steve Martin (630) 765-8688 or stevemartin@ftadvisors.com.
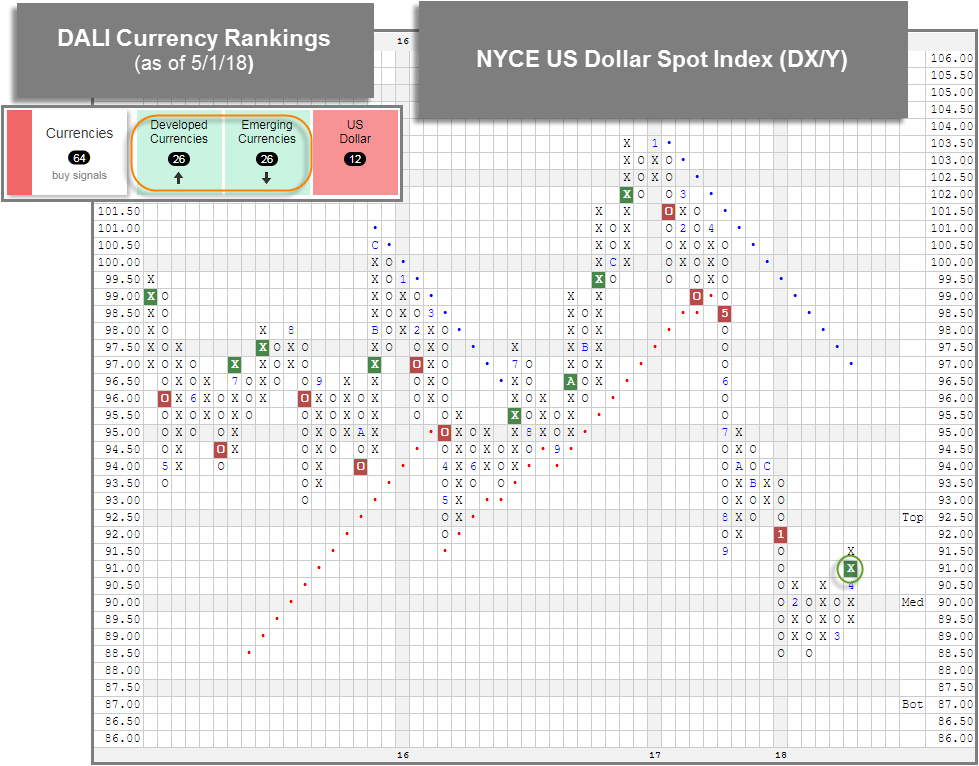
With trading on Tuesday (5/1), Emerging Currencies fell below Developed in the DALI currency rankings. Emerging Currencies had held the top spot since February. Currently, both Developed and Emerging, sit at 26 buy signals, however, as Developed holds the #1 rank as it currently has a higher X rank. Interestingly, this change did not come about because Developed Currencies gained buy signals, instead it was due to Emerging Currencies losing two buy signals to the US Dollar. This is consistent with action we have recently seen in the NYCE US Dollar Spot Index DX/Y. DX/Y recently broke a triple top to reach its highest level since January and is now a buy signal on its default chart for the first time in more than a year. We will be monitoring the 0.25 per box chart more closely in the near term to see if it is able to re-enter a positive trend.

Each week the analysts at DWA review and comment on all major asset classes in the global markets. Shown below is the summary or snapshot of the primary technical indicators we follow for multiple areas. Should there be changes mid-week we will certainly bring these to your attention via the report.
| Universe | BP Col & Level (actual) | BP Rev Level | PT Col & Level (actual) | PT Rev Level | HiLo Col & Level (actual) | HiLo Rev Level | 10 Week Col & Level (actual) | 10 Week Rev Level | 30 Week Col & Level (actual) | 30 Week Rev Level |
|---|---|---|---|---|---|---|---|---|---|---|
| ALL |
|
50% |
|
60% |
|
50% |
|
52% |
|
44% |
| NYSE |
|
44% |
|
62% |
|
50% |
|
56% |
|
44% |
| OTC |
|
52% |
|
58% |
|
56% |
|
50% |
|
44% |
| World |
|
46% |
|
52% |
|
|
|
42% |
|
44% |
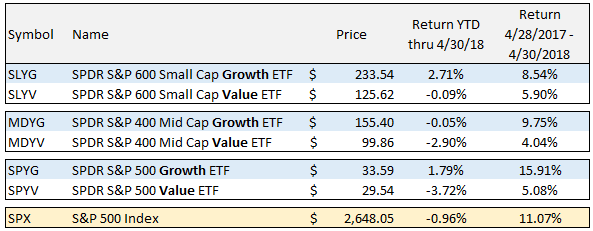
Through the first four months of the year the S&P 500 SPX has been on a bit of a roller coaster ride experiencing new all-time highs in January, the first 10% pullback in two years, a 10% rally, and then experienced another 8% pullback. At the end of the day that ride in the SPX has resulted in a return of --0.96% this year, thru the end of April. While the one main difference in 2018 versus 2017 is the increased level of volatility, one constant has been the leadership of Growth versus Value.
In each of the market cap sizes (Small, Mid, and Large), growth has the upper hand over value with the biggest dispersion coming in Large Growth versus Large Value. YTD (thru April 30th) the SPDR S&P 500 Growth ETF SPYG is up 1.79% versus a return of -3.72% for the SPDR S&P 500 Value ETF SPYV, and when you look at the one year performance comparison that gap is even wider at 15.91% versus 5.08% for Large Growth and Large Value, respectively. In the table below you can see the performance comparison for the nine style boxes for YTD 2018 as well as the trailing 12 months thru the end of the April, and notice in each case the growth style has outperformed value.
A look at the current DALI Size and Style rankings shows that Large Cap Growth is the number one ranked style box, and that has been the case since October 2017. On the other hand, Large Cap Value is ranked last, in 9th position, and that has been the case since March 2009! Additionally, all of the Growth style are currently ranked in the top four spots with Small Growth at number two and Mid Growth at number four.

The DALI Size and Style Rankings offer perspective into the market styles in terms of where the relative strength lies, and it is safe to say the strength, for the past few years, has been in Growth. This idea is exactly what the First Trust Size and Style Model FTSIZESYLE is designed to do, invest in the strongest market style boxes based on their relative strength ranking. Specifically, the FTSIZESTYLE Model owns a First Trust ETF from each the top three Size and Style boxes based on the DALI rankings.
Currently, the FTSIZESTYLE Model holds positions in Large Cap Growth FTC, Small Cap Growth FYC, and Mid Cap Core FNX. So far this year (thru 4/30) the FTSIZESTYLE Model is up 2.32%, compared to a -0.96% return for the S&P 500, and over the past year, ending 4/30, the model is up 15.97% compared to 11.07% for the S&P 500 over the same time period.

| Symbol | Name | Price | Yield | Trend | RS Signal | RS Col. | Score | 200 Day MA | Weekly Mom |
| DIA | SPDR Dow Jones Industrial Average ETF Trust | 240.76 | 2.04 | Positive | X | 3.36 | 237.21 | +2W | |
| EFA | iShares MSCI EAFE ETF | 70.49 | 2.56 | Positive | Sell | O | 2.69 | 69.52 | +4W |
| FRN | PowerShares Frontier Markets ETF | 15.57 | 3.46 | Positive | Sell | X | 4.12 | 15.17 | -6W |
| IJH | iShares S&P MidCap 400 Index Fund | 187.68 | 1.29 | Positive | Buy | X | 3.94 | 184.29 | +2W |
| IJR | iShares S&P SmallCap 600 Index Fund | 78.16 | 1.20 | Positive | Buy | X | 5.37 | 75.01 | +2W |
| QQQ | PowerShares QQQ Trust | 162.78 | 0.80 | Positive | Buy | X | 5.33 | 155.06 | +1W |
| RSP | PowerShares S&P 500 Equal Weight ETF | 99.89 | 1.62 | Positive | Buy | X | 4.61 | 98.41 | +2W |
| SPY | SPDR S&P 500 ETF Trust | 264.98 | 1.84 | Positive | O | 2.51 | 261.02 | +2W | |
| VWO | Vanguard FTSE Emerging Markets ETF | 45.42 | 2.37 | Positive | Sell | O | 4.39 | 45.57 | -7W |
| XLG | PowerShares S&P 500 Top 50 ETF | 188.02 | 1.86 | Positive | O | 2.33 | 185.69 | +2W |
As we enter the month of May, we also move in to what is generally regarded as the "seasonally weak" six month period in the market (from May through October). We have discussed this concept of seasonality in a few of the recent market comments, mainly with respect to some of the model portfolios we track that shift allocation twice a year based on the seasonal periods. These models are designed to balance momentum strategies with low volatility strategies, putting an emphasis on the high momentum portion from November through April and then overweighting low volatility from May through October. With more and more ETFs now available to investors, we wanted to compile a list of the various low volatility or defensive equity ETFs. In the table below there are a total of fourteen ETFs that are categorized in this niche of the market: eight are focused in US equity market segments and the remaining six are global or international equity products. Each product tracks an index that uses various metrics to determine which individual stocks can be considered for inclusion; and as a result, you'll see different returns, yield, fund scores, etc., for each. If you want to read more about the strategies that drive these ETFs, you can visit the respective provider's page for an overview of each.

When looking at the list above, we find that the iShares MSCI USA Minimum Volatility ETF USMV is the largest out of the 11 US equity ETFs with a market cap in excess of $14 million. As its name suggests, the USMV tracks the MSCI USA Minimum Volatility Index, which is designed to reflect, “the performance characteristics of a minimum variance strategy applied to the large and mid cap USA equity universe. The index is calculated by optimizing the MSCI USA Index, its parent index, in USD for the lowest absolute risk (within a given set of constraints). Historically, the index has shown lower beta and volatility characteristics relative to the MSCI USA Index.” (Source: www.ishares.com). Looking to the trend chart below, the ETF shows a long term bullish pattern, as it has given five consecutive buy signals since September 2015, with the last occurring at $51 in October of last year. After reaching a new all-time high at $55 in January, USMV pulled back along with the broader market in February. It has since reversed back up into X's at $53 and is just three boxes away from breaking a double top, as well as reaching a new all-time high. With a fund score of 3.79 coupled with an OBOS% of -10%, the weight of the evidence is positive for USMV, making it a viable option for new positions, especially for those interested in increasing their low vol exposure as we enter the seasonally weak period.

(The DWA Technical Indicator link, found under the Indicators menu, provides valuable insight into where positive relative strength readings and positive trend charts are concentrated. RSX is the percentage of stocks within a sector whose relative strength charts are in a column of Xs. RSP is the percentage of stocks within a sector whose relative strength charts are on a buy signal. PT is the percentage of stocks within a sector that are trading above their bullish support lines and the overall trend is positive. The strongest sectors, i.e. market leaders, will have most of these indicators positive and moving higher in a column of Xs.)
Over the past week of trading, six sector BP charts moved higher while nine moved lower. There were not any reversals up into Xs however there were five (BPAERO, BPELEC, BPFORE, BPINET, and BPMACH) that reversed down into Os. The average sector BP level this week is 46.48%, down 1.61% from last week. There were four shifts on the favored sector spectrum, three of which were to the downside. The following sectors are now average, down from favored: Machinery and Tools, Internet, and Computers. Oil Service remains unfavored but gained a sector attribute in its favor.
| Bear Confirmed |
|---|
| Machinery and Tools (38 O) |
| Internet (40 O) |
| Forest Prods/Paper (46 O) |
| Electronics (38 O) |
| Aerospace Airline (48 O) |
| To Xs | To Os |
|---|
The average Bullish Percent reading this week is 46.48% down 1.61% from the previous week
| 0-14 | 16-20 | 22-26 | 28-32 | 34-36 | 38-42 | 44-46 | 48-52 | 54-56 | 58-62 | 64-66 | 68-72 | 74-78 | 80-86 | 88-100 |
 |
||||||||||||||
| Sector |
|---|
| None |
| Sector |
|---|
| Autos & Parts (50%) - Bear Correction |
| Utilities / Electric (48%) - Bear Correction |
| Foods Beverages/Soap (48%) - Bear Correction |
| Utilities / Gas (46%) - Bear Correction |
| Oil Service (44%) - Bull Alert |
| Precious Metals (30%) - Bull Alert |
| Protection Safety Eq (50%) - Bull Alert |
| Real Estate (46%) - Bear Correction |
| Retailing (50%) - Bear Correction |
| Transports / Non Air (42%) - Bear Correction |
| Waste Management (48%) - Bear Correction |
| Sector |
|---|
| Banks (66%) - Bear Confirmed |
| Leisure (50%) - Bear Confirmed |
| Savings & Loans (50%) - Bear Confirmed |
PERCENT RELATIVE STRENGTH & POSITIVE TREND UPDATE
(The DWA Technical Indicator link, found under the Database tab, provides valuable insight into where positive relative strength readings and positive trend charts are concentrated. RSX is the percentage of stocks within a sector whose relative strength charts are in a column of Xs. RSP is the percentage of stocks within a sector whose relative strength charts are on a buy signal. PT is the percentage of stocks within a sector that are trading above their bullish support lines and the overall trend is positive. The strongest sectors, i.e. market leaders, will have most of these indicators positive and moving higher in a column of Xs.)
|
|
| ^PT Charts Reversing Up - | ^PT Charts Reversing Down - |
|
|
| ^PT Charts Moving Higher - | ^PT Charts Moving Lower - |
|
|
|
|
| ^RSX Charts Reversing Up - | ^RSX Charts Reversing Down - |
|
|
|
| ^RSX Charts Moving Higher - | ^RSX Charts Moving Lower - |
|
|
| ^RSP Charts Reversing Up - | ^RSP Charts Reversing Down - |
|
|
|
| ^RSP Charts Moving Higher - | ^RSP Charts Moving Lower - |
FAVORED SECTORS LIST
Favored Sectors are those that have three of the four charts (Relative Strength, RSX, RSP, and PT) positive. The table below contains those sectors which changed their favored status over the past week. It is best to focus on those sectors that are about 50% or lower on their Bullish Percent Readings and in a column of Xs on the bullish percent chart. Should a sector move from Favored to Average, that doesn't mean the sector has to be sold.
| Changes since 04/25/2018 | Full Report |
|
|
|
|
||||||
|
|
|
|
|
|
||||
|
|
|
|
|
|
||||
|
|
|
|
|
|
||||

Last Thursday (4/26) we witnessed a change within the sub-asset rankings of the International Equities asset class in our DALI tool. Asia-Pacific Emerging fell below Asia-Pacific Developed. Both remain in the top three, but Developed Asia now sits in the 2nd spot. International Equities as an asset class has remained steady as a whole, but this is roughly the sixth change within the sub-asset class emphasis that we have encountered this year. One way for you all to gather a list of ideas in light of these changes or to hone in on a particular region is through the DALI Ideas function. To access this list (shown in the image below) simply click on a region like Asia-Pacific Developed. From there, you will be presented with a list of ETFs and/or Mutual Funds sorted by fund score that you may peruse. When we click on the list today, it is heavily populated with Japanese funds. Not only are we able to see the fund scores but also score direction (improvement/deterioration over the short-term), “OBOS” (overbought/oversold reading), and rRisk (its risk/volatility versus the S&P 500 Index SPX). You may click on the symbol to open the Point & Figure chart for the fund, as an example, we'll take a look at the iShares MSCI Japan Small Cap ETF SCJ.
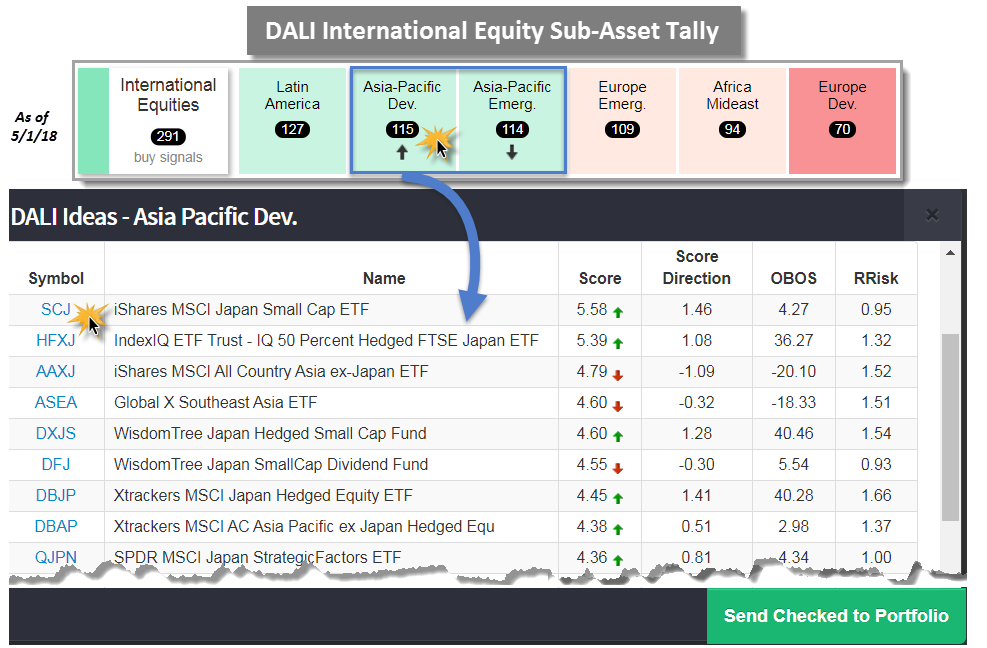
SCJ comes with a fund score of 5.58 and a score direction of 1.46, which speaks to its relative improvement over the past six months. The fund currently trades near the middle of its 10-week trading band meaning it is neutral from an overbought/oversold perspective. In addition, its rRisk is less than that of the SPX (which is always 1) at 0.95. Looking to its trend chart we can see the fund trades above its bullish support line, is on a buy signal, and in a column of X’s. At this moment, it faces a triple top at $82 where a move to $83 would break a triple top. From here, there are two support levels offered at $79 and in the mid $70’s. Those interested in gaining exposure could initiate positions upon a move to $83. Note, further resistance sits overhead from the January high at $85.

The Federal Open Market Committee will wrap its May meeting today and announce its latest monetary policy decision. Market expectations are for rates to remain unchanged – fed futures contract pricing currently implies a 94.3% probability that the fed funds rate will remain at its current target of 150-175 bps.

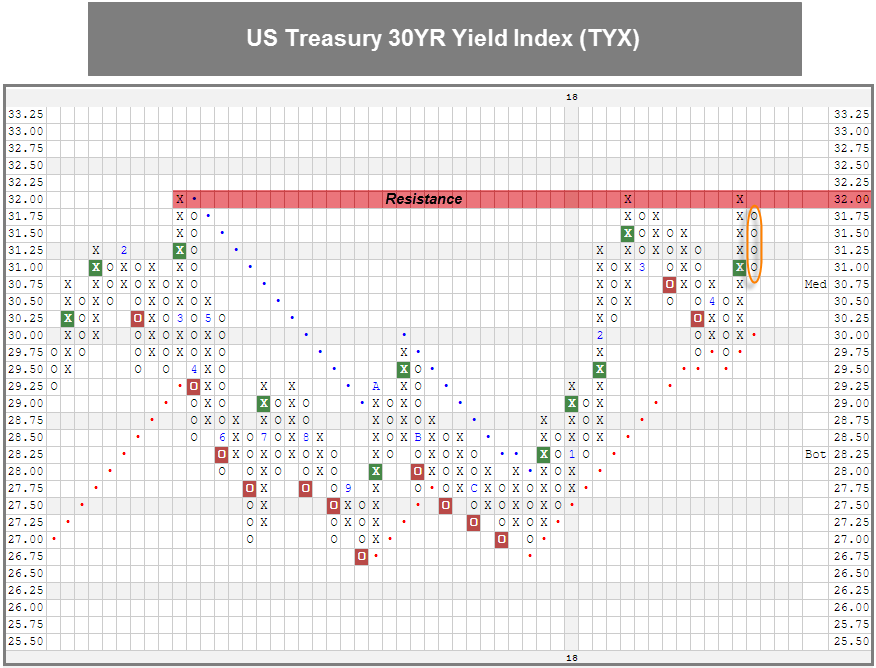
After crossing above 3.0% (30.00) and reaching as high as 3.025%, its highest level since 2011, the US Treasury 10YR Yield Index TNX reversed back down and currently sits in O’s at 2.95% on its chart. The US Treasury 30YR Yield Index TYX hit 3.2% (32.00) on its default chart last week, which met resistance hit twice previously dating back to March 2017. The chart has since reversed down into O's after running into this resistance. Closer in on the yield curve, the Five Year US Treasury Yield Index FVX remains in the same column of X’s it has been in since the first week of April as we have continued to see a flattening of the yield curve; based on yesterday’s (5/1) close, TNX and FVX were separated by about 15.5 bps, while TYX is currently 32.5 bps higher than FVX.
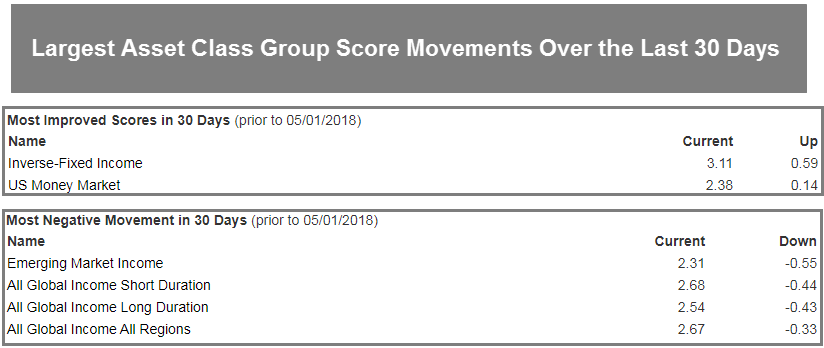
Speaking to the general weakness we’ve seen in fixed income recently, the Inverse-Fixed Income and US Money Market are the most improved groups over the last 30 days. Meanwhile, the largest score deterioration has belonged to Emerging Market Income and the global income groups. Over the last year or so, foreign bonds have been amongst the strongest segments of fixed income, buoyed by the weakness of the US dollar. However, last week we saw the NYCE U.S. Dollar Spot Index DX/Y, break a triple top to reach its highest level since January; this is the first time that DX/Y has been on a buy signal on its default chart since January 2017.
Remember, these are technical comments only. Just as you must be aware of fundamental data for the stocks we recommend based on technical criteria in the report, so too must you be aware of important data regarding delivery, market moving government releases, and other factors that may influence commodity pricing. We try to limit our technical comments to the most actively traded contracts in advance of delivery, but some contracts trade actively right up to delivery while others taper off well in advance. Be sure you check your dates before trading these contracts. For questions regarding this section or additional coverage of commodities email ben.jones@dorseywright.com.
Data represented in the table below is through 05/01/18:
Broad Market Commodities Report
| Symbol | Name | Price | Trend | RS Signal | RS Col. | 200 Day MA | Weekly Mom |
| CL/ | Crude Oil Continuous | 67.46 | Positive | Buy | X | 57.04 | +4W |
| DBLCIX | Deutsche Bank Liquid Commodities Index | 362.03 | Negative | Sell | O | 334.58 | +7W |
| DWACOMMOD | DWA Continuous Commodity Index | 480.78 | Positive | Sell | O | 463.77 | +3W |
| GC/ | Gold Continuous | 1305.20 | Negative | Buy | X | 1305.03 | -2W |
| GN/Y | S&P GSCI Index Spot | 470.92 | Positive | Sell | X | 423.03 | +4W |
| HG/ | Copper Continuous | 3.03 | Positive | Buy | X | 3.06 | +3W |
| ZG/ | Corn (Electronic Day Session) Continuous | 396.75 | Positive | Sell | X | 359.14 | -4W |
| Links to Additional Summaries |
Grains Starting to Show Absolute Strength:
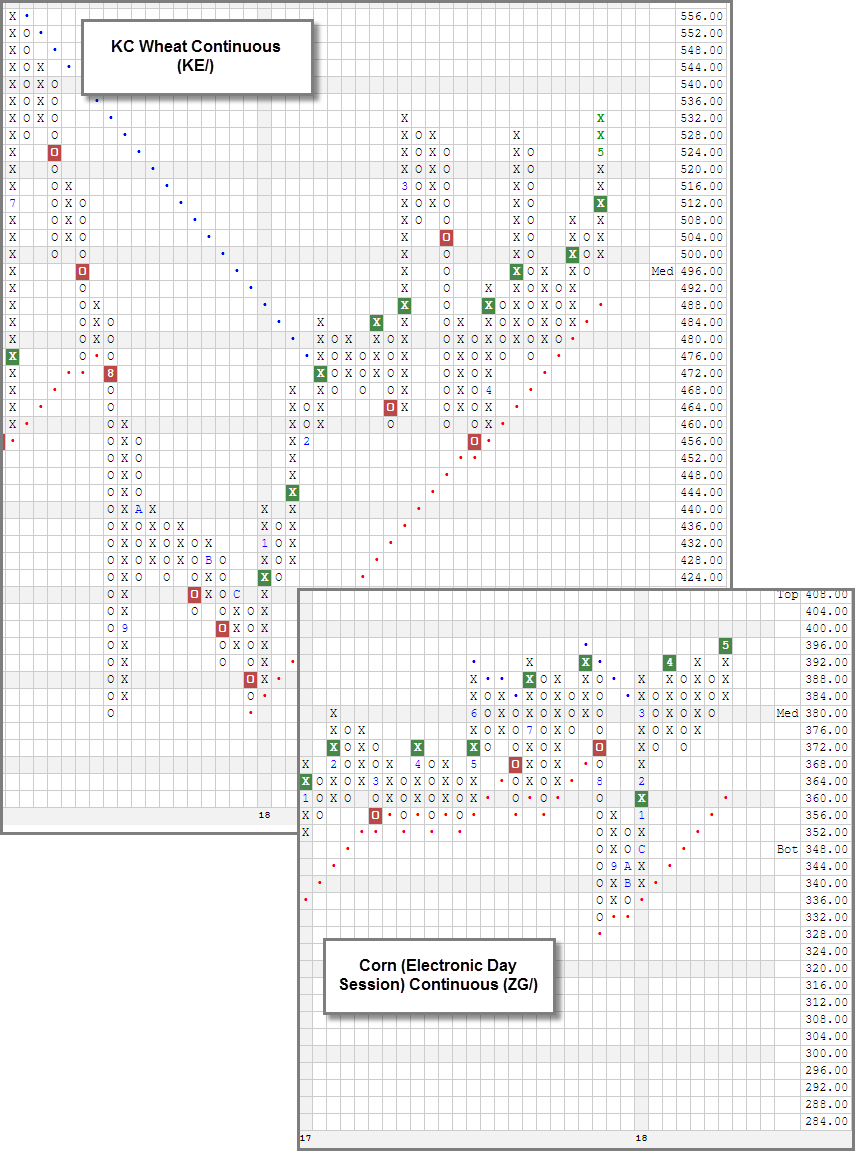
Within the Agricultural space, we have seen both Corn Continuous ZG/ and KC Wheat Continuous KE/ break out to the upside. KE/ has been trading in a positive trend since February when it broke through the negative trendline at $476. It tested the bullish support line after a brief pause in March at $456, but the trendline held and KE/ continues to push higher. With the recent action, KE/ moved back to its 2018 high at $532 and is now testing this important resistance level. KE/'s weekly momentum has also turned positive. Meanwhile, Corn Continuous ZG/ has broken out to the upside as well. On ZG/'s default chart, ZG/ broke through a significant resistance level when it completed a spread quintuple top at $396. The Agriculture sector, as a whole, lacks the relative strength of Energy or Industrial Metals, but it does provide an area for trading opportunities, as we are seeing divergence and absolute strength emerge for this sector.
The Distribution Report below places Major Market ETFs and Indices into a bell curve style table based upon their current location on their 10-week trading band. The middle of the bell curve represents areas of the market that are "normally" distributed, with the far right being 100% overbought on a weekly distribution and the far left being 100% oversold on a weekly distribution. The weekly distribution ranges are calculated at the end of each week, while the placement within that range will fluctuate during the week. In addition to information regarding the statistical distribution of these market indexes, a symbol that is in UPPER CASE indicates that the RS chart is on a Buy Signal. If the symbol is dark Green then the stock is on a Point & Figure buy signal, and if the symbol is bright Red then it is on a Point & Figure sell signal. Box Color indicates the Sector Status Rating. Green = Favored, Yellow = Average, and Red = Unfavored.
The average Bullish Percent reading this week is 46.48% down 1.61% from the previous week
| <--100 | -100--80 | -80--60 | -60--40 | -40--20 | -20-0 | 0-20 | 20-40 | 40-60 | 60-80 | 80-100 | 100-> | |||
|
||||||||||||||
| Symbol | Name | Symbol | Name |
| AGG | iShares US Core Bond ETF | NASD | Nasdaq Composite |
| CL/ | Crude Oil Continuous | NDX | NASDAQ-100 Index |
| DJIA | Dow Jones Industrial Average | RSP | Guggenheim S&P 500 Equal Weight ETF |
| DVY | iShares Dow Jones Select Dividend Index | RUT | Russell 2000 Index |
| DX/Y | NYCE U.S.Dollar Index Spot | SHY | iShares Barclays 1-3 Year Tres. Bond Fund |
| EFA | iSharesMSCI EAFE Index Fund | SML | S&P 600 Small Cap Index |
| FXE | CurrencyShares Euro Trust | SPX | S & P 500 Index |
| GC/ | Gold Continuous | TLT | iShares Barclays 20+ Year Treasury Bond Fund |
| GSG | iShares S&P GSCI Commodity-Indexed Trust | UV/Y | Continuous Commodity Index |
| HYG | iShares iBoxx $ High Yield Corporate Bond ETF | VOOG | Vanguard S&P 500 Growth ETF |
| ICF | iShares Cohen & Steers Realty Index | VOOV | Vanguard S&P 500 Value ETF |
| IEF | iShares Barclays 7-10 Yr. Tres. Bond Fund | VWO | Vanguard FTSE Emerging Markets ETF |
| LQD | iShares iBoxx $ Investment Grade Corp. | XLG | Guggenheim S&P 500 Top 50 ETF |
| MID | S&P 400 MidCap Index |
In the Optionable Universe, this week we saw 13 relative strength buy signals compared to 16 last week. On the sell side, there were 10 relative strength sell signals compared to 12 last week.
| Symbol | Company | Sector | Price | RS vs Market Signal | RS vs Market Column | RS vs Peer Signal | RS vs Peer Column | Trend |
|---|---|---|---|---|---|---|---|---|
| BJRI | BJ's Restaurants Inc. | Cyclical Goods and Services | 56.450 | Buy | X | Sell | X | 4 |
| FCN | FTI Consulting, Inc. | Industrial Goods & Svcs | 58.820 | Buy | X | Sell | X | 4 |
| FITB | Fifth Third Bancorp | Banks | 33.360 | Buy | X | Buy | X | 5 |
| CPG | Crescent Point Energy Corp. (Canada) ADR | Oil Companies Major | 8.710 | Buy | X | Sell | X | 2 |
| BCOV | Brightcove Inc | Technology Services | 9.800 | Buy | X | Sell | X | 3 |
| PCMI | PCM Inc. | Retail | 12.250 | Buy | X | Buy | X | 4 |
| OIS | Oil States International, Inc. | Oil Drilling, Equipment Svcs | 35.400 | Buy | X | Sell | X | 4 |
| LULU | Lululemon Athletica Inc. | Retail | 99.700 | Buy | X | Buy | X | 5 |
| TZOO | Travelzoo | Technology Services | 12.450 | Buy | X | Sell | X | 3 |
| YUM | Yum! Brands, Inc. | Cyclical Goods and Services | 86.640 | Buy | X | Buy | X | 5 |
| UVE | Universal Insurance Holdings, Inc. | Insurance | 33.100 | Buy | X | Buy | X | 5 |
| WUBA | 58.Com | Technology Services | 88.630 | Buy | X | Sell | X | 4 |
| LONE | Lonestar Resources US, Inc. Class A | Oil Companies Major | 5.190 | Buy | X | Buy | X | 5 |
| Symbol | Company | Sector | Price | RS vs Market Signal | RS vs Market Column | RS vs Peer Signal | RS vs Peer Column | Trend |
|---|---|---|---|---|---|---|---|---|
| CEVA | Ceva, Inc. | Semiconductors | 33.300 | Sell | O | Sell | O | 0 |
| FORM | FormFactor Inc. | Semiconductors | 11.450 | Sell | O | Sell | O | 0 |
| HRG | HRG Group Inc. | Food and Beverage | 11.730 | Sell | O | Sell | O | 0 |
| LEG | Leggett & Platt, Incorporated | Cyclical Goods and Services | 40.380 | Sell | O | Sell | O | 0 |
| PETS | PetMed Express, Inc. | Retail | 34.300 | Sell | O | Sell | O | 0 |
| R | Ryder System, Inc. | Industrial Goods & Svcs | 66.850 | Sell | O | Sell | O | 0 |
| TECD | Tech Data Corp | Industrial Goods & Svcs | 77.320 | Sell | O | Sell | O | 0 |
| TEN | Tenneco Inc | Automobiles | 46.020 | Sell | O | Sell | O | 0 |
| XIN | Xinyuan Real Estate Company Limited (China) ADR | Real Estate Investment & Services | 5.070 | Sell | O | Buy | O | 2 |
| COMM | CommScope Holding Company, Inc. | Communications Technology | 27.590 | Sell | O | Sell | O | 0 |
| Comments |
|---|
| EGHT 8*8, Inc. ($21.28) - Software - EGHT broke a double top at $21, which is a new high. The completed a big base breakout at the start of the year and demand is still present at this stage. The 4 for 5'er is part of the favored Software sector and it just flipped to positive weekly momentum. New positions may be initiated here or on a pullback. Support is at $18. Earnings are expected on 5/24. |
| FIVN Five9, Inc. (Five9) ($32.93) - Software - FIVN broke a triple top at $33 and continued higher intraday to $34. This breakout is notable as it completes a shakeout pattern and marks a new high. The 5 for 5'er continues to be a positive diverger from the rest of the broad market. New positions may be initiated in the lower $30s and support is visible at $27. |
| HFC HollyFrontier Corporation ($63.78) - Oil - HFC broke a double top at $63 and continued higher to $64 intraday, a new all-time high following a positive earnings release. The 5 for 5'er ranks 3rd out of 90 stocks in the favored Oil sector and comes with a bullish price objective of $101. New positions are best served on a pullback from here as the stock trades in heavily overbought territory. The first sign of trouble comes with a move to $58, a double bottom break. |
| LNG Cheniere Energy, Inc. ($59.71) - Oil - LNG broke a double top at $60, which matches its peak from January. The 5 for 5'er ranks 19th out of 90 stocks in the favored Oil sector matrix. New positions may be initiated here or upon a move to $61. Those long may implement a trend violation as a stop. Note, earnings are expected on 5/4. |
| MED Medifast, Inc. ($99.26) - Food Beverages/Soap - MEDI broke a double bottom at $96. This is the first sell signal in a strong uptrend so we will give the stock the benefit of the doubt. Those long may continue to hold here and look to support in the upper $80's and lower $90's. No new positions are advised at this time. Earnings are expected on 5/3. |
| MMSI Merit Medical Systems Inc ($49.28) - Healthcare - MMSI broke a double top at $50, the stocks 3rd consecutive buy signal and new multi-year high. It comes with a technical attributes score of 5 and a bullish price objective of $61 too. New positions may be initiated at current levels. Support is offered throughout the lower $40s. |
| MNST Monster Beverage Corp. ($53.45) - Food Beverages/Soap - MNST broke a double bottom at $54 following a negative earnings release, which not only violates the bullish support line but also completes a bearish triangle pattern. Those long should exit positions here and avoid MNST moving forward as supply has taken control. |
| PANW Palo Alto Networks Inc ($198.54) - Software - PANW broke a triple top at $198, reaching a new multi-year high. The 4 for 5'er stock ranks in the top 20% of the favored Software sector matrix and recently returned to a market RS buy signal for the first time in more than a year. New exposure can be considered here with three levels of support offered between $176 and $188. Earnings are expected on 5/29/18. |
| THG Hanover Insurance Group Inc ($112.22) - Insurance - After a negative earnings release, THG broke a double bottom at $112 after forming a double top at $120, which sets up a potential shakeout pattern. Those long may continue to hold here and look to support at $106. Those interested in playing the shakeout may wait for a three box reversal for the pattern to initiate before considering or wait for the pattern to complete with a triple top break at $122. The stock is otherwise technically strong with three positive attributes and a matrix ranking in the top quartile of the Insurance sector. |
| TMUS T-Mobile US Inc. ($57.11) - Telephone - TMUS broke a double bottom at $58 in Wednesday's trading and will now fall to a 2 for 5'er. Any with long exposure should take this opportunity to evaluate this position. A move to $57 would violate another level of support; additional support lies at $55. |
| Name | Option Symbol | Action | Stop Loss |
|---|---|---|---|
| Palo Alto Networks Inc - $197.92 | O:PANW 18I185.00D21 | Buy the September 185.00 calls at 24.20 | 182.00 |
| Name | Option | Action |
|---|---|---|
| Akamai Technologies, Inc. ( AKAM) | May. 67.50 Calls | Raise the stock price stop loss to 68.00 (CP: 71.47) |
| E*trade Group, Inc. ( ETFC) | Jul. 50.00 Calls | Raise the option stop loss to 10.10 (CP: 12.10) |
| Name | Option Symbol | Action | Stop Loss |
|---|---|---|---|
| General Motors - $36.43 | O:GM 18U40.00D21 | Buy the September 40.00 puts at 4.80 | 40.00 |
| Name | Option | Action |
|---|---|---|
| Leggett & Platt, Incorporated (LEG) | Sep. 45.00 Puts | Stopped at 3.50 (CP: 3.50) |
| Gilead Sciences, Inc. (GILD) | Sep. 77.50 Puts | Initiate an option stop loss of 9.60 (CP: 11.60) |
| Perrigo Co. PLC (PRGO) | Aug. 85.00 Puts | Raise the option stop loss to 7.70 (CP: 9.70) |
| Perrigo Co. PLC (PRGO) | Nov. 85.00 Puts | Initiate a stock price stop of 0.00 (CP: 77.06) |
| Name | Option Sym. | Call to Sell | Call Price | Investment for 500 Shares | Annual Called Rtn. | Annual Static Rtn. | Downside Protection |
|---|---|---|---|---|---|---|---|
| Box Inc. $23.28 | O:BOX 18I25.00D21 | Sep. 25.00 | 2.00 | $11,069.40 | 30.45% | 20.22% | 7.29% |
| Name | Action |
|---|---|
| Avis Budget Group, Inc. (CAR) - 47.94 | Sell the August 52.50 Calls. |
| Deckers Outdoor Corporation (DECK) - 94.09 | Sell the September 97.50 Calls. |
| Lam Research Corporation (LRCX) - 190.39 | Sell the August 195.00 Calls. |
| NetApp, Inc. (NTAP) - 67.85 | Sell the September 70.00 Calls. |
| Axon Enterprise Inc. (AAXN) - 41.51 | Sell the September 45.00 Calls. |
| Name | Covered Write |
|---|---|
| Chart Industries, Inc. ( GTLS - 57.57 ) | September 60.00 covered write. |
Daily Equity & Market Analysis
Loading, Please Wait...
