
DALI Sub-Asset Change and DALI Idea Generation
Last Thursday (4/26) we witnessed a change within the sub-asset rankings of the International Equities asset class in our DALI tool. Asia-Pacific Emerging fell below Asia-Pacific Developed. Both remain in the top three, but Developed Asia now sits in the 2nd spot. International Equities as an asset class has remained steady as a whole, but this is roughly the sixth change within the sub-asset class emphasis that we have encountered this year. One way for you all to gather a list of ideas in light of these changes or to hone in on a particular region is through the DALI Ideas function. To access this list (shown in the image below) simply click on a region like Asia-Pacific Developed. From there, you will be presented with a list of ETFs and/or Mutual Funds sorted by fund score that you may peruse. When we click on the list today, it is heavily populated with Japanese funds. Not only are we able to see the fund scores but also score direction (improvement/deterioration over the short-term), “OBOS” (overbought/oversold reading), and rRisk (its risk/volatility versus the S&P 500 Index SPX). You may click on the symbol to open the Point & Figure chart for the fund, as an example, we'll take a look at the iShares MSCI Japan Small Cap ETF SCJ.
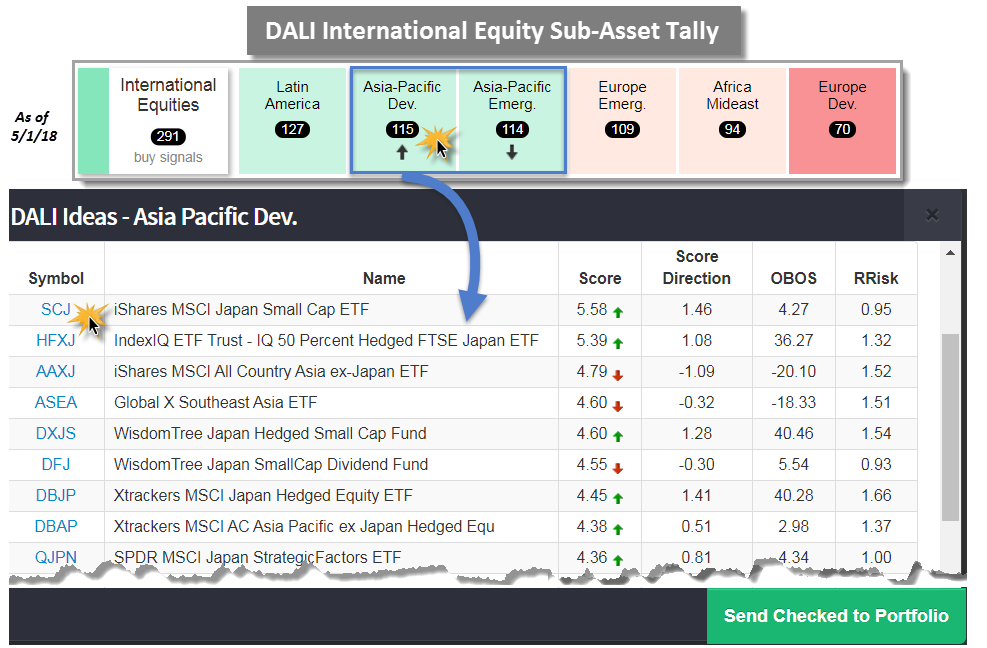
SCJ comes with a fund score of 5.58 and a score direction of 1.46, which speaks to its relative improvement over the past six months. The fund currently trades near the middle of its 10-week trading band meaning it is neutral from an overbought/oversold perspective. In addition, its rRisk is less than that of the SPX (which is always 1) at 0.95. Looking to its trend chart we can see the fund trades above its bullish support line, is on a buy signal, and in a column of X’s. At this moment, it faces a triple top at $82 where a move to $83 would break a triple top. From here, there are two support levels offered at $79 and in the mid $70’s. Those interested in gaining exposure could initiate positions upon a move to $83. Note, further resistance sits overhead from the January high at $85.

