The May Fed meeting wraps up. The Ten Year Yield Index (TNX) has reversed down from a mutli-year high. Group scores for Inverse-Fixed Income and US Money Market have improved, while scores for international groups have deteriorated.
The Federal Open Market Committee will wrap its May meeting today and announce its latest monetary policy decision. Market expectations are for rates to remain unchanged – fed futures contract pricing currently implies a 94.3% probability that the fed funds rate will remain at its current target of 150-175 bps.

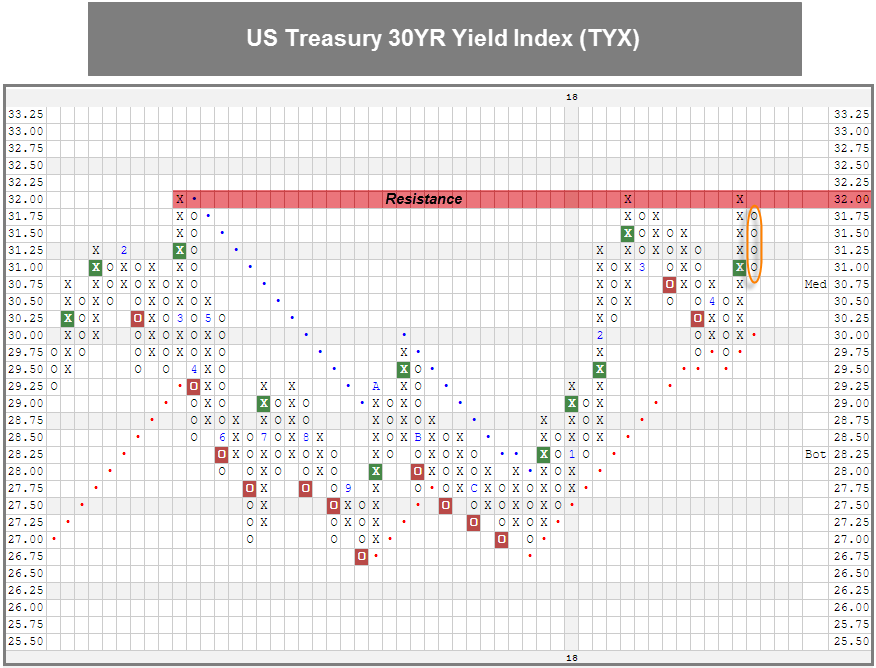
After crossing above 3.0% (30.00) and reaching as high as 3.025%, its highest level since 2011, the US Treasury 10YR Yield Index TNX reversed back down and currently sits in O’s at 2.95% on its chart. The US Treasury 30YR Yield Index TYX hit 3.2% (32.00) on its default chart last week, which met resistance hit twice previously dating back to March 2017. The chart has since reversed down into O's after running into this resistance. Closer in on the yield curve, the Five Year US Treasury Yield Index FVX remains in the same column of X’s it has been in since the first week of April as we have continued to see a flattening of the yield curve; based on yesterday’s (5/1) close, TNX and FVX were separated by about 15.5 bps, while TYX is currently 32.5 bps higher than FVX.
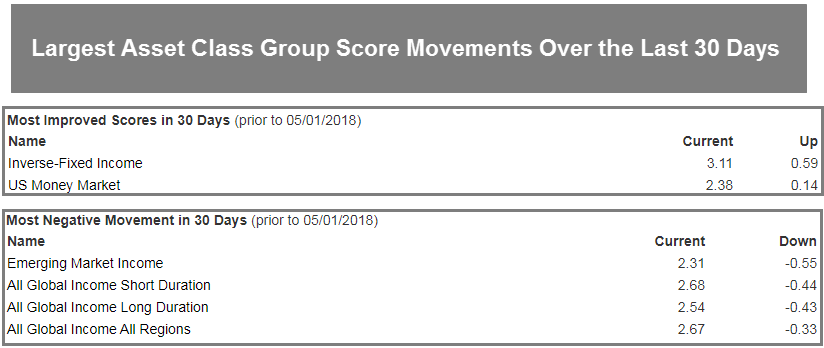
Speaking to the general weakness we’ve seen in fixed income recently, the Inverse-Fixed Income and US Money Market are the most improved groups over the last 30 days. Meanwhile, the largest score deterioration has belonged to Emerging Market Income and the global income groups. Over the last year or so, foreign bonds have been amongst the strongest segments of fixed income, buoyed by the weakness of the US dollar. However, last week we saw the NYCE U.S. Dollar Spot Index DX/Y, break a triple top to reach its highest level since January; this is the first time that DX/Y has been on a buy signal on its default chart since January 2017.