Most Requested Symbols

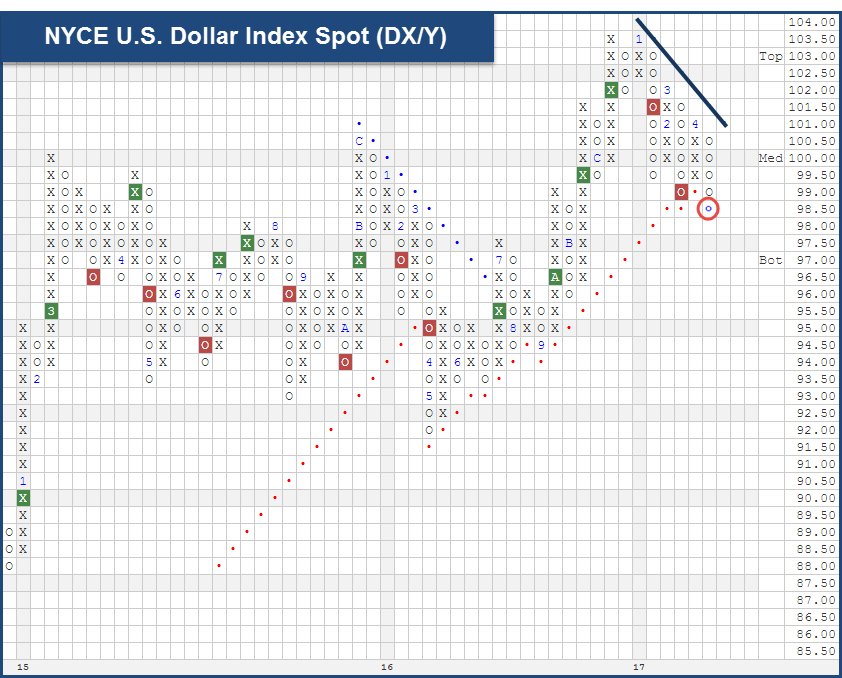
Although we’ve technically found ourselves in a rising dollar environment dating back to May 4th, 2011, we have seen deterioration on the chart of the NYCE U.S. Dollar Index Spot DX/Y over the past four months. With today’s intraday action, the Spot chart broke a third consecutive double bottom at $98.50. This move also violated the bullish support line that had been in tact since June 2016, flipping the trend negative. As a refresher, any move of at least 10% from a low constitutes a new “rising dollar market” while a decline of at least 10% in the dollar index from a peak begins a “falling dollar market”. At current levels, the Index has fallen roughly 5% off of the recent peak in January of $103.82, meaning we are still roughly 5% away from triggering a new falling dollar environment, which would come with a move to $93.43. As mentioned earlier, we have been in a rising dollar environment since May 4, 2011, making it the longest rising dollar environment since we have been tracking this currency. Click here to read the last US Dollar Study that we published on December 13th, 2016. We will continue to monitor this Index for any future developments.

On April 13th, 2017, we launched the ALPS Target Income Model ALPSINCOME.TR, and we wanted to spend time today discussing the methodology and rules of the Model. As the name of the Model suggests, it is designed to be income-generating while also looking to provide capital appreciation through an allocation to a line-up of ETFs. In addition to the Model methodology and rules, we will also discuss how the strategy has performed since inception and also take a look at performance relative to yield. We’ll wrap things up by touching on how the Model can be implemented within an equity allocation.
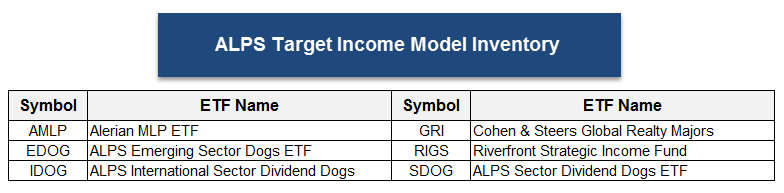
So, how does the ALPS Target Income Model determine which ETFs to own in the portfolio? Well, as is the case with pretty much all of our strategies, relative strength is the driver behind the decision making process. Relative strength offers a logical, organized method for identifying leadership and the potential for relative outperformance. By utilizing a relative strength matrix we are able to compare and then rank the ETFs within the ALPS Model line-up. The top three ETFs within the line-up are bought and only sold when the fall sufficiently out of favor within the relative strength matrix. Additionally, an ETF is only added when another ETF is removed. At that point, the highest ranking ETF that is not already own is added to the portfolio. The portfolio will remain 100% invested at all times, and the strategy is evaluated on a monthly basis. At each evaluation the portfolio is rebalanced regardless if there is a change so that each position is equally-weighted. Additionally, the portfolio must have a yield of at least 4%. If the portfolio’s yield is less than 4% it will increase the number of positions in the portfolio in increments of 5% until the yield requirement is reached. In the bullet points below, we have outlined the rules for the strategy, and the Model Inventory can be found below.
Systematic Portfolio Rules:
The rules-based approach employed by the ALPS Target Income Model allowed us to create a hypothetical back-test of the Model strategy. Using the daily return of the underlying indices, we were able to extrapolate back in time where the ETF components would have approximately been trading historically assuming they tracked the underlying index. From that information, relative strength charts were created for each ETF within the inventory and evaluated based upon the portfolio rules explained above.
Since inception, the ALPS Target Income Model has cumulatively gained 58.34%, including dividends (12/30/2011 to 5/15/2017). For further perspective on how the model has performed, we took a slightly different approach from our normal hypothetical growth of $100,000. In the graph below we have shown the yield for the Model going back to inception at the beginning of 2012, as well as the 12-month rolling total return for the strategy itself (represented by the shade region). The way we have shaded the graph below is meant to represent the capital appreciation (or depreciation) above the yield that the strategy offers. In other words, it is a way to convey returns above (or below) just the income stream that the strategy provides us. As we can see, the 12-month rolling total returns indicated that the strategy provide appreciation above just the yield from roughly December 2012 to December 2014. After depreciating from that time until June of 2016, we have since seen the strategy again provide appreciation above just the yield.

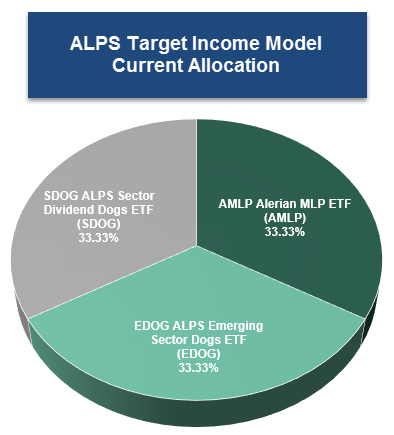
Below we have the current holdings of the ALPS Target Income Model. At this time, the Model is well positioned and maintains exposure to the Alerian MLP ETF AMLP, the ALPS Emerging Sector Dogs ETF EDOG, and the ALPS Sector Dividend Dogs ETF SDOG. It is worth noting that we have not seen a change to the Model since its launch back in April.
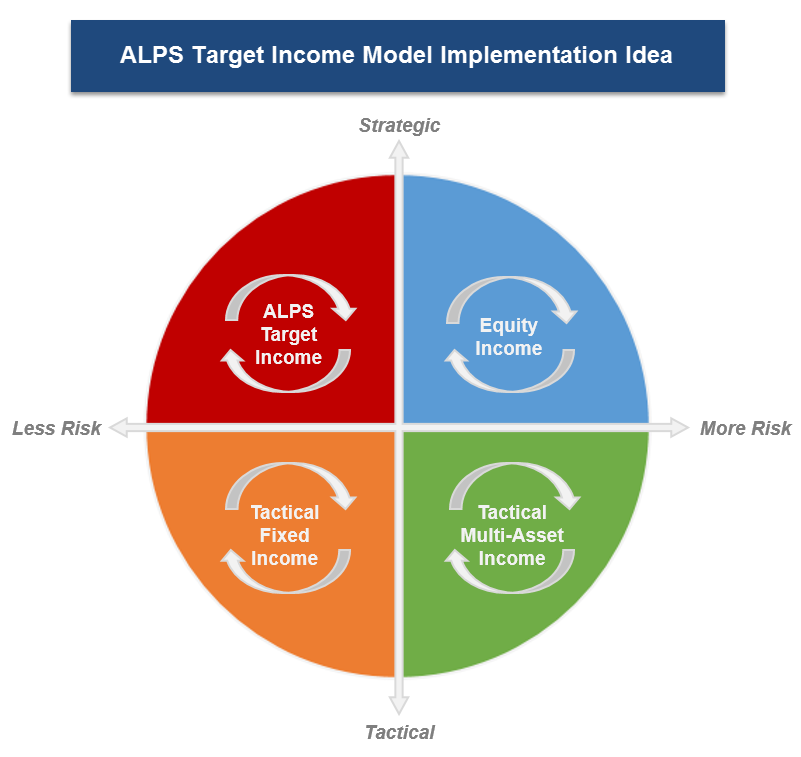
We wanted to wrap up our discussion today by touching on ways that we can utilize the ALPS Target Income Model within an allocation. Before we delve into the image below, we wanted to first note that the ALPS Target Income Model could be positioned as the income-generating sleeve of an equity allocation. One option could be to use a core-satellite approach in which the core could be a broad based strategy or fund, while the satellite could potentially be a combination of a sector rotation strategy and the ALPS Target Income Model. In the image below, we have shown a second way that the ALPS Target Income Model could be utilized. In this case we have shown an income portfolio in which each of the income sleeves represents 25% of the allocation. Along with an equity income strategy, a tactical fixed income strategy, and a tactical multi-asset strategy, the ALPS Target Income Model can be plugged into an income portfolio and provide tactical rotation along with an income stream. For other ways to utilize the ALPS Target Income Model, be sure to consult an analyst.

Every week, the analysts here at DWA organize and write approximately 11 feature stories focusing within the inventories of multiple ETF providers. These articles can be found within the weekly ETF reports we conduct for those ETF families with which we provide guided model-based solutions. The weekly reports can be accessed from the Research Menu, but as of this week we will also compile a handful of those stories, which we feel are particularly relevant. We hope that this will serve as an "in case you missed it..." sort of section, where you can quickly access timely ETF features in a comprehensive fashion each week. We will include a link to the report along with a brief abstract summarizing our discussion within the respective features. This week's compilation is below.

Through the first part of 2017, International Equities has been the most improved asset class on a relative basis. Within the asset class, European markets have been among the most improved regions. In fact, just last week Europe Emerging overtook Latin America for the top spot in the sub-level of DALI. For perspective on this improvement within Europe, we wanted to take a look at the chart of the First Trust STOXX European Select Dividend Index Fund FDD. With action so far in 2017... (Read More)
We have continued to see strength come from International Equities, which currently ranks #2 in DALI and is the most improved asset class year-to-date, up 65 buy signals. Among those countries that are driving this improvement is China, and we can see this on the chart of the Guggenheim China All-Cap ETF YAO. With yesterday’s market action, YAO rallied to $28.50, breaking through the bearish resistance line, flipping the overall trend back to positive for the first time since July 2015... (Read More)
The first change this week comes from the State Street Sector Model SSTREET. The SPDR S&P Metals and Mining ETF XME has been removed from the Model after reversing down into O's versus the SPX on its RS chart. This Model is designed to target exposure to the State Street sector ETFs that are demonstrating positive Relative Strength versus the S&P 500 Index SPX. Each week we monitor 31 Relative Strength charts for each ETF in the Model's universe versus... (Read More)
The Distribution Report below places Major Market ETFs and Indices into a bell curve style table based upon their current location on their 10-week trading band. The middle of the bell curve represents areas of the market that are "normally" distributed, with the far right being 100% overbought on a weekly distribution and the far left being 100% oversold on a weekly distribution. The weekly distribution ranges are calculated at the end of each week, while the placement within that range will fluctuate during the week. In addition to information regarding the statistical distribution of these market indexes, a symbol that is in UPPER CASE indicates that the RS chart is on a Buy Signal. If the symbol is dark Green then the stock is on a Point & Figure buy signal, and if the symbol is bright Red then it is on a Point & Figure sell signal.
The average Bullish Percent reading this week is 57.58% down 0.71% from the previous week
| <--100 | -100--80 | -80--60 | -60--40 | -40--20 | -20-0 | 0-20 | 20-40 | 40-60 | 60-80 | 80-100 | 100-> | |||
 |
||||||||||||||
| Symbol | Name | Symbol | Name |
| AGG | iShares US Core Bond ETF | NASD | Nasdaq Composite |
| CL/ | Crude Oil Continuous | NDX | NASDAQ-100 Index |
| DJIA | Dow Jones Industrial Average | RSP | Guggenheim S&P 500 Equal Weight ETF |
| DVY | iShares Dow Jones Select Dividend Index | RUT | Russell 2000 Index |
| DX/Y | NYCE U.S.Dollar Index Spot | SHY | iShares Barclays 1-3 Year Tres. Bond Fund |
| EFA | iSharesMSCI EAFE Index Fund | SML | S&P 600 Small Cap Index |
| FXE | CurrencyShares Euro Trust | SPX | S & P 500 Index |
| GC/ | Gold Continuous | TLT | iShares Barclays 20+ Year Treasury Bond Fund |
| GSG | iShares S&P GSCI Commodity-Indexed Trust | UV/Y | Continuous Commodity Index |
| HYG | iShares iBoxx $ High Yield Corporate Bond ETF | VOOG | Vanguard S&P 500 Growth ETF |
| ICF | iShares Cohen & Steers Realty Index | VOOV | Vanguard S&P 500 Value ETF |
| IEF | iShares Barclays 7-10 Yr. Tres. Bond Fund | VWO | Vanguard FTSE Emerging Markets ETF |
| LQD | iShares iBoxx $ Investment Grade Corp. | XLG | Guggenheim S&P 500 Top 50 ETF |
| MID | S&P 400 MidCap Index |

| Stock | Symbol | Sector | Current Price | Action Price | Target | Stop | Notes |
|---|---|---|---|---|---|---|---|
| Morgan Stanley | MS | Wall Street | $43.43 | mid-40s | 75 | 40 | 5/5'er, Top 5 ranking in S&P 100 matrix & Wall Street matrix, Weekly Momentum turns Positive. |
| NetFlix Inc. | NFLX | Internet | $160.02 | 148-154 | 182 | 138 | 3 for 5'er, leader in favored INET sector, positive diverger, good R-R, RS vs Mkt buy signal |
| Eagle Materials, Inc. | EXP | Building | $99.58 | 99-102 | 112 | 93 | 5/5'er, Top quartile rank in BUIL matrix, new positive weekly momentum change (after 19 weeks), Earn. 5/18. |
| Rockwell Automation, Inc. | ROK | Electronics | $158.02 | Mid 150s | 170 | 146 | 5 for 5'er, pulled back creating entry point, Weekly Momentum Neg. 10 weeks. |
| Domino's Pizza, Inc. | DPZ | Restaurants | $196.52 | 186-192 | 268 | 172/152 | 5/5'er, Positive Weekly Momentum Change, Bullish Triangle formation, Top 5 rank in REST matrix. |
| Cummins Inc. | CMI | Machinery and Tools | $156.60 | 154 - 158 | 200 | 142 | Favored sector, Triple top completes Shakeout Use pullback to initiate positions, Positive trend RS charts in Xs. |
| MarketAxess Holdings Inc. | MKTX | Wall Street | $188.39 | 186-192 | 234 | 176 | 5/5'er, Positive Weekly Momentum Change, Long-term leadership trend, Investors may purchase through call options. |
| Cullen/Frost Bankers Inc | CFR | Banks | $90.49 | 88-92 | 105 | 82 | 4/5'er, New RS buy signal, PB to improve R-R, Among most improved in BANK matrix. |
| Leidos Holdings Inc. | LDOS | Computers | $52.80 | 51-54 | 63 | 47 | 5 for 5'er, favored Comp sector, above average yield, R-R > 2, pos wkly mom change |
| Arch Capital Group Ltd. | ACGL | Insurance | $95.68 | mid-90s | 111 | 91/84 | 4/5'er, Positive weekly momentum change, "90 to 100" candidate. |
| Cirrus Logic Inc | CRUS | Semiconductors | $64.86 | mid-60s | 95 | 60/56 | 5/5'er, Great risk-reward, Strong sector, Can be used as covered write (Sept. 70 calls). |
| Stock | Symbol | Sector | Current Price | Action Price | Target | Stop | Notes |
|---|---|---|---|---|---|---|---|
| Diamond Offshore Drilling, Inc. | DO | Oil Service | $14.05 | (15-16) | 10.50 | 17.50 | 0 for 5'er, bottom quartile of unfavored OILS sector, negative market and sector diverger. |
| Simon Property Group, Inc. | SPG | Real Estate | $156.16 | (160-170) | 140 | 182 | 1/5'er, Recent RS Sell Signal, Move to "low attribute" rating for first time since early-2009. |
| Dollar General Corp. | DG | Retailing | $71.72 | (70-74) | 60 | 80 | 1/5'er, Recent RS Sell Signal, Low Ranking in Laggard sector (Retail), Earn. 6/1. |
| Stock | Symbol | Sector | Current Price | Action Price | Target | Stop | Notes |
|---|---|---|---|---|---|---|---|
| Danaher Corporation | DHR | Machinery and Tools | $83.28 | 81-85 | 123 | 75 | Still actionable for new long exposure in the low-80s. Those already long may hold here with a stop loss of $75. |
| Comment |
|---|
| TJX The TJX Companies, Inc. R ($74.19) - Retailing - TJX was a long recommendation last September from the mid-70s and after a weak session on Tuesday this stock is right back to the mid-70s. The stock broke a double bottom at $75 and now sets up a test of additional support in the $72-73 area. Those currently involved may hold here, but we will raise our recommended stop loss point for investors to $71 at this time. |
| DKS Dick's Sporting Goods, Inc. R ($41.21) - Retailing - DKS was a short recommendation earlier this year from the low-50s and after Tuesday's drubbing the stock has now hit our original target for the trade. As well, the stock is 100% oversold on a near-term basis, putting it at greater risk for a bounce or prolonged consolidation in this area. We will cover at least part of any open short position here, and would hedge the remainder with protective calls. The September 44 calls are offered at $1.95 as one suitable hedge for those retaining short exposure here. |
CRUS Cirrus Logic Inc R ($67.00) - Semiconductors - Shares of CRUS are a member of one of the strongest sector trends within the US market today and have moved into the top half of a matrix ranking for that sector (Semiconductors). The stock had a strong session on Tuesday, which included new all-time highs with a triple top break at $67, but which still leaves ample room for the stock to appreciate toward its vertical price objective of $95. CRUS has been a "high attribute" stock since late-2014 and remains so today with an attribute rating of 5. We will look to accumulate long exposure in the mid-60s, and will use a stop loss point of $60 for traders and $56 for investors. Investors may also consider entering CRUS as a covered write, selling the September 70 calls at $3.60 against the long position in the underlying.
| 16 | 17 | |||||||||||||||||||||||||||||||||||||||||||||||||||||
| 67.00 | x | 67.00 | ||||||||||||||||||||||||||||||||||||||||||||||||||||
| 66.00 | X | X | x | 66.00 | ||||||||||||||||||||||||||||||||||||||||||||||||||
| 65.00 | • | X | O | X | O | x | 65.00 | |||||||||||||||||||||||||||||||||||||||||||||||
| 64.00 | X | • | X | O | X | O | x | 64.00 | ||||||||||||||||||||||||||||||||||||||||||||||
| 63.00 | X | O | • | X | O | X | 5 | 63.00 | ||||||||||||||||||||||||||||||||||||||||||||||
| 62.00 | X | 2 | O | • | X | O | X | 62.00 | ||||||||||||||||||||||||||||||||||||||||||||||
| 61.00 | X | O | X | O | 4 | O | Med | 61.00 | ||||||||||||||||||||||||||||||||||||||||||||||
| 60.00 | X | X | O | X | O | X | 60.00 | |||||||||||||||||||||||||||||||||||||||||||||||
| 59.00 | X | X | O | X | O | O | X | 59.00 | ||||||||||||||||||||||||||||||||||||||||||||||
| 58.00 | X | X | O | X | O | X | O | X | 58.00 | |||||||||||||||||||||||||||||||||||||||||||||
| 57.00 | X | O | X | B | X | O | X | O | X | O | X | 57.00 | ||||||||||||||||||||||||||||||||||||||||||
| 56.00 | X | O | X | X | O | X | O | X | O | X | 1 | X | O | X | X | 56.00 | ||||||||||||||||||||||||||||||||||||||
| 55.00 | X | O | X | O | X | X | O | X | O | X | O | X | O | O | X | O | X | • | 55.00 | |||||||||||||||||||||||||||||||||||
| 54.00 | X | O | A | O | X | O | X | O | O | X | C | X | O | X | O | X | • | 54.00 | ||||||||||||||||||||||||||||||||||||
| 53.00 | 9 | X | O | X | O | X | O | X | O | O | X | O | • | 3 | X | • | 53.00 | |||||||||||||||||||||||||||||||||||||
| 52.00 | X | O | X | O | X | O | O | O | X | • | O | • | Bot | 52.00 | ||||||||||||||||||||||||||||||||||||||||
| 51.00 | 8 | O | X | O | O | X | • | • | 51.00 | |||||||||||||||||||||||||||||||||||||||||||||
| 50.00 | X | O | X | O | • | 50.00 | ||||||||||||||||||||||||||||||||||||||||||||||||
| 49.00 | X | O | X | • | 49.00 | |||||||||||||||||||||||||||||||||||||||||||||||||
| 48.00 | X | O | • | 48.00 | ||||||||||||||||||||||||||||||||||||||||||||||||||
| 47.00 | X | • | 47.00 | |||||||||||||||||||||||||||||||||||||||||||||||||||
| 46.00 | X | • | 46.00 | |||||||||||||||||||||||||||||||||||||||||||||||||||
| 45.00 | X | • | 45.00 | |||||||||||||||||||||||||||||||||||||||||||||||||||
| 44.00 | X | • | 44.00 | |||||||||||||||||||||||||||||||||||||||||||||||||||
| 43.00 | X | • | 43.00 | |||||||||||||||||||||||||||||||||||||||||||||||||||
| 42.00 | X | • | 42.00 | |||||||||||||||||||||||||||||||||||||||||||||||||||
| 41.00 | X | • | 41.00 | |||||||||||||||||||||||||||||||||||||||||||||||||||
| 40.00 | X | X | • | 40.00 | ||||||||||||||||||||||||||||||||||||||||||||||||||
| 39.00 | X | O | X | • | 39.00 | |||||||||||||||||||||||||||||||||||||||||||||||||
| 38.00 | X | X | X | O | X | • | 38.00 | |||||||||||||||||||||||||||||||||||||||||||||||
| 37.00 | X | O | X | • | 4 | X | O | 6 | O | X | • | 37.00 | ||||||||||||||||||||||||||||||||||||||||||
| 36.00 | 5 | O | X | O | X | • | X | O | X | O | X | 7 | X | • | 36.00 | |||||||||||||||||||||||||||||||||||||||
| 35.00 | X | 6 | X | O | X | O | • | 2 | X | O | X | 5 | X | O | • | 35.00 | ||||||||||||||||||||||||||||||||||||||
| 34.00 | 4 | O | X | O | C | O | • | X | O | X | O | O | X | • | 34.00 | |||||||||||||||||||||||||||||||||||||||
| 33.00 | O | X | O | X | O | X | X | O | X | O | X | O | X | • | 33.00 | |||||||||||||||||||||||||||||||||||||||
| 32.00 | O | X | 7 | X | 8 | A | X | O | X | X | O | X | O | X | O | X | • | 32.00 | ||||||||||||||||||||||||||||||||||||
| 31.00 | O | O | X | O | 9 | X | O | X | O | X | O | X | O | X | O | O | • | 31.00 | ||||||||||||||||||||||||||||||||||||
| 30.00 | O | O | X | O | X | O | X | O | X | O | X | O | X | • | • | 30.00 | ||||||||||||||||||||||||||||||||||||||
| 29.00 | O | X | O | X | O | O | B | 1 | X | X | • | 29.00 | ||||||||||||||||||||||||||||||||||||||||||
| 28.00 | O | X | O | X | • | O | X | O | X | • | 28.00 | |||||||||||||||||||||||||||||||||||||||||||
| 27.00 | O | X | O | X | • | O | X | O | X | • | 27.00 | |||||||||||||||||||||||||||||||||||||||||||
| 26.00 | O | X | O | • | O | O | • | 26.00 | ||||||||||||||||||||||||||||||||||||||||||||||
| 25.00 | O | • | • | 25.00 | ||||||||||||||||||||||||||||||||||||||||||||||||||
| 16 | 17 |
| Comments |
|---|
| BIG Big Lots, Inc. ($46.63) - Retailing - broke a double bottom at $46. The stock is a three for 5'er however this is the second consecutive sell signal and the trend is negative. No new positions here and if long would consider moving to the sidelines. Next support on the chart is at $43 and resistance is at $51. |
| CENT Central Garden & Pet Company ($32.30) - Household Goods - After forming, but not breaking, a double top at $39, CENT broke a double bottom at $33, setting the chart up for a potential shakeout pattern. From here, the action point of the shakeout would be triggered with a reversal up into X’s and the pattern would then complete with a triple top break at $40. CENT is a perfect 5 for 5’er within the favored Household Good sector. Okay to play the pattern on the reversal up into X’s or upon completion. A move to $31 would negate the shakeout pattern. |
| CRUS Cirrus Logic Inc ($67.05) - Semiconductors - With the most recent action, CRUS broke a triple top at $67, marking a new all-time high on the chart. This stock is a perfect 5 for 5’er as it is trading in a positive trend and is showing significant strength relative to both the market and its peers. Additionally, this stock has bullish price objective of $95, suggesting the potential for further upside from here while offering a reward to risk ratio north of 6. Okay to buy or hold here as demand is in control. The first sign of trouble from here comes with a move to $62, a double bottom sell signal. |
| DSW DSW Inc. ($18.66) - Retailing - DSW broke a spread triple bottom at $18.50, a low watermark not seen on the chart since March 2011. This stock is an unacceptable 0 for 5’er within the unfavored Retailing sector that has been trading below the bearish resistance line since May 2014. Monthly momentum has been negative for two months, suggesting the potential for further downside from here. Additionally, the bearish price objective is $4. Avoid as supply is in control and there is no remaining support on the chart. Note earnings are slated for 5/23/17. |
| EMKR EMCORE Corporation ($10.85) - Semiconductors - EMKR broke a double top at $11 on Tuesday, marking a new 52 week high. This stock has been trading in a positive trend since September 2014 and is a strong 5 for 5’er within the favored Semiconductors sector. Weekly momentum has been positive for four weeks, suggesting the potential for further upside from here. Additionally, the bullish price objective is $18.75, adding to the positive technical picture. Okay to hold here or buy on a pullback as the stock is nearing the top of the 10 week trading band. The first sign of trouble from here comes with a move to $8, a double bottom sell signal. |
| FL Foot Locker, Inc. ($71.70) - Retailing - broke a triple bottom at $71. The stock is now on a sell signal and lies just above its bullish support line which is at $70. Although a 4 for 5'er, FL needs to hold this support and move back to a buy signal before positions can be considered. If long, watch for the move to $69 which will be a violation of the bullish support line. Under that level the next support on the chart is at $66. |
| GKOS Glaukos Corp. ($40.29) - Healthcare - broke a double bottom at $39. GKOS is a 3 for 5'er. However, this is the second consecutive sell signal and the move follows a triple bottom break which completes a bearish catapult formation, The next support on the chart is at $38, a previous level of support but under that it is at $31, the bullish support line. No new positions here and those long can consider moving to the sidelines. |
| LB L Brands Inc. ($48.42) - Retailing - LB broke a double bottom at $49 a day before expected earnings. This stock is a weak 0 for 5’er as it does not have any positive trend or relative strength characteristics in its favor at this time. Additionally, LB ranks 71st out of 89 stocks within the Retailing sector RS matrix, making this one of the weakest names within this unfavored space. Avoid as supply is in control. The final level of near-term support on the chart is at $44. Resistance is at $53. Note earnings are slated for tomorrow, 5/17. |
| MPWR Monolithic Power Systems Inc. ($98.17) - Semiconductors - MPWR broke a double top at $97 and continued higher to $98. This stock is a strong 4 for 5’er that has been trading in a positive trend since October 2015. Monthly momentum just flipped positive, suggesting the potential for further upside from here. Additionally, this stock has a price target of $110, adding to the positive technical picture. Okay to initiate new positions on the breakout as the weight of the evidence is positive and demand is in control. The first sign of trouble comes with a move to $89, a double bottom sell signal. |
| OXM Oxford Industries Inc ($54.84) - Textiles/Apparel - OXM broke a double bottom at $55 on Tuesday. This stock is an unacceptable 1 for 5’er that is trading below the bearish resistance line. Monthly momentum has been negative for four months, suggesting the potential for further downside from here. Avoid as supply is in control and the weight of the evidence is negative. The next level of near-term support is at $53. Further support is afforded at $50. |
| Name | Option Symbol | Action | Stop Loss |
|---|---|---|---|
| Arch Capital Group Ltd. - $95.30 | O:ACGL 17I95.00D15 | Buy the September 95.00 calls at 4.00 | 91.00 |
| Name | Option | Action |
|---|---|---|
| PowerShares QQQ Trust ( QQQ) | Jun. 114.00 Calls | Raise the option stop loss to 23.00 (CP: 25.47) |
| Citigroup, Inc. ( C) | May. 55.00 Calls | Raise the option stop loss to 7.00 (CP: 7.45) |
| Name | Option Symbol | Action | Stop Loss |
|---|---|---|---|
| Athenahealth, Inc. - $109.75 | O:ATHN 17U115.00D15 | Buy the September 115.00 puts at 11.50 | 128.00 |
| Name | Option | Action |
|---|---|---|
| National Retail Properties, Inc. (NNN) | Jun. 45.00 Puts | Raise the option stop loss to 5.50 (CP: 7.50) |
| Macy's Inc. (M) | Aug. 35.00 Puts | Raise the option stop loss to 10.00 (CP: 12.30) |
| Energen Corporation (EGN) | Oct. 55.00 Puts | Stopped at 55.00 (CP: 54.83) |
| Name | Option Sym. | Call to Sell | Call Price | Investment for 500 Shares | Annual Called Rtn. | Annual Static Rtn. | Downside Protection |
|---|---|---|---|---|---|---|---|
| Medidata Solutions, Inc. $69.32 | O:MDSO 17J75.00D20 | Oct. 75.00 | 3.70 | $33,685.00 | 23.90% | 10.20% | 4.20% |
| Name | Action |
|---|---|
| Micron Technology, Inc. (MU) - 28.83 | Sell the July 29.00 Calls. |
| Momo Inc (China) ADR (MOMO) - 40.11 | Sell the October 40.00 Calls. |
| TTM Technologies, Inc. (TTMI) - 16.19 | Sell the September 17.50 Calls. |
| Tutor Perini Corporation (TPC) - 28.00 | Sell the October 30.00 Calls. |
| The Chemours Company (CC) - 45.27 | Sell the October 44.00 Calls. |
| Lumentum Holdings Inc (LITE) - 54.55 | Sell the September 55.00 Calls. |
| Wynn Resorts, Limited (WYNN) - 125.69 | Sell the September 130.00 Calls. |
| Name | Covered Write |
|---|---|
| Dish Network Corporation ( DISH - 61.51 ) | September 62.50 covered write. |
| Servicenow Inc ( NOW - 97.95 ) | August 100.00 covered write. |
Daily Equity & Market Analysis
Loading, Please Wait...
