
We continue our annual "12 Days of Christmas" series today with the next installment of "Themes to Know for 2017." We'll touch on the improvement within the US Dollar and how it historically performs in rising and falling dollar environments.
We continue our annual "12 Days of Christmas" series today with the next installment of “Themes to Know for 2017." When we look at where the last 12 months has left us with respect to our indicators, key charts, and other relationships, there are several themes we feel are particularly noteworthy and are worth exploring in this year's series of features. In case you missed it, you can review the article for Days 1 & 2 using the links below:
Day 1: "Sector Themes: The Rise of the Financials Sector"
Day 2: "Sector Themes: The Rise of the Energy & Industrial Sectors"
Day 3 - The US Dollar Study
Today we wanted to spend some time on the US Dollar to provide you with an updated view on its technical picture and some historical context for its price movements. We find now is a very important time to delve into the behavior of the "greenback," as the US Dollar’s recent improvement has been among the more notable positive developments and is a trend we need to be aware of as we head into 2017. On a year-to-date basis the US Dollar has gained 2.37% (thru 12/12/2016), but much of that performance has come during the fourth quarter, as the US Dollar has gained 5.80% since the start of October. This action has pushed the greenback to reach levels that haven’t been seen since April of 2003. This dollar has been bullish since May 4, 2011, the start of the current "rising dollar environment," making it now the longest rising dollar environment since we have been tracking this currency. With that said, let's take a look at the nearer term picture of Dollar, and then we will expand our view and analysis.
What is the US Dollar Index (DX/Y)?
To begin we should first explain that the US Dollar Index DX/Y is priced in terms of a weighted basket of major foreign currencies. When we refer to moves in "the dollar," it is this index to which we are referring. The US Dollar Index is a geometrically-averaged calculation of six currencies weighted against the US dollar, which has been in existence since 1973. Futures Contracts were listed on the Index back in 1985 and only one major reconstitution of the Index has taken place since that time, a move to include the Euro.
Today the US Dollar Index contains six component currencies, which are "trade-weighted": the Euro, Japanese Yen, British Pound, Canadian Dollar, Swedish Krona and Swiss Franc. Prior to the formation of the Euro FX, the US Dollar Index contained ten currencies, including as well the West German Mark, French Franc, Italian Lira, Dutch Guilder and Belgium Franc. Today the currency weights contributing to the pricing of this Index are as follows:
Currency Weights:
- Euro = 57.6%
- Canadian Dollar = 9.1%
- Japanese Yen = 13.6%
- Sweden Krona = 4.2%
- British Pound = 11.9%
- Swiss Franc = 3.6%
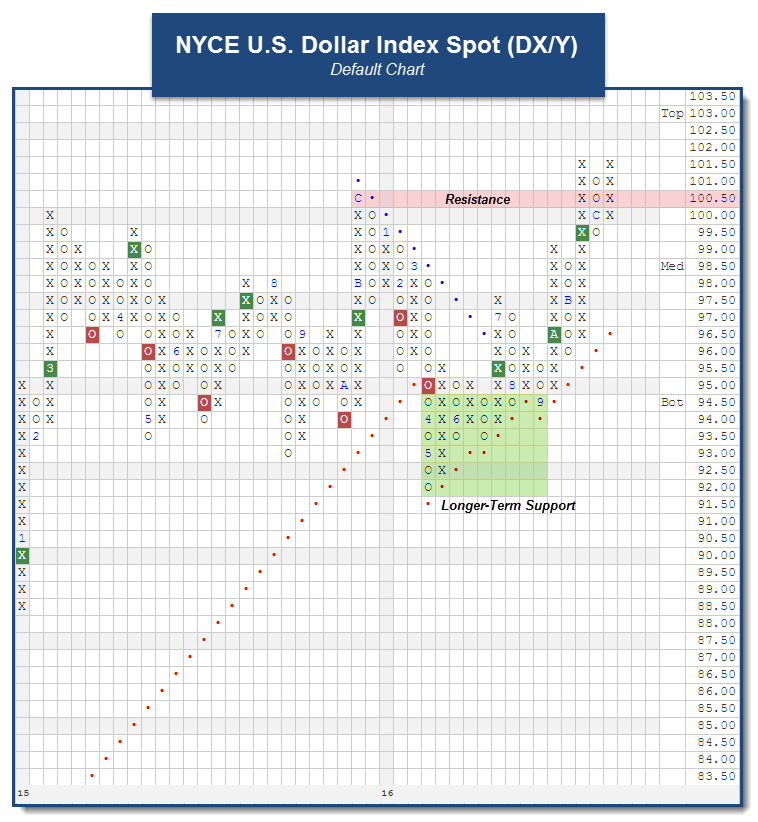
Although we continue to find ourselves in a rising dollar environment, anyone who has been following the US Dollar Index DX/Y, knows that not much rising was seen between March of 2015 and November 2016. After rallying up to the $100 level in March 2015, the Dollar consolidated between $93 and $100 for much of the year. We eventually witnessed the Index better its highs in December by moving up to the $100.50 level, but this was shortly followed by a roughly 8.5% drawdown during the first part of 2016, which brought the currency into a negative trend. After finding support at $92, the Dollar rallied to move back to a near-term buy signal in June and the trend shifted back to positive in July. As the currency has continued to show improvement, we have seen it rally to up to the $101.50 level, which cleared resistance at $100.50 and made for a 52-week high. Currently, we continue to trade near these highs, and this has brought us to levels we haven’t seen on the chart since April of 2003. Overall, the new high continues a strong uptrend in the Dollar. From here, initial support can be found at $99.50 and at the bullish support line at $97. Additionally, multiple levels of support also exist below the trend line, the most notable being at $92, the May 2016 low. As the US Dollar continues in its positive run, it is worth understanding the historical implications of a rising dollar, which we discuss in further detail below.
Our data on this Index goes back to the point in time when a liquid market was created for this calculation of the Dollar with the inception of futures contracts on the US Dollar Index (in 1985). Since that time we have seen many significant moves for the Dollar, and we would like to focus on identifying any meaningful correlation between other major asset classes and moves in the underlying currency markets. In other words, do some assets perform better with consistency in a rising dollar market, and vice versa?
Traditional measures of correlation would look at daily or monthly returns of some security, the Dollar for example, and then match up the returns of something else (a bond index perhaps) in the same manner. If bonds were generally up during the same sessions that the Dollar posted gains, they would be considered positively correlated. If bonds were generally down during days (or months) when the Dollar was up, they would be considered inversely correlated. Such data is available elsewhere and didn't truly provide the type of research we wanted to provide to you. Before we began to study this we set out a definition for "rising dollar market", versus a "falling dollar market."
Study Parameters:
- Rising Dollar Market: Any move of at least 10% from a low constitutes a new "rising dollar market." The beginning of this trend is established at the low watermark and the trend remains in force until a correction of at least 10% occurs, at which point the peak of that rally then marks the end of the rising trend in the dollar. This represents a "trough to peak" move in the dollar, and that time period is what we use to qualify a rising dollar market.
- Falling Dollar Market: Any decline of at least 10% in the dollar index from a peak begins a "falling dollar market". The beginning of this trend is established at the high watermark and the trend remains in force until a rally of at least 10% occurs off a low, at which point the trough of that decline marks the end of the falling trend in the dollar. This represents a "peak to trough" move in the dollar, and the time period within is what we used to qualify a falling dollar market.
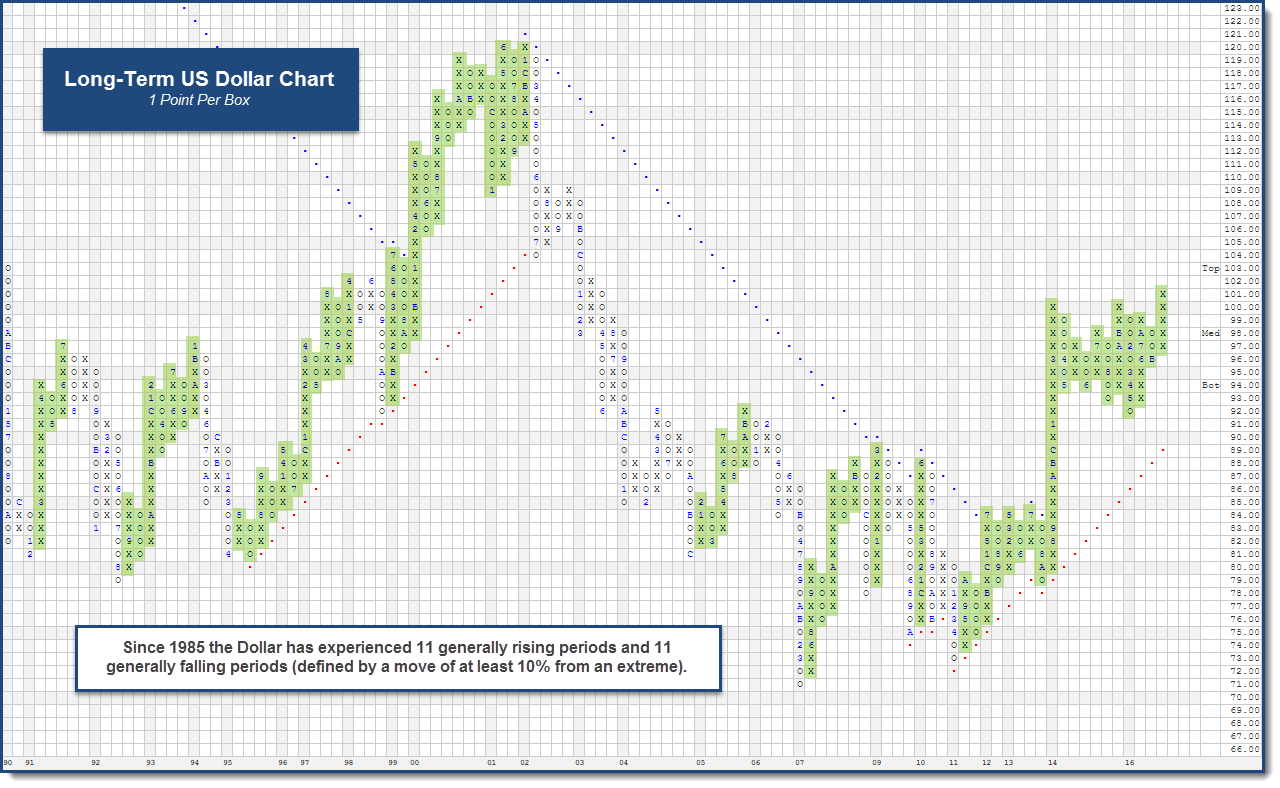
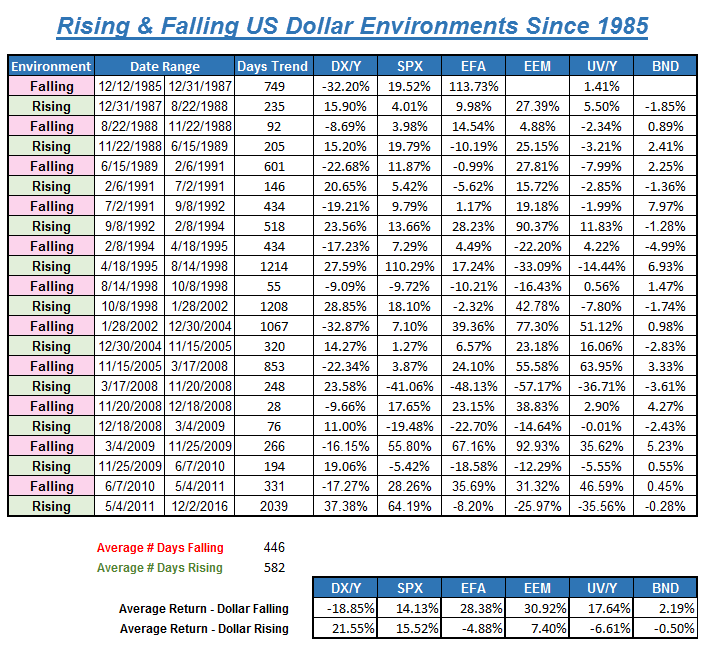
As the chart above shows, there have been various markets for the US Dollar over the last 31 years. In sum, there have been a total of 11 rising dollar markets and 11 falling dollar markets (including the current "rising" stint, which began on May 4th, 2011) using our basic criteria. Interestingly, the duration of each (rising or falling) has averaged 514 days during the study period and resulted in moves of about +/- 20% in each direction (keep in mind that the manner in which these trends were calculated means that no trend could have resulted in a move materially less than 10% in either direction). What is worth noting is that the current "rising dollar" period has now become the longest on record, running at +2,000 days so far. This has helped the average number of days for a rising dollar to push up to 582. Moreover, the return for DX/Y during the rising environment is well above the average +21%, coming in at +37.38% during this recent rising dollar period (through 12/6/2016). Below we offer you a recap of all the historical rising and falling dollar environments, and associated returns for DX/Y, in addition to other pertinent benchmarks.
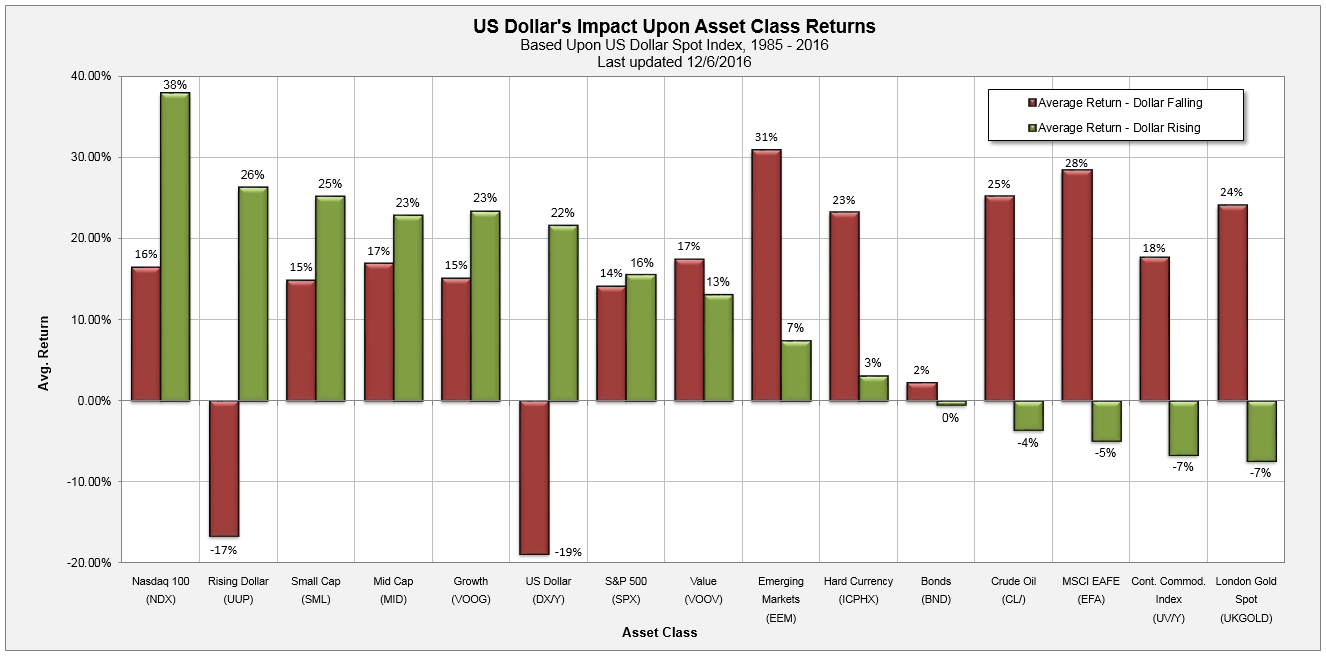
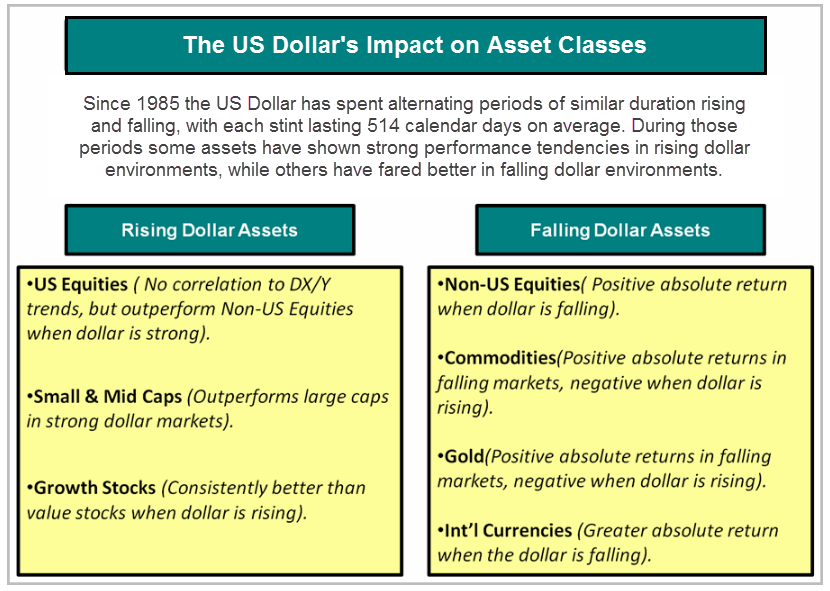
Having identified "rising dollar" and "falling dollar" environments going back to 1985, the next step was to look at various asset classes and their respective performance during these markets. To accomplish this we chose investment vehicles representing Domestic Equity, International Equity, Emerging Markets, Domestic Fixed Income, Foreign Currency, Various Equity Styles (Large, Mid, Small, Value, and Growth), and Commodities. The results were interesting as many assets did show meaningful performance biases during either rising or falling dollar markets.
The red bars in the graphics below represent average performance during all falling dollar markets, while the green bars represent average performance by that same asset class during all rising dollar markets. For some assets we did not have data going back to 1985, so returns reflect the average since the time at which we had data (those dates are denoted). For example, based on the graphic below we can see that the S&P 500 Index SPX has performed well in both rising dollar and falling dollar markets, and has averaged positive absolute returns in both during our study period. Generally speaking, in a rising dollar market, Small Cap US stocks, Mid Cap US stocks, and Growth stocks (though not always Value) tend to do quite well. Interestingly, it has been the Nasdaq 100 NDX that has produced the greatest gains during a rising dollar period with an average return of +38%. Meanwhile, strong asset classes during falling dollar periods include Non-US Equities and Commodity indices, as well as Gold. Emerging Markets EEM had an average return of 31% during falling dollar periods, followed closely by Developed (International) Markets EFA, which gained 28%.
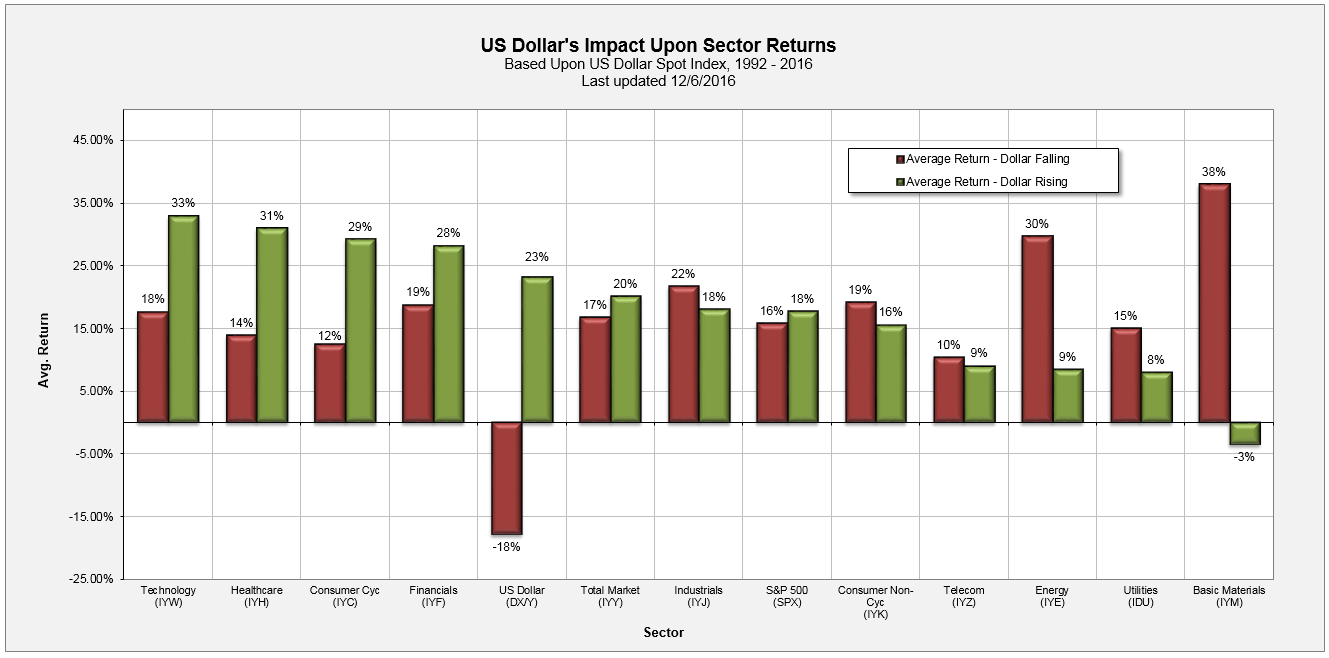
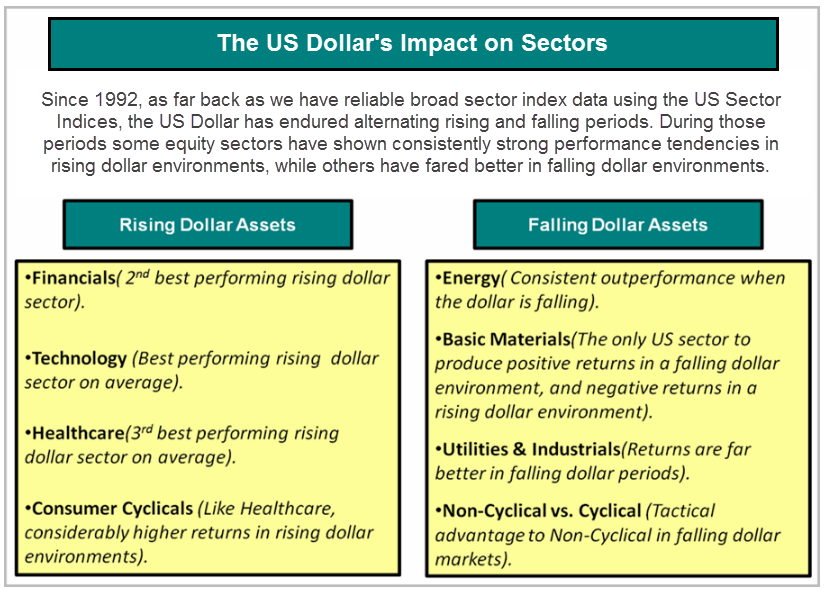
We found the results of this initial study interesting enough to add another layer to it, looking specifically within the US Equity market, but sub-dividing it based upon broad sectors. We had to adjust the time frame of the study a bit based upon data availability, but we have sector index data beginning in 1992, affording ample history for a meaningful data sample. Again, our study includes the old 10 broad market sectors (Basic Materials, Consumer Cyclicals, Consumer Non-Cyclicals, Energy, Financials, Healthcare, Industrials, Technology, Telecommunications, and Utilities). The results of the study are found below, and the red bars represent average performance during falling dollar markets, while the green bars represent average performance by that sector during rising dollar markets. Interestingly, four of the sectors performed better in rising dollar markets, while six performed better in falling dollar markets. Of note, the Basic Materials sector is the best performing group, by far, when the dollar is falling; and also the only sector to post negative absolute returns during rising dollar environments! Energy is the other big beneficiary during a falling dollar market. Conversely, when the dollar is rising, Technology, Financials, Consumer Cyclical, and Healthcare are historically the notable winners. One last point on the sector performance is that Energy has historically held up in a rising dollar market, despite its connections to Commodities, having posted returns that slightly lag the market.
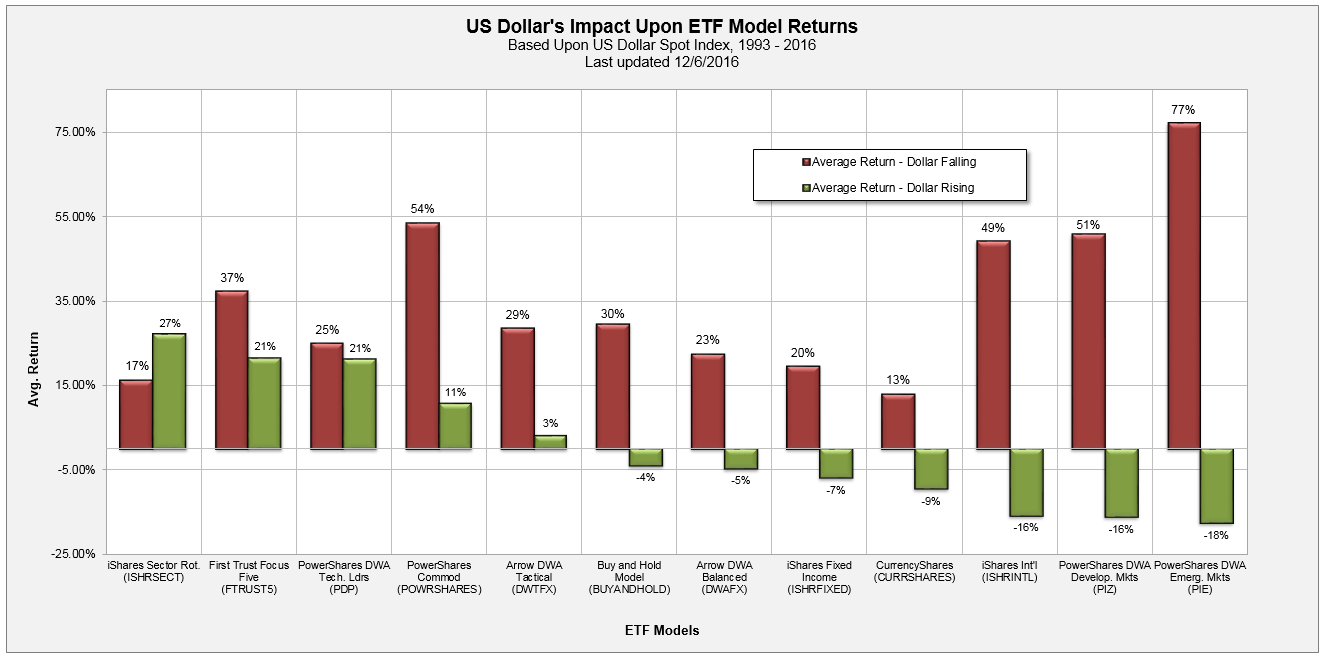
We also examined a handful of Guided ETF Models and DWA products during both rising dollar and falling dollar markets. The performance data was based upon the US Dollar Spot Index and data from the ETF Models and DWA Products (using back-tested data prior to the product or model's inception date). To some extent, much like the Asset Class returns examined above, the ETF models and products produced similar returns per asset class during rising and falling dollar markets. As it turns out the PowerShares DWA Emerging Market Momentum ETF PIE was the best performing asset during a falling dollar market along with the other assets tied to Commodities and International Equities. Interestingly enough, all models and products examined below produced double digit returns during falling dollar environments, but the majority of outperformance came from Commodity and Non-US Equity related exposure. During rising dollar markets, US Equities outperformed as the iShares Sector Rotation Model ISHRSECT was the best performing model below, up an average of 27%. The PowerShares Commodity Model POWRSHARES produced positive returns, along with the First Trust Focus Five Model FTRUST5, PowerShares DWA Momentum ETF PDP, and the Arrow DWA Tactical Fund DWTFX. Notice how International Equities underperformed the most during rising dollar markets as the iShares International Model ISHRINTL, PowerShares DWA Developed Markets Momentum ETF PIZ, and PIE were in double digit, negative territory during periods where the dollar was rising. As well, during rising dollar environments, which often encompass rising interest rate periods, the iShares Fixed Income Model ISHRFIXED was down an average of -7%.
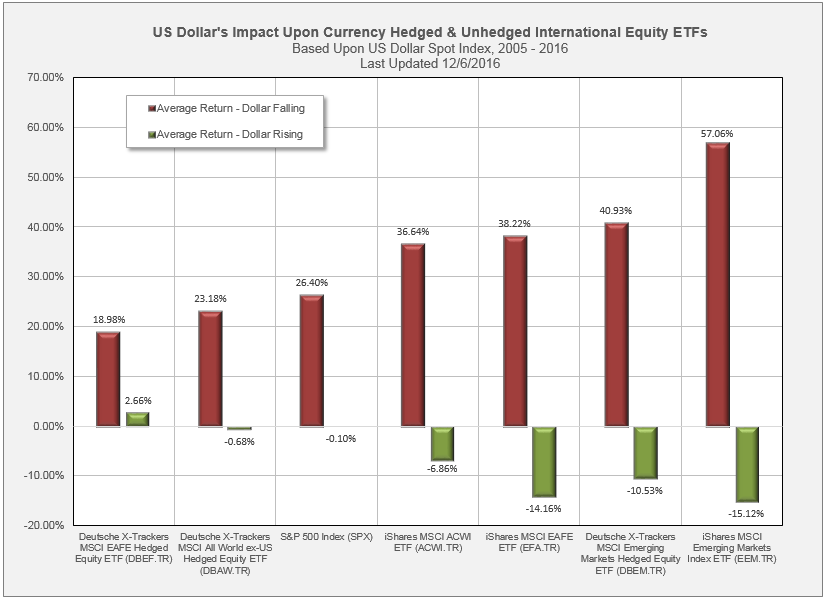
As you saw in the Asset Class study, International Equities tend to struggle during rising dollar environments and thrive in falling dollar environments. But what if you were to hedge for the currency exposure? Would that have any impact on the returns for International Equities in either dollar environment? Recall that if you buy a non-currency hedged international equity ETF, there are multiple conversions that have to take place, adding currency risk into the equation. Your US Dollars are converted into foreign currencies because the underlying shares in the ETF are denominated in currencies other than US Dollars. Even if the local markets rise in value, those gains can be eliminated because of a depreciating local (foreign) currency, ie: a rising dollar environment. It is because of that type of scenario that International Equities tend to struggle in rising dollar environments. The investment is worth less because of a depreciating local currency. However, in theory, hedging the exposure through a currency hedged product would help protect against such an event because it would mitigate the negative impact of a rising dollar on a foreign equity investment.
In the study below we looked at three sets of hedged and unhedged currency ETFs. We looked at Emerging Markets, Developed Markets, and All World ex-US. Notice how all of the International ETFs, hedged and unhedged, did well during a falling dollar (red) environment, confirming what we found in the Asset Class study. However, there is a difference in how they perform, on average, in a rising dollar environment. Notice how all of the unhedged International ETFs produced negative average returns in rising dollar environments, yet their hedged counterparts (except for the Emerging Markets version) were able to mitigate some of the impact of a rising dollar. The biggest difference can be seen looking at the Deutsche X-Trackers MSCI EAFE Hedged ETF DBEF.TR versus the unhedged iShares MSCI EAFE ETF EFA.TR. In a rising dollar environment, EFA.TR was down an average of -14.16% while DBEF was up an average of +2.66%. Suffice it to say, investors do stand to benefit from being currency hedged in a rising dollar environment. Although the hedged ETFs were still positive during falling dollar environments the returns were muted compared to their unhedged counterparts. (Editor's Note: Correction to the graph for EFA.TR and EEM.TR / 12/21/16).
We touched on the broader Asset Classes earlier and we discovered that Commodities generally perform better during a falling dollar environment versus a rising dollar environment. We wanted to delve deeper and find out if any particular Commodity groups perform better than others during rising and falling dollar environments. For this exercise, we used the PowerShares DB Energy Fund DBE, the United States Copper Index Fund CPER, the SPDR Gold Trust ETF GLD, and the PowerShares DB Agriculture Fund DBA to represent the broad Commodity groups. Each of these funds have index data going back to 1991, and the results of the study are very interesting. As we can see in the graph below, Energy generates positive returns on average during both rising and falling dollar environments in our study, although on average the performance in a falling dollar environment is decidedly better. Copper on the other hand registered the best performance on average when the dollar is falling at 59%, while Gold and Agriculture are up 28.33% and 24.73%. All three of the aforementioned sub-groups of Commodities lost in excess of 4% on average during rising dollar environments.

The performance information above is based on price return, not inclusive of dividends or all transaction costs. Prior to each ETFs inception date, performance data is created using underlying index data. Investors cannot invest directly in an index. Indexes have no fees. Past performance is not indicative of future results. Potential for profits is accompanied by possibility of loss.
Some performance information presented is the result of back-tested performance. Back-tested performance is hypothetical (it does not reflect trading in actual accounts) and is provided for informational purposes to illustrate the effects of the discussed strategy during a specific period. Back-tested performance results have certain limitations. Such results do not represent the impact of material economic and market factors might have on an investment advisor’s decision making process if the advisor were actually managing client money. Back-testing performance also differs from actual performance because it is achieved through retroactive application of a model investment methodology designed with the benefit of hindsight.
Each investor should carefully consider the investment objectives, risks and expenses of any Exchange-Traded Fund ("ETF") prior to investing. Before investing in an ETF investors should obtain and carefully read the relevant prospectus and documents the issuer has filed with the SEC. ETF's may result in the layering of fees as ETF's impose their own advisory and other fees. To obtain more complete information about the product the documents are publicly available for free via EDGAR on the SEC website (http://www.sec.gov).
