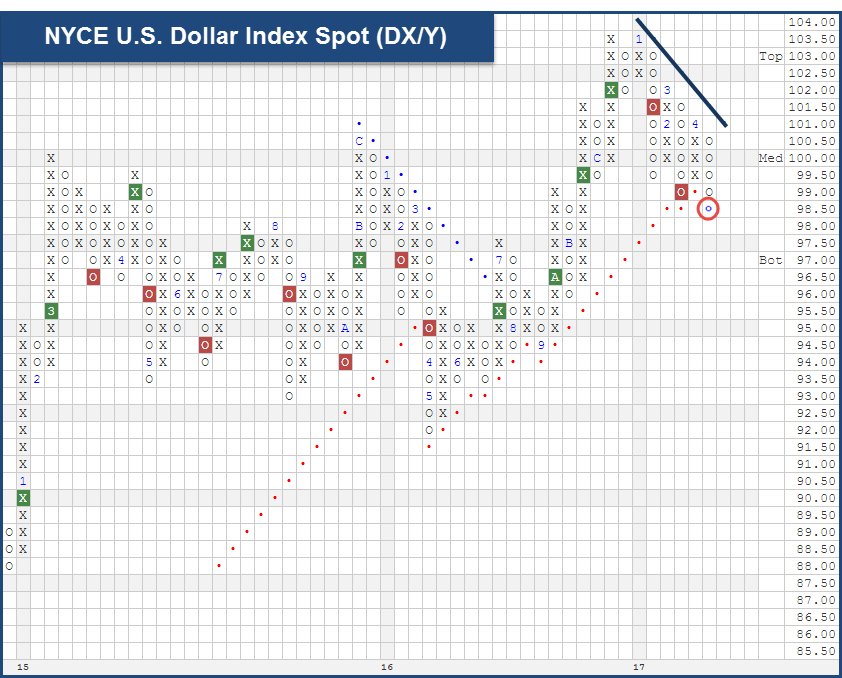
With today's intraday action, the chart of the NYCE U.S. Dollar Index Spot (DX/Y) broke a third consecutive double bottom with a move below $98.50, and violated bullish support line.
Although we’ve technically found ourselves in a rising dollar environment dating back to May 4th, 2011, we have seen deterioration on the chart of the NYCE U.S. Dollar Index Spot DX/Y over the past four months. With today’s intraday action, the Spot chart broke a third consecutive double bottom at $98.50. This move also violated the bullish support line that had been in tact since June 2016, flipping the trend negative. As a refresher, any move of at least 10% from a low constitutes a new “rising dollar market” while a decline of at least 10% in the dollar index from a peak begins a “falling dollar market”. At current levels, the Index has fallen roughly 5% off of the recent peak in January of $103.82, meaning we are still roughly 5% away from triggering a new falling dollar environment, which would come with a move to $93.43. As mentioned earlier, we have been in a rising dollar environment since May 4, 2011, making it the longest rising dollar environment since we have been tracking this currency. Click here to read the last US Dollar Study that we published on December 13th, 2016. We will continue to monitor this Index for any future developments.