Most Requested Symbols

Spring 2016 Point & Figure Institute | Las Vegas, NV | April 21st & 22nd | Event Agenda | Registration |

DWA State of the Market & Q1 2016 Update Webinar
On Thursday, January 21st at 12:00PM EST, Dorsey Wright will conduct a webinar to discuss the current state of the market as we begin Q1 2016. The relative strength strategies behind the growing line of products that follow DWA indexes and models will also be covered, as well as practical implementation ideas for using these products. We like to hold these calls at the beginning of each quarter, as that is when we reconstitute our Technical Leaders Indexes, which are tracked by the 14 PowerShares ETFs. Tammy DeRosier, President of DWA, and John Lewis, Vice President and Portfolio Manager, will host the discussion. There is no cost to attend the webinar, but space is limited and registration is required. A replay will be made available to all registrants.
Click here to reserve your spot today! The password is: pnfpnf
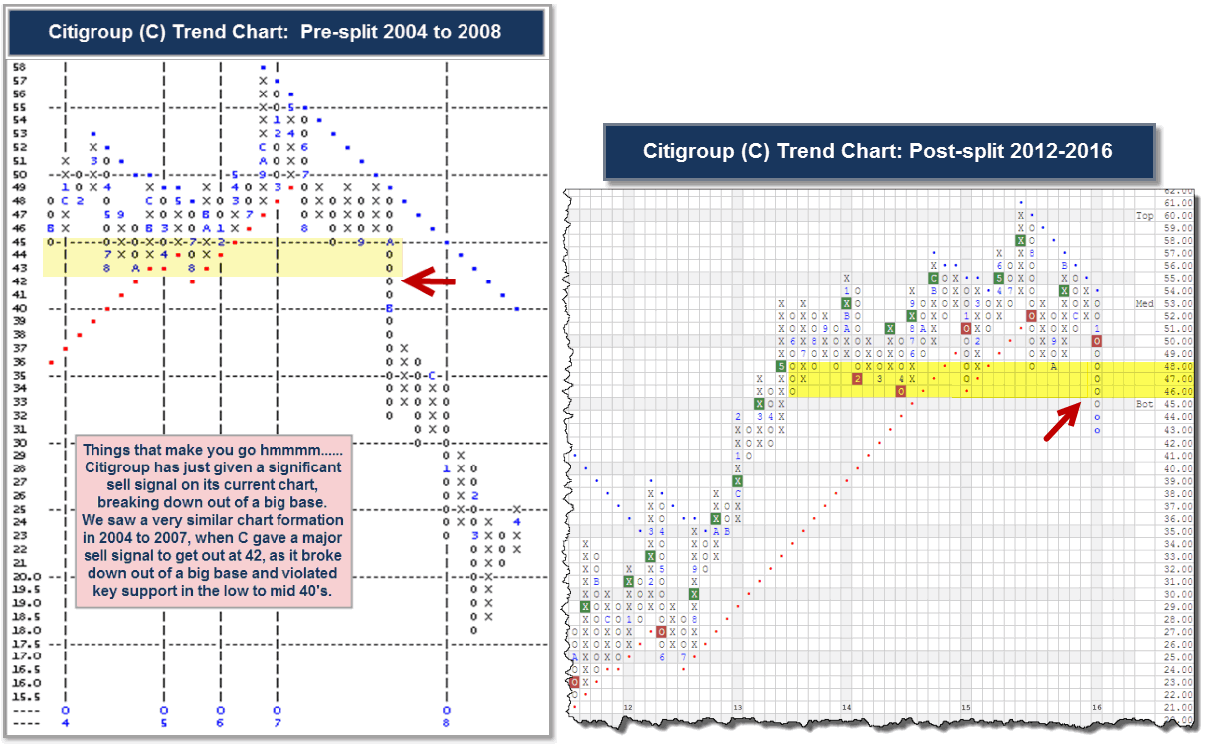
While looking through the charts the other day, reviewing the aftermath of this past week's volatility, one chart ominously stood out - Citigroup, Inc. C. During the recent market rout, C manged to stay out of the headlines, unlike the 2008 financial crisis and market meltdown. So why bring it up today? Well, if you look at C's chart today, which features a recent trendline violation and big base breakdown, and compare it to C's 2007 collapse, the two charts from the two different periods look quite similar. Between 2004 and 2007, we saw C forming a big base before ultimately breaking down in late 2007. C peaked in December 2006, before trading lower, and then broke through the trendline at $48 (pre-split price levels) before falling to the low 40's. It was around this region where considerable support had formed, going back to 2004. Ultimately, we know what happened, C broke through all of the support, starting with a triple bottom break in October 2008 at $44, then a violation of the 2004-2005 support lows with the move to $42. Fast-forward eight years, the chart is set up in almost the exact same manner, which does not leave one with a warm fuzzy feeling. After peaking in July 2015, C began to work down from the top, trading lower and violating its bullish support line. C managed to regain some demand, rallied up to the trendline, just like it did back in 2007, but failed to penetrate the bearish resistance line (just like it did back in 2007, sorry for the repetition). All the while, it was forming a big base that dates back to 2013. With the recent market action, C fell even further, violating support in the 46 to 48 region, echoing the 2007 breakdown (sidebar: the breakdown also occurred around similar price levels). The charts below show you exactly how and where the breakdowns occurred. As you can see, the charts look similar. Hopefully this isn't a major tell for the market and is rather just some coincidence, but it certainly makes you go, "Hmmmmm...."

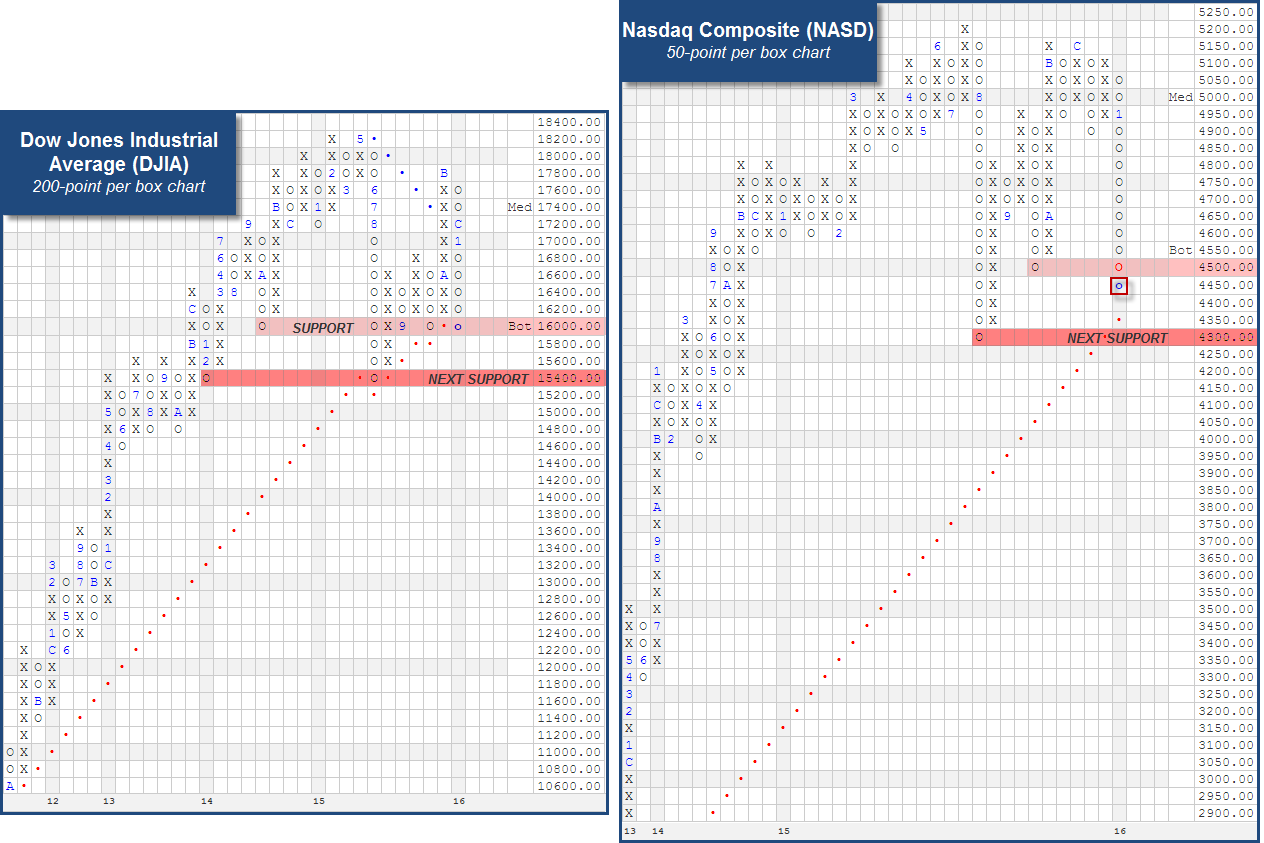
In Monday's Daily Equity Report from last week, we provided an in depth update on where we stand in terms of our "Defensive Preparedness" indicators. What we found is that the weight of the evidence had shifted from positive to negative with the last few weeks of market activity. Throughout the remainder of the week, things went from bad to worse, especially with Friday's activity. The S&P 500 SPX fell through another key support area taking out its August/September lows at $1880 on the 20-point per box chart with a low of $1860. The Dow and the Nasdaq were both also down substantially as well, and the calls were steady throughout the day. We will use today's report as an opportunity to address some of the "FAQs" we received last week and Friday afternoon in particular.
1. What's going on with the Market?
This is a broad question that perhaps can be best addressed by looking at the trend charts of the broad indexes. Below you will find a snapshot of the PnF charts for the SPX, the DJIA and the NASD. Looking at these charts, if we ask ourselves, "What's going on with the market?" the answer is clearly that supply is in control of equities at this juncture. Below are some key observations for each chart:

2. Has this week's action caused any changes in key RS comparisons?
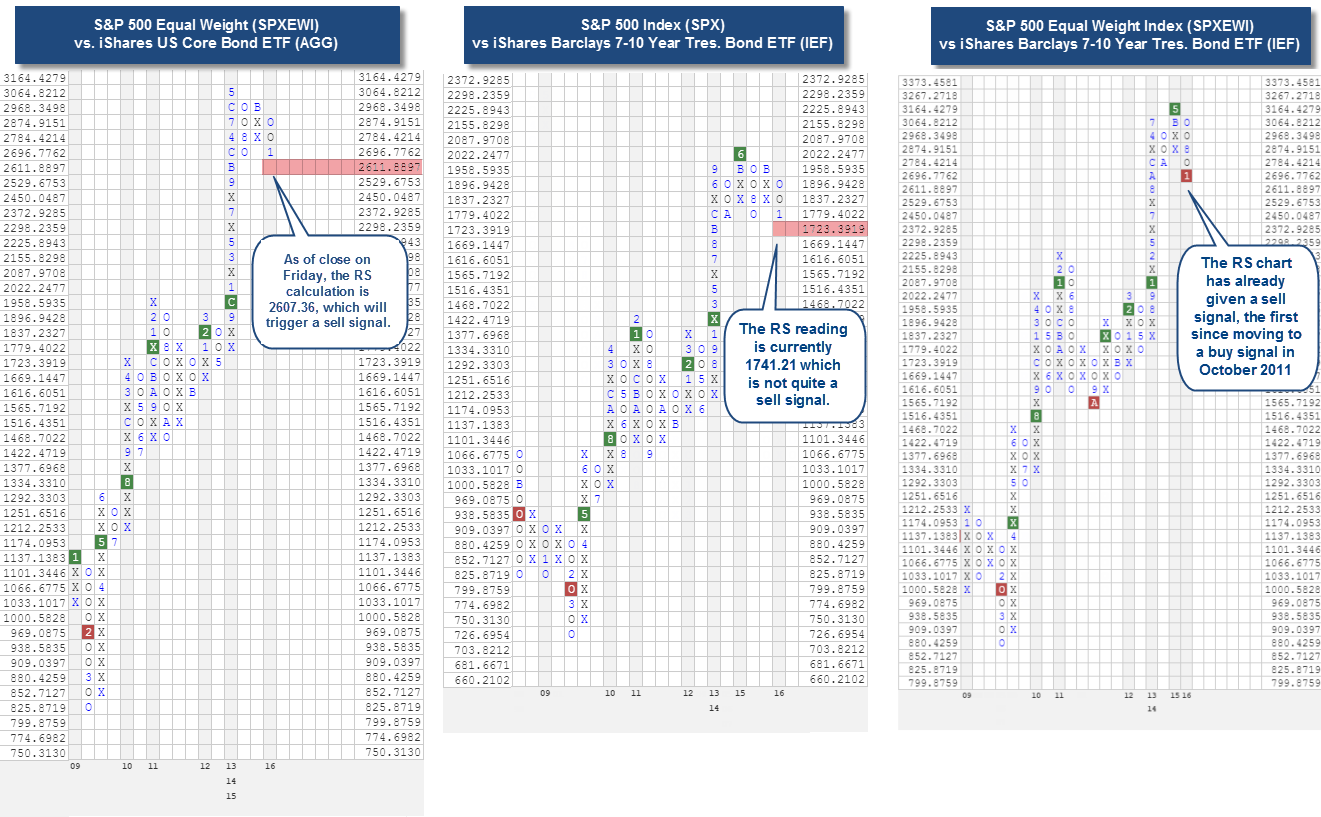
The relative strength relationships of Equity indices versus Fixed Income and/or Cash indices have been good indicators for us over the last twenty years. So not surprisingly, we, and many of you, are watching these closely. In the images below you can see that we are at a pivotal point on several of these charts, and have started to see some changes on others. One chart that is likely getting a lot of eyeballs is the SPX versus iShares Core US Bond ETF AGG. Because we use closing prices for RS calculations, this chart will not quite reverse into O's as the market was able to rally back from its intraday lows on Friday afternoon. A reversal on that chart would put us one box from a sell signal, and the sell signal would be the first since moving to a buy signal in the summer of 2009. In contrast to the SPX, the S&P 500 Equal Weighted Index SPXEWI has been struggling a little more as the large cap names have helped disguise some of the carnage. With Friday's close, the SPXEWI index will fall to a relative strength sell signal versus the AGG. The SPXEWI has already given a sell signal versus the iShares 7-10 Year Bond Fund (IEF). Should we have a plurality of these charts fall to sell signals, it would suggest an even more defensive stance and a posture of losing opportunity and not losing money. We can always make up opportunity but it’s hard to make up money. A final takeaway from these charts is that the sell signals don’t happen at the exact top, we don’t expect that, but when they do occur there is usually have decent follow through with equities continuing to face several months of supply being in control. We will continue to keep you updated on any changes in these charts.
3. What should I do with my stock positions? Sell? Buy? Hold? Duck-and-Cover?
The answer to this one is: review! While we do not recommend putting new money to work here, what we do recommend is that you are diligently reviewing each stock chart (and ETF or fund chart, for that matter). There are times where simply focusing on strong attributes/Scores and positive trend lines alone is adequate. This is not one of those times. Use the Portfolio tool and the Thumbnails view to be able to look at the trend charts for each of your holdings. What are you looking for? Well let's work through a couple of examples to help you hone in on what to pay attention for. We'll examine what we would categorize as a good stock versus a bad stock.
One theme we have noticed over the last few weeks, and often comes to the surface during tough markets is a "flight to safety". This means the Large Cap, low beta, higher yielding names are typically the areas that hold up and may even show signs of increasing demand. CLX is an example of such a stock. It is also categorized within the broad Consumer Non-Cyclical sector, which finds itself in the #2 ranked spot of the Sector level of DALI. Looking at the default chart, notice that CLX has done little more than pullback toward the middle of its 10-week trading band. However, the default chart also doesn't offer any viable support until the $106 level, so we have included the more sensitive 1-point per box chart to show several reasonable support levels. A violation of these levels can be used as partial or full stops for any open positions moving forward, but as of now, there has been no material breakdown on the chart, and it remains above even its November support. One of the main reasons CLX remains on our "hold" list, though, is not the attractive chart, but the fact that it is one of just 9 stocks in the entire S&P 500 that have given a new market RS buy signal. This confirms that CLX is a positive diverger. Finally, CLX offers an attractive yield of about 2.4%.

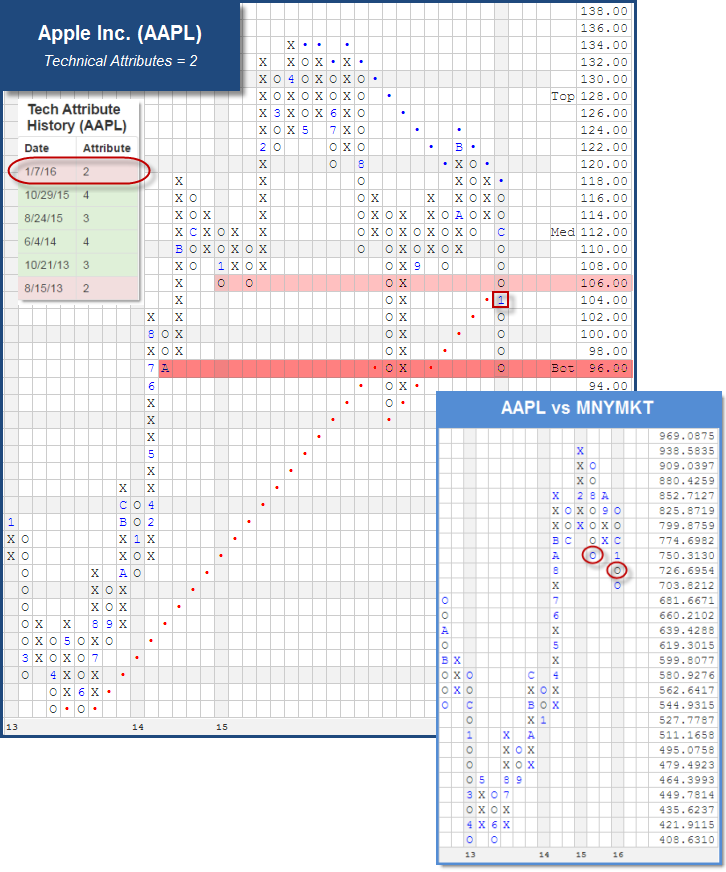
While Apple might not be the absolute worst stock out there, we selected it for this exercise for two reasons. First, everyone wants to know about Apple. Second, Apple is a position that is very easy to get emotional about. From a strictly objective, technical standpoint, the weight of the evidence is negative for AAPL, which is the first time in a few years that this has been the case. In fact, with the recent trend line violation the stock downticked to a 2 for 5'er, making it a weak attribute name for the first time since October of 2013. AAPL can be categorized as a negative diverger given that it violated its September lows ahead of the market earlier in the month. If we ignore the volatile action that occurred on the chart during the trading session on August 24th (with the stem down to $92), we find that the move to $104 actually took out all of the support built in 2015. It's current move to $96 puts it right up to its October 2014 low. Additionally, take a look at the RS chart of AAPL versus Cash MNYMKT. It initially fell to a sell signal in August, demonstrating weak RS versus Cash. While it was able to rally ahead of the market and return to X's in September and October, it has since returned to a column of O's and completed a second sell signal on this RS chart. The last time this chart was on a sell signal was back in mid-2013. For these reasons, AAPL is characteristic of stocks that should be sold out of the portfolio, especially on any future bounce over the next several days.
4. What should I continue to watch?
There are two indicators we will be keeping a close eye on in the coming days and weeks, both found within DALI.

Michael Batnick of The Irrelevant Investor cites statistics from SPIVA showing that 79.59% of large-cap managers have failed to beat their benchmark over the last 10 years and then makes these astute observations:
I believe the days of superstar stock pickers is a thing of the past. For many of these professionals, career risk is too large a hurdle to overcome. Straying too far from the index keeps their returns looking a lot like it and fees generally eat up any alpha they might earn. Aside from career risk, here are a few other risk factors to consider that can negatively affect a portfolio manager.
This is just too many maybes and why I believe that if you’re going to deviate from the index, it’s important to do so in a systematic way. With quantitative strategies, you understand there will be times when it falls out of favor, in fact you sign up for that ahead of time. However, if a stock picker hits a rough patch, you don’t know if they will ever regain the ability it appeared they once had. Furthermore, it can be difficult to ascertain what caused them to outperform in the first place; that whole thing about distinguishing luck from skill.
When considering active strategies, it’s important for us that we’re not relying on anyone’s intuition, expertise, or mental or emotional well being. We don’t want our PMs speaking with management, doing channel checks or backing out the cash. We want them to follow their models with as little interference as humanly possible.
A focus on process over short-term results is a hallmark of DWA. We long ago recognized the need to systematize strategy decision rules in order to minimize the negative effect of human emotion on investment results. Part of the reason that we were comfortable with this is because of the mountain of research on momentum which suggests that momentum is a premier investment factor. With something that effective over time, why mess with it? Honing our craft is an ongoing process, but we take great pride in the level of consistency of our investment process over time.
Too often, our industry notes the percentage of active managers that fail to beat an index and comes to the wrong conclusion---essentially throwing the baby out with the bathwater. A much more telling statistic would be the percentage of systematic vs. non-systematic investment managers that beat an index over time. I suspect that the former number would be much higher than the latter.
The relative strength strategy is NOT a guarantee. There may be times where all investments and strategies are unfavorable and depreciate in value.

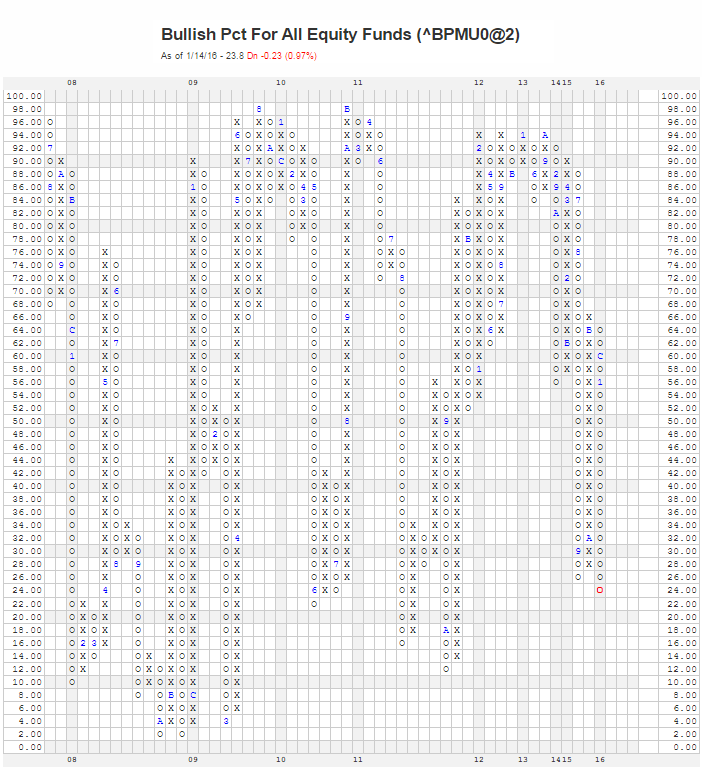
The Intermediate All Equity Funds bullish percent is moving through the bottom third and into the bottom quarter of the field position on the chart. This indicator measures the default intermediate charts for every mutual fund and ETF related to equity anywhere in the world markets. Major turbulence occurs at the lower section of a bullish percent’s field position, and you will want to brace your allocation for the potential of higher turbulence, while we see where the advance of sell signals bottoms out. We have not seen these levels in this bullish percent since 2011, and with several years of not having to face this type of action, you have to prepare yourself to navigate this situation now, in 2016.
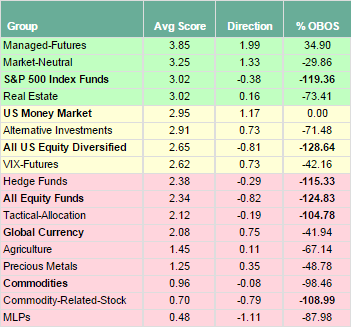
Alternative assets scores have surged recently, in context to a longer term modest rise in Group Score over the last couple years. The last surge was in the summer of 2015 and then it abated. Now the Alternatives universe is back close to the 3 score line.
Alternatives mean alternatives to basic long equity or basic long fixed income. Real Estate is often a “go to” place for investors historically. Here Real Estate does have a respectable score. But Managed Futures lead scoring among these groups now with a 3.85 as it shows the strongest positive Score Direction in this landscape. The near term is the wrong time to go contrarian and seek exposure to low relative strength ALTS. Commodities and such remain dangerous in this context until further notice. So for those concerned about equity exposures, you choices are to raise quality in equity towards larger cap exposures, along with a mixture of cash, Real Estate and Managed Futures can help your allocation behave more neutral while the market is in this period of turbulence.

Fixed Income is a very important piece to any allocation that is designed to work in bad weather. But make no mistake, if your aim is protect against equity erosion, then you can maintain exposure to High Yield. US High Yield as well as Global High Yield has at least a 0.7 correlation or higher to the S&P 500 equity benchmark. So the raising quality aspect to playing defense includes raising quality in fixed income for sure. The below score plot shows you the relative strength difference between US Government related funds versus US High Yield exposures. Each of these Score Lines include any mutual fund or ETF that trades in these respective spaces. High Yield funds trade on average just below 2 points and maintain a declining score path. US Government funds are trading above 3.50 score mark. At present there is no contest between the 2 groups and so you should continue to migrate to the Highest Quality at your disposal.

The Distribution Report below places Major Market ETFs and Indices into a bell curve style table based upon their current location on their 10-week trading band. The middle of the bell curve represents areas of the market that are "normally" distributed, with the far right being 100% overbought on a weekly distribution and the far left being 100% oversold on a weekly distribution. The weekly distribution ranges are calculated at the end of each week, while the placement within that range will fluctuate during the week. In addition to information regarding the statistical distribution of these market indexes, a symbol that is in UPPER CASE indicates that the RS chart is on a Buy Signal. If the symbol is dark Green then the stock is on a Point & Figure buy signal, and if the symbol is bright Red then it is on a Point & Figure sell signal.
The average Bullish Percent reading this week is 25.09% down 6.03% from the previous week
| <--100 | -100--80 | -80--60 | -60--40 | -40--20 | -20-0 | 0-20 | 20-40 | 40-60 | 60-80 | 80-100 | 100-> | |||
 |
||||||||||||||
| Symbol | Name | Symbol | Name |
| AGG | iShares Barclays Aggregate Bond Fund | NASD | Nasdaq Composite |
| CL/ | Crude Oil Continuous | NDX | NASDAQ Non Financial Index |
| DJIA | Dow Jones Industrial Average | RSP | Guggenheim S&P 500 Equal Weight ETF |
| DVY | iShares Dow Jones Select Dividend Index | RUT | Russell 2000 Index |
| DX/Y | NYCE U.S.Dollar Index Spot | SHY | iShares Barclays 1-3 Year Tres. Bond Fund |
| EFA | iSharesMSCI EAFE Index Fund | SML | S&P 600 Small Cap Index |
| FXE | CurrencyShares Euro Trust | SPX | S & P 500 Index |
| GC/ | Gold Continuous | TLT | iShares Barclays 20+ Year Treasury Bond Fund |
| GSG | iShares S&P GSCI Commodity-Indexed Trust | UV/Y | Continuous Commodity Index |
| HYG | iShares High Yield Corporate Bond Fund | VOOG | Vanguard S&P 500 Growth ETF |
| ICF | iShares Cohen & Steers Realty Index | VOOV | Vanguard S&P 500 Value ETF |
| IEF | iShares Lehman 7-10 Yr. Tres. Bond Fund | VWO | Vanguard MSCI Emerging Markets ETF |
| LQD | iShares iBoxx $ Investment Grade Corp. | XLG | Guggenheim Russell Top 50 ETF |
| MID | S&P 400 MidCap Index |

| Stock | Symbol | Sector | Current Price | Action Price | Target | Stop | Notes |
|---|---|---|---|---|---|---|---|
| Constellation Brands, Inc. | STZ | Food Beverages/Soap | $143.25 | 138-142 | 150 | 130 | 5 for 5'er, positive diverger, leader in Food and Beverages sector, positive weekly and monthly momentum. |
| Maxim Integrated Products Inc | MXIM | Semiconductors | $32.31 | 31-35 | 67 | 29 | 3/5'er, #12 ranking in NDX matrix, Yield above 3%, PB to middle of trading band. |
| Thermo Fisher Scientific Inc. | TMO | Healthcare | $135.79 | 136-144 | 186 | 130 | 4/5'er, Positive Divergence with New high in December, Spread Triple Top break. |
| Ball Corporation | BLL | Business Products | $68.82 | 68-71 | 89 | 63 | 5 for 5'er, favored Business Products Sector, newly positive monthly mom, multi-year positive trend |
| Equinix, Inc. | EQIX | Real Estate | $310.99 | 296-308 | 352 | 276 | 5 for 5'er, recently pullback from new highs, positive monthly momentum, yield of 2.23% |
| Dr Pepper Snapple Group | DPS | Food Beverages/Soap | $90.22 | 88-94 | 123 | 85 | 5 for 5'er, Leader in Food/Beverages sector, 90-100 play, strong R-R, recent pullback off new highs |
| Altria Group Inc. | MO | Food Beverages/Soap | $58.22 | 57-60 | 64.50 | 56/52.5 | 5 for 5'er, Yield Play, good R-R, member of the favored Consumer Staples Broad Group, pos wkly mom change |
| Stock | Symbol | Sector | Current Price | Action Price | Target | Stop | Notes |
|---|---|---|---|---|---|---|---|
| Clean Harbors Inc | CLH | Waste Management | $40.11 | (39-42) | 37 | 46 | 0 for 5'er, negative trend, laggard in unfavored Waste Management sector, lower buy stop to $46. |
| HCA Inc. | HCA | Healthcare | $65.12 | (65-69) | 58 | 71 | Unfavored Healthcare sector, 2 for 5'er, Negative diverger, below bearish resistance line, lowered buy stop to $71 |
| Stryker Corporation | SYK | Healthcare | $90.92 | (89-94) | 78 | 96 | 1/5'er, big base breakdown, negative diverger, add short exposure on bounces to low-90s |
| Zeltiq Aesthetics Inc | ZLTQ | Healthcare | $27.13 | (24-27) | 18 | 29 | 2/5'er, Unfavored sector, recent trend change to negative, break of key support, rally back to MED, good R-R short |
| Examworks Group Inc | EXAM | Healthcare | $25.70 | (24-26) | 20 | 29 | 2/5'er, new laggard in Unfavored Healthcare sector, bottom of HEAL RS matrix, negative RS and Trend change |
| Comment |
|---|
| MYGN Myriad Genetics Inc R ($40.18) - Biomedics/Genetics: With today's action, MYGN has given a second straight sell signal -- a double bottom breakdown at 40. This follows another lower top, as well; and now places MYGN right at its bullish support lie. At this point, MYGN is still an acceptable 4 for 5'er, so those long can hold here; but we would look to sell or hedge positions should MYGN break trend at 39. |
| OME Omega Protein Corporation R ($19.41) - Food Beverages/Soap: OME broke a double bottom at 19.50. This follows a lower top made at 23, below the November chart high of 25. Still in a strong uptrend, and a 5 for 5'er. Next support resides at 17.50. Moderately oversold here, and weekly momentum has been negative for 6 weeks. Those long may want to trim back positions here or hedge, but then look to use 17 as the worst case stop point as that would break a second bottom of support. |
EXAM Examworks Group Inc R ($25.69) - Healthcare: EXAM is a member of the Healthcare sector, a group which is Unfavored and has been losing relative strength. EXAM had been a solid performer for quite some time until topping out last April at 44. Since that time, EXAM has given a series of sell signals and shown a pattern of lower tops and lower bottoms. As well, in September EXAM violated its long-term bullish support line to change to an overall negative trend. RS sell signals vs. both the market and Peers were also given in the second half of 2015. In all, EXAM has downticked to a 2 for 5 reading. The bearish price objective is 20 based on the horizontal count, and there is initial resistance at 28, with no substantial support in sight. EXAM also sits at the bottom of the Healthcare RS matrix, at #94 (out of 110). The stock is only modestly oversold on its ten-week trading band, and the weekly momentum is on the verge of turning negative after having been positive for eight weeks. If long, sell this stock, otherwise you can consider selling EXAM short here (24 to 26 range). Then look to use 29 as the initial buy stop point.
| 11 | 12 | 13 | 14 | 15 | 16 | ||||||||||||||||||||||||||||||||||||||||||||||||
| 44.00 | 4 | • | 44.00 | ||||||||||||||||||||||||||||||||||||||||||||||||||
| 43.00 | X | O | • | • | • | 43.00 | |||||||||||||||||||||||||||||||||||||||||||||||
| 42.00 | X | X | O | X | • | X | • | X | • | 42.00 | |||||||||||||||||||||||||||||||||||||||||||
| 41.00 | X | O | X | 3 | O | X | O | X | O | X | O | • | 41.00 | ||||||||||||||||||||||||||||||||||||||||
| 40.00 | C | O | 2 | O | X | 5 | X | O | X | O | X | O | • | 40.00 | |||||||||||||||||||||||||||||||||||||||
| 39.00 | X | X | 1 | X | O | X | O | O | 6 | O | • | 39.00 | |||||||||||||||||||||||||||||||||||||||||
| 38.00 | X | X | O | X | O | X | O | 7 | • | 38.00 | |||||||||||||||||||||||||||||||||||||||||||
| 37.00 | X | X | O | X | O | X | O | O | 8 | • | 37.00 | ||||||||||||||||||||||||||||||||||||||||||
| 36.00 | X | O | X | O | X | X | B | X | O | X | O | X | • | 36.00 | |||||||||||||||||||||||||||||||||||||||
| 35.00 | X | O | X | 5 | X | O | A | O | X | O | X | O | X | O | 35.00 | ||||||||||||||||||||||||||||||||||||||
| 34.00 | X | 3 | X | O | X | O | X | O | O | X | O | X | O | 34.00 | |||||||||||||||||||||||||||||||||||||||
| 33.00 | X | 4 | X | O | 7 | 8 | X | O | O | 9 | 33.00 | ||||||||||||||||||||||||||||||||||||||||||
| 32.00 | X | X | O | O | X | 9 | O | Top | 32.00 | ||||||||||||||||||||||||||||||||||||||||||||
| 31.00 | 1 | O | X | O | 6 | O | 31.00 | ||||||||||||||||||||||||||||||||||||||||||||||
| 30.00 | C | O | X | O | X | O | 30.00 | ||||||||||||||||||||||||||||||||||||||||||||||
| 29.00 | X | 2 | O | X | • | O | 29.00 | ||||||||||||||||||||||||||||||||||||||||||||||
| 28.00 | X | X | O | • | O | X | 28.00 | ||||||||||||||||||||||||||||||||||||||||||||||
| 27.00 | • | A | O | X | • | O | C | O | 27.00 | ||||||||||||||||||||||||||||||||||||||||||||
| 26.00 | X | • | X | O | X | • | B | X | O | Med | 26.00 | ||||||||||||||||||||||||||||||||||||||||||
| 25.00 | 5 | O | • | 9 | B | • | O | X | 1 | 25.00 | |||||||||||||||||||||||||||||||||||||||||||
| 24.00 | 3 | O | • | X | • | O | X | O | 24.00 | ||||||||||||||||||||||||||||||||||||||||||||
| 23.00 | X | 7 | • | X | • | O | X | 23.00 | |||||||||||||||||||||||||||||||||||||||||||||
| 22.00 | X | O | • | 7 | • | O | 22.00 | ||||||||||||||||||||||||||||||||||||||||||||||
| 21.00 | X | 8 | • | X | • | 21.00 | |||||||||||||||||||||||||||||||||||||||||||||||
| 20.00 | X | O | • | X | • | Bot | 20.00 | ||||||||||||||||||||||||||||||||||||||||||||||
| 19.50 | X | X | O | • | X | 6 | • | 19.50 | |||||||||||||||||||||||||||||||||||||||||||||
| 19.00 | O | X | O | X | O | • | 5 | O | X | • | 19.00 | ||||||||||||||||||||||||||||||||||||||||||
| 18.50 | O | X | O | X | O | • | X | O | X | • | 18.50 | ||||||||||||||||||||||||||||||||||||||||||
| 18.00 | O | X | 1 | X | O | • | 4 | O | • | 18.00 | |||||||||||||||||||||||||||||||||||||||||||
| 17.50 | O | O | • | O | • | X | • | 17.50 | |||||||||||||||||||||||||||||||||||||||||||||
| 17.00 | • | O | • | X | • | 17.00 | |||||||||||||||||||||||||||||||||||||||||||||||
| 16.50 | • | O | • | X | • | 16.50 | |||||||||||||||||||||||||||||||||||||||||||||||
| 16.00 | • | O | X | X | • | X | • | 16.00 | |||||||||||||||||||||||||||||||||||||||||||||
| 15.50 | O | X | O | X | O | 3 | • | 15.50 | |||||||||||||||||||||||||||||||||||||||||||||
| 15.00 | O | X | O | X | O | X | 1 | • | 15.00 | ||||||||||||||||||||||||||||||||||||||||||||
| 14.50 | O | X | O | X | 9 | 9 | O | X | • | 14.50 | |||||||||||||||||||||||||||||||||||||||||||
| 14.00 | O | X | O | O | X | X | O | X | • | 14.00 | |||||||||||||||||||||||||||||||||||||||||||
| 13.50 | O | X | O | X | O | X | B | X | • | 13.50 | |||||||||||||||||||||||||||||||||||||||||||
| 13.00 | O | X | O | X | X | O | X | O | C | • | 13.00 | ||||||||||||||||||||||||||||||||||||||||||
| 12.50 | O | X | O | X | O | X | 8 | O | X | • | 12.50 | ||||||||||||||||||||||||||||||||||||||||||
| 12.00 | O | O | X | O | 6 | O | X | • | 12.00 | ||||||||||||||||||||||||||||||||||||||||||||
| 11.50 | O | X | 2 | 3 | 5 | X | O | • | 11.50 | ||||||||||||||||||||||||||||||||||||||||||||
| 11.00 | O | X | O | X | O | X | O | X | • | 11.00 | |||||||||||||||||||||||||||||||||||||||||||
| 10.50 | O | X | O | X | O | X | O | • | 10.50 | ||||||||||||||||||||||||||||||||||||||||||||
| 10.00 | O | X | B | 1 | O | • | 10.00 | ||||||||||||||||||||||||||||||||||||||||||||||
| 9.50 | A | X | O | X | • | 9.50 | |||||||||||||||||||||||||||||||||||||||||||||||
| 9.00 | O | X | O | X | • | 9.00 | |||||||||||||||||||||||||||||||||||||||||||||||
| 8.50 | O | O | X | • | 8.50 | ||||||||||||||||||||||||||||||||||||||||||||||||
| 8.00 | O | C | • | 8.00 | |||||||||||||||||||||||||||||||||||||||||||||||||
| 7.50 | O | X | • | 7.50 | |||||||||||||||||||||||||||||||||||||||||||||||||
| 7.00 | O | X | • | 7.00 | |||||||||||||||||||||||||||||||||||||||||||||||||
| 6.50 | O | • | 6.50 | ||||||||||||||||||||||||||||||||||||||||||||||||||
| 11 | 12 | 13 | 14 | 15 | 16 |
| Comments |
|---|
| ADBE Adobe Systems Incorporated ($88.80) - Software - While the technical attributes of ADBE are holding up, the trend is faltering and that is enough to warrant at least scaling back. On Friday, ADBE gave a second sell signal, a spread triple bottom at 87. This breakdown follows a violation of the bullish support line at 88. The next support is the 80-81 area which is also the bottom of the ten week trading band. |
| BAC Bank of America ($14.46) - Banks - Like many stocks here, we look at breakdowns and then look to see where the next support levels can be found. In the case of BAC, it is holding up on a relative basis as the technical attributes are a 4 out of 5. The recent breakdown at 14.5 is a tripe bottom but there is support at 14.50 so holders of this one can give it some room to 14 which violates all near term support. The next support after that is 10.50, the bullish support line. |
| CHTR Charter Communications, Inc. ($164.45) - Internet - CHTR reversed down into a column of O's and fell to the $164 level. With this move, CHTR violates the support at $168. The next level of support for CHTR is at the August correction low of $162. Any move below the correction low level would warrant further defensive action. Avoid any new exposure for now. |
| CRI Carter's, Inc. ($89.36) - Textiles/Apparel - After hitting resistance at $94 for the third time in the past four months, CRI reversed down and has now fallen to the $89 level. This move breaks a double bottom and violates the bullish support line at $89. From here, CRI will become a 3 for 5'er in attribute reading. Okay to hold here, but look to begin to trim on any further violations of support. From here, notable support for CRI resides in the $83 to $87 range. |
| GOOGL Alphabet Inc. Class A ($710.49) - Internet - GOOGL broke its bullish support line this week dropping the technical attribute score to four. Given the defensive posture we have taken in this market, we would look to use this development as a sign to trim or at least hedge. The chart sits at $704 with next support at $672. The August, 2015 low rests at $568. |
| HAS Hasbro, Inc. ($72.07) - Leisure - HAS broke a quadruple top to give a buy signal at $72. This move also tests the bearish resistance line. Should the stock move to $73 on the chart, the trend will reverse to positive and the technical attribute rating will rise to a 3 for 5'er. Weekly momentum just turned positive suggesting the potential for further movement to the upside from here. Note the yield of 2.55% as well. This is one to add to watch lists. |
| HD Home Depot, Inc. ($118.88) - Building - The technical attributes of HD continue to be very strong and on a relative basis, this stock continues to do well. On an absolute price basis, HD has given a sell signal, a double bottom at 118. With more support in the 112 to 108 area, we would be inclined to give HD a little room here and use a violation of that support area as a stop loss point. |
| NFLX NetFlix Inc. ($104.04) - Internet - NFLX has given three consecutive sell signals since its November 2015 high at $132, and after a series of lower tops and lower bottoms, the chart rests now at $102. However, the stock maintains all five positive technical attributes and would need to fall substantially to $79 to break trend. For more near-term support we would look to the $97 level and any violation of this level of support would potentially warrant defensive action. |
| SHLD Sears Holdings Corporation ($17.00) - Retailing - Retailers have been struggling of late and SHLD is no exception. The stock violated its bullish support line at 38 in June of last year and has continued to give sell signals. In fact, the sell signal at 17 in January was the fourth consecutive one. No visible signs of support here and would continue to avoid or move to the sidelines if long. |
| WBA Walgreens Boots Alliance Inc. ($79.93) - Retailing - WBA completed a bearish catapult by falling below the $79 level. WBA recently violated its bullish support line earlier in January at $81. With recent action, WBA now sits on the November low support level at $79. From here, those holding WBA should look to take defensive action upon the violation of support at $79. On the longer term side of the spectrum the August correction lows remain intact as viable support levels, but any move below the correction lows at $77 should present further evidence to take defensive action. |
| Name | Option Symbol | Action | Stop Loss |
|---|---|---|---|
| Ball Corporation - $68.97 | O:BLL 16E65.00D20 | Buy the May 65.00 calls at 8.30 | 63.00 |
| Name | Option | Action |
|---|---|---|
| Costco Wholesale Corporation ( COST) | Apr. 150.00 Calls | Stopped at 150.00 (CP: 150.48) |
| Name | Option Symbol | Action | Stop Loss |
|---|---|---|---|
| Stryker Corporation - $91.11 | O:SYK 16R95.00D17 | Buy the June 95.00 puts at 8.30 | 96.00 |
| Name | Option | Action |
|---|---|---|
| Hasbro, Inc. (HAS) | Apr. 72.50 Puts | Stopped at 72.00 (CP: 71.67) |
| Bed Bath & Beyond Inc. (BBBY) | Feb. 60.00 Puts | Raise the option stop loss to 13.35 (CP: 15.35) |
| National-Oilwell, Inc. (NOV) | Feb. 45.00 Puts | Raise the option stop loss to 13.10 (CP: 15.10) |
| Nucor Corporation (NUE) | Apr. 45.00 Puts | Raise the option stop loss to 7.70 (CP: 9.70) |
| Schnitzer Steel Industries (SCHN) | Feb. 18.00 Puts | Raise the option stop loss to 2.70 (CP: 4.70) |
| Tenet Healthcare Corporation (THC) | Feb. 37.50 Puts | Raise the option stop loss to 12.00 (CP: 14.00) |
| Quintiles Transnational Holdings Inc. (Q) | Feb. 70.00 Puts | Raise the option stop loss to 4.80 (CP: 6.80) |
| Sina.com (SINA) | Mar. 52.50 Puts | Raise the option stop loss to 6.40 (CP: 8.40) |
| United Technologies Corporation (UTX) | May. 105.00 Puts | Raise the option stop loss to 16.15 (CP: 18.15) |
| GameStop Corporation (GME) | Apr. 35.00 Puts | Raise the option stop loss to 7.80 (CP: 9.80) |
| WestRock Co (WRK) | Apr. 55.00 Puts | Raise the option stop loss to 13.80 (CP: 15.80) |
| Hyatt Hotels Corp. (H) | Feb. 55.00 Puts | Raise the option stop loss to 16.10 (CP: 18.10) |
| Harley-Davidson, Inc. (HOG) | May. 50.00 Puts | Raise the option stop loss to 8.20 (CP: 10.20) |
| Dover Corporation (DOV) | Mar. 65.00 Puts | Raise the option stop loss to 9.40 (CP: 11.40) |
| Analog Devices, Inc. (ADI) | Mar. 60.00 Puts | Raise the option stop loss to 8.40 (CP: 10.40) |
| Woodward Inc (WWD) | Apr. 55.00 Puts | Raise the option stop loss to 6.70 (CP: 8.70) |
| GNC Holdings Inc (GNC) | Mar. 35.00 Puts | Raise the option stop loss to 7.00 (CP: 9.00) |
| Community Health Care (CYH) | Jun. 30.00 Puts | Initiate an option stop loss of 8.10 (CP: 10.10) |
| Endo International PLC (ENDP) | Jul. 65.00 Puts | Raise the option stop loss to 11.60 (CP: 13.60) |
| Yum! Brands, Inc. (YUM) | Jul. 75.00 Puts | Raise the option stop loss to 8.65 (CP: 10.65) |
| Name | Option Sym. | Call to Sell | Call Price | Investment for 500 Shares | Annual Called Rtn. | Annual Static Rtn. | Downside Protection |
|---|---|---|---|---|---|---|---|
| Sonic Corporation $29.82 | O:SONC 16F30.00D17 | Jun. 30.00 | 2.30 | $13,658.00 | 20.75% | 17.21% | 6.77% |
| Name | Action |
|---|---|
| Wayfair Inc. (W) - 40.03 | Sell the May 50.00 Calls. |
| Abiomed, Inc (ABMD) - 87.88 | Sell the June 95.00 Calls. |
| Facebook Inc. (FB) - 98.37 | Sell the June 105.00 Calls. |
| NVIDIA Corporation (NVDA) - 28.67 | Sell the June 30.00 Calls. |
| Chuy's Holdings Inc. (CHUY) - 35.76 | Sell the April 37.50 Calls. |
| Activision Blizzard, Inc. (ATVI) - 35.40 | Sell the May 36.00 Calls. |
| Name | Covered Write |
|---|---|
| Ceva, Inc. ( CEVA - 22.82 ) | June 25.00 covered write. |
| Ross Stores, Inc. ( ROST - 52.82 ) | May 55.00 covered write. |
Daily Equity & Market Analysis
Loading, Please Wait...

